IDENTIFYING HIGH-RISK POPULATIONS OF TUBERCULOSIS USING
ENVIRONMENTAL FACTORS AND GIS BASED MULTI-CRITERIA
DECISION MAKING METHOD
A. R. Abdul Rasam a,b,*, N. M. Shariff a , J. F. Dony c
a
Geography Programme, School of Distance Education, Universiti Sains Malaysia, Penang, Malaysia- [email protected]
b
Centre of Studies for Surveying Science and Geomatics, Faculty of Architecture, Planning and Surveying, Universiti Teknologi MARA, Malaysia- [email protected]
c
Sabah State Health Department, Ministry of Health, [email protected]
KEY WORDS: GIS Index Model, Spatial MCDM, Risk Map, Shah Alam, Tuberculosis, Environment
ABSTRACT:
Development of an innovative method to enhance the detection of tuberculosis (TB) in Malaysia is the latest agenda of the Ministry of Health. Therefore, a geographical information system (GIS) based index model is proposed as an alternative method for defining potential high-risk areas of local TB cases at Section U19, Shah Alam. It is adopted a spatial multi-criteria decision making (MCDM) method for ranking environmental risk factors of the disease in a standardised five-score scale. Scale 1 and 5 illustrate the lowest and the highest risk of the TB spread respectively, while scale from 3 to 5 is included as a potential risk level. These standardised scale values are then combined with expert normalised weights (0 to 1) to calculate the overall index values and produce a TB ranked map using a GIS overlay analysis and weighted linear combination. It is discovered that 71.43% of the Section is potential as TB high risk areas particularly at urban and densely populated settings. This predictive result is also reliable with the current real cases in 2015 by 76.00% accuracy. A GIS based MCDM method has demonstrated analytical capabilities in targeting high-risk spots and TB surveillance monitoring system of the country, but the result could be strengthened by applying other uncertainty assessment method.
* Corresponding author
1. INTRODUCTION
1.1 Background
In 2014, the World Health Organization (WHO) estimated about 9.6 million and 1.5 million global TB cases and related to TB deaths respectively. Ministry of Health Malaysia (2015) reported the notification rate had increased from 72 per 100,000 populations (in 2011) to 81 per 100,000 populations (in 2014). The common risk factors contributing to the 22 high burden countries worldwide are low socio-economic status and environmental factors, however for developed countries, many of the cases are mainly driven by bovine tuberculosis and foreign-born citizen (Oppong et al., 2014; Oren et al., 2014).
TB distribution pattern in Malaysia is rather complex due to the dynamics of the disease and the characteristics of the affected areas, thus every state health department may adopt relevant approaches to control the disease meritoriously. An urban setting of Shah Alam is selected as a study area in order to understand how the environment and urbanicity may influence the local tuberculosis as demonstrated by global scholarly researchers (Abdul Rasam et al., 2015; Harling & Castro, 2014; Liu et al., 2012; Maciel et al., 2013; Queiroga et al., 2012; Zaragoza Bastida et al., 2012).
WHO (2015) reported 37% of the 9.6 million people estimated went unidentified or were not notified by the official system. Detecting the missing cases using a holistic approach is also a major challenging task for local health department towards achieving WHO End TB Strategy, which is holistic TB prevention care and control after 2015. Producing an accurate predictive model of diseases spread requires sufficient knowledge on biological transmission and key localised factors, a good quality data, and integrated approaches.
This study proposed to develop a GIS index model for identifying potential high-risk areas of TB occurrences in Section U19, Shah Alam. It is a spatial multi-criteria decision making (MCDM) method for producing a risk map based on the index values (Chang, 2011; Malczewski, 2000) and environmental risk factors of local TB. A GIS-based MCDM model is generally applied for suitability and vulnerability exploration with cautious consideration of suitable criteria or factors (Chang, 2011), particularly in managing better environmental health decision making system (Alcorn et al.,
2013; Fuller et al., 2014; Satta et al., 2016).
explicit decision support system (Fuller et al., 2014) and hypothesizes that the most potential cases might occur at high urban areas due to crowded places, rapid development, low socio-economic population and other triggering environmental factors.
2. REVIEW ON GIS-BASED MCDM METHOD FOR DISEASE AND HEALTH APPLICATIONS
2.1 Integrating GIS and MCDM Method
The complexities of spatial decision making issues such as vulnerability analysis, site selection, and other environmental applications require decision makers to consider the suitable choices and alternatives. Malczewski (2006) enlightens the benefit of integrating MCDA technique into GIS procedures through inserting value judgments with regard to assessment criteria into spatial decision-making processes. The MCDM is a tool to find the best alternative among a set of feasible alternative (Sánchez-Lozano et. al., 2013), which decision is taken based on evaluation of one or more criteria (Eastman, 1999). On the other hand, GIS is capable to display and analyse spatial data to support the process of environmental decision-making (Eastman, 1999). Therefore, by combining both approaches, a decision making process may be done by means of spatial criteria to deal with spatiality of the problem. But, some experts have also suggested strategies to enhance the capabilities of the technique by utilizing a public GIS participatory, big data and multidisciplinary methodologies (Comes et al., 2011; Stevens & Pfeiffer, 2011; Pfeiffer & Stevens, 2015)
2.2 Calculating Criterion Weight and Expert Opinion in GIS based MCDM Method
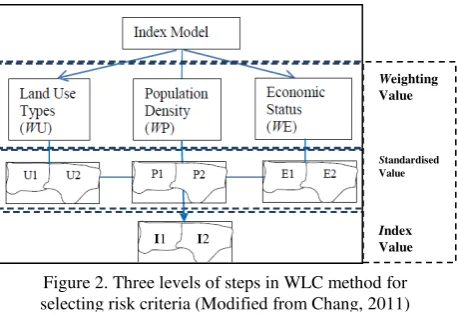
The GIS based MCDM method uses an index model that computes the index value for each unit area and produces a ranked based on the related environmental risk factors and local standard guidelines. Weighted linear combination (WLC) is a common method for calculating the index value the model in MCDA (Chang, 2011) for incorporation factors and constraints (Malczewki, 2006). The model involves multi-criteria evaluation and depends on overlay operations for data processing as shown in figure 2. Malczewski (1999) enlightens the main phase in eliciting the decision maker’s preferences is derivation of criterion weights, where an alternative decision
matrix or table is organized with given attributes and associated weights. Then, the simplest ranking technique (e.g. rank sum, rank reciprocal and rank exponential) is used to assess the importance of weights by arranging it in rank order and decision maker’s preference. The other techniques can be used are Analytical Hierarchical Process (AHP) and pairwise comparison process. The decision makers need to guess the rating weights based on predetermined scale such as a scale from 1 to 5 0 or 1 to 100. The highest score is assigned to the most important criterion and the lowest weight to the lowest order criterion.
2.3 GIS based MCDM Method for Tuberculosis Analysis
The integration of GIS and MCDM techniques in disease and health applications can assist related agencies to make a better decision for risk pollution and contamination (Torre et al.,
2012; Liu et al., 2013), healthcare services (Diaby et al., 2013), hazard assessment (Alcorn et al., 2013; Satta et al., 2016) and epidemiology (Fuller et al., 2014). In general, these studies used common steps from original MCDM technique that applied by Malczewsski (2000) and Pfeiffer & Stevens (2015) for spatial epidemiology with appropriate local modifications (Fuller et al.,
2014; Lahue et al., 2016), starting from an objective determination to map validation. In Malaysia, this kind of technique has been used in particular applications such as natural disaster and ecological studies, but the technique is still limited applications in the context of disease or health, especially for TB and lung disease. Therefore, by considering the nature of employment of GIS and MCDM using criterion weights and expert opinion, it can define the level of importance of each spatial criterion of the potential TB occurrences. Besides this, the benefit of combining technique may be obtained in the case of deciding the most preferred intervention to enhance the environmental quality to reduce TB occurrence potential.
Weighting Value
Standardised Value
Index Value
Figure 2. Three levels of steps in WLC method for selecting risk criteria (Modified from Chang, 2011)
I1 I2 Figure 1. Location of the study area, Section U19
3. METHODOLOGY
3.1 Research Framework
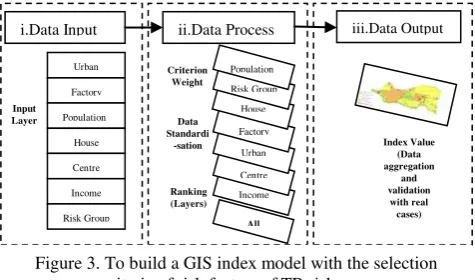
Referring to transmission processes of TB epidemic, the weighted linear combination (WLC) in GIS index model and MCDM technique are integrated to calculate the index value and to produce a risk map of the disease. These techniques are adapted from Malczewski (2000) and Chang (2011), consisting of three main stages: i) Data input ii) Data Process including determination of the criterion weights and value standardisation of each criterion and iii) Data output or outcome comprising calculation of index value and validation process (Figure 3). Selected environmental risk factors (Table 1), TB cases, expert’s opinion value and base maps of the study area are main datasets used and then are processed with ArcGISTM and SPSS packages.
3.2 Criterion Weights
Table 1 indicates seven common risk factors of local TB are reasonably chosen according to global TB epidemics, including the indicators of ecology, population, and socio-economic status, SES. Each risk factor or criterion of the indicator was ranked using rank sum technique (equation 1) and expert opinion from selected staffs of the District Health Office (PKD), Petaling. The technique is the simplest and most popular method employed to quantify the importance of weights, while four local experts are chosen based on their real experience during TB surveillance and site investigation. For example, the monthly household income (I) in SES is the minor criteria contributed to TB that was ranked 7 and assigned the lowest weight as 1. Then, this weight value was divided by the total values of weight (28) and multiplied with 1 to get the normalised weight value of the income of 0.04 (i.e. 1 / 28*1).
No Selected Risk Factors / Criterion
Since some original data are formed as nominal values, a ranking procedure based on local expertise and government standard guidelines are used to convert the data into a standardised range of 1 to 5. The more range of value, the more risk of the criterion/ sub-criterion will be. Household income as an example, the Economic Planning Unit of the Prime Minister’s Department Malaysia (2012) defined poverty as people who is in average monthly household income at or below RM 830.00. Thus, this study assumed that the people who gained average incomes less than RM 830.00 were included as risk groups (value 5), while people earning more than RM 2490.00 or low-risk groups were categorised as value 1 and value 2. Each criterion was then mapped using symbological or interpolation techniques.
3.4 Index Value and Risk Map
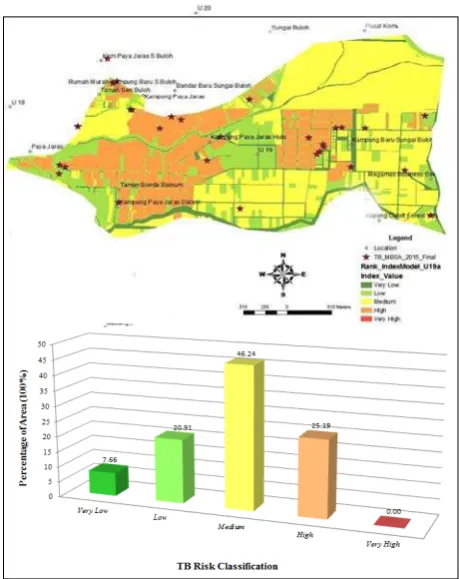
The final step is that data aggregation for deriving the index value using overlay analysis and weighted linear combination. The index value was computed for each unit area in the output by summing the weighted criterion values. For instance, (assume each criterion has value 3 in medium risk), particular unit area in the study area has an index of 3 (U x 0.11 + F x 0.14 + P x 0.25 + H x 0.18 + C x 0.07 + I x 0.04 + R x 0.21). This area was classified as the medium risk (class 3 as showed in Figure 5) in the TB ranked map that consist of a five-score class from the lowest risk area (class 1) to the highest risk area (class 5).
4. RESULTS AND ANALYSES
4.1 Potential Risk Factors of Tuberculosis Occurrences
The selection of the level of TB risk factors is important to determine which significant variables influencing the local TB occurrences. Seven common risk factors are selected based on global TB factors since there is no single standard on the risk preferences for all countries in the world (Table 1). Figure 4 displays the overall result of risk level (from 0 to 1) of the factors in relation to the experts’ opinion from the District Health Office, Petaling Selangor. As expected earlier, the combined result of the opinion showed that the number of population (0.25) and concentration of high risk group (0.21) are the most dominant factors compared to others. Both of them are categorised as population driven factor that contribute 46 per cent of the overall local risk factors. Then, it is followed by the factors of biophysical environment and socio-economic status that consist of the type of house factors (0.18), a distance of a factory from the house location (0.14), type of land use or urban level (0.11), distance of healthcare facilities from housing location (0.07) and household income or SES (0.04).
iii.Data Output
i.Data Input ii.Data Process
Urban
Human or population is preferred as the main indicator of TB endemics in Shah Alam compared to ecological indicators and SES. Population-based factors is a common risk variable of TB as occurred in other endemic regions such as Latin America, Asia, and Africa because of people in a building and community determines triggering situations in an environment. The crowded environment in a village, for instance, is not only creating the uneasy view, but also produce a conducive condition for airborne diseases (Zaragoza Bastida et al., 2012; Erazo et al., 2014; Harling & Castro, 2014). The population is also strongly associated with high risk people, human lifestyle and mobility. For example, Feske (2011) clarified foreign-born cases in Houston, USA was empirically proven to be the result of recent transmission via their homeless movement and public transportation.
4.2 Potential Risk Areas of Tuberculosis for Intervention Programme
Identifying the potential endemic and targeted intervention areas of TB in Shah Alam using GIS-based MCDM method is a main agenda of the study. MCDM technique ranks human population as more influential criterion than ecology and SES, and a GIS model used for producing a TB risk map based on these criteria weights. Figure 5 indicates the potential risk areas in the section are 71.43%, covering from a moderate risk (class 3) to a very high risk (class 5). Although the Section has 25.19% potential high-risk areas, the overall situation of TB is still in medium burden. As previously expected, the landscape characteristics of high-risk spots are more populated, urbanised and dense living conditions similar to the endemic locations such as Kampung Paya Jaras Hilir, Kampung Baru Sungai Buloh and Kampung Paya Jaras Dalam.
A fascinating finding also revealed that majority of the hot spot areas are close to other urban cities such as Damansara, Petaling Jaya, and Kuala Lumpur. These situations are similar to TB transmission in Brazil (Queiroga et al., 2012) and Mexico (Zaragoza Bastida et al., 2012), where the highest incidence rates of the disease are found in more urban regions, especially in the most socially and economically vulnerable spaces. Spatial neighbourhoodsfactor also seems to be associated with the local TB spread, hence a geographical proximity needs to be more paid attention in this study as suggested by Feske et al.,
(2011) which statedthateffective TB elimination strategies in the USA will require the risky geographical elucidation.
With regards to the model validation, the accuracy of this risk map is 76% as 19 out of the 25 cases are located in the potential risk areas. But, some areas of the risk still occur in the low-risk spots due to other dynamic factors and uncertainty errors. The map could be beneficial to the PKD petaling (Unit TB) for prioritising the targeted intervention programme such as TB screening and treatment.
5. CONCLUSIONS
The current national agenda towards achieving holistic tuberculosis (TB) prevention control after 2015 is to strengthen the existing methods in detecting the missing cases of TB. A GIS-MCDM model has potential functionalities to be integrated with biomedical methods for better TB site surveillance and control programme, particularly in prioritising influential factors and disease mapping. The overall scenario of TB in Section U19 is a moderate burden with more than half of the areas has the potential to be exaggerated by the disease. The landscape characteristics of high-risk areas are more populated, urbanised and crowded environments as occurred in the endemic regions worldwide. Spatial neighborhood risk factor is suggested to be investigated further since the factor may also associated with the local TB transmission and its surrounding.
ACKNOWLEDGEMENTS
The Authors would like to thank the TB/Leprosy Unit of Selangor States Health Department and the Petaling District Health Office for providing an intuitive opinion in this research paper. The Institute of Postgraduate Studies (IPS) from Universiti Sains Malaysia (USM) is also appreciated for providing a conference fund.
Figure 4. Risk level of the TB factors according to the selected experts’ opinion at Section U19
REFERENCES
Abdul Rasam, A. R., Shariff, M. N., Kusnin, F., and Dony, J. F., 2015. Spatial exploration of tuberculosis distribution in the State of Selangor, Malaysia: a preliminary study using GIS techniques. Paper presented at the International Conference on
Development and Socio-Spatial Inequalities 2015, Penang,
Malaysia, 19-20 August 2015.
Alcorn, R., Panter, K. S., and Gorsevski, P. V., 2013. A GIS-based volcanic hazard and risk assessment of eruptions sourced within Valles Caldera, New Mexico. Journal of Volcanology
and Geothermal Research, 267, pp. 1–14.
doi:10.1016/j.jvolgeores.2013.09.005
Chang, K., 2011. Introduction to Geographic Information
Systems, New York, USA.McGraw Hill, pp. 389.
Eastman R. (1999). Multi-criteria evaluation and GIS. Chap. 35. In: Longley PA, Goodchild MF, Maguire DJ, Rhind DW (eds) Geographical information systems. Wiley, New York. pp. 493-502.
Feske, M. L., Teeter, L. D., Musser, J. M., and Graviss, E. a., 2011. Including the third dimension: a spatial analysis of TB cases in Houston Harris County. Tuberculosis (Edinburgh,
Scotland), 91 (1), pp 24–33. doi:10.1016/j.tube.2011.10.006.
Fuller, D. O., Troyo, A., Alimi, T. O., and Beier, J. C., 2014. Participatory risk mapping of malaria vector exposure in northern south america using environmental and population data. Applied Geography (Sevenoaks, England), 48, pp. 1–7. doi:10.1016/j.apgeog.2014.01.002
Harling, G., and Castro, M. C., 2014. A spatial analysis of social and economic determinants of tuberculosis in Brazil.
Health & Place, 25, pp. 56–67.
doi:10.1016/j.healthplace.2013.10.008
Liu, Y., Li, X., Wang, W., Li, Z., Hou, M.,Guo, X., 2012. Investigation of space-time clusters and geospatial hot spots for the occurrence of tuberculosis in Beijing, 16(February), pp. 486–49.
Maciel, E. L. N., Pan, W., Dietze, R., Peres, R. L., Vinhas, S. A., Ribeiro, F. K., Golub, J. E., 2013. Spatial patterns of pulmonary tuberculosis incidence and their relationship to socio-economic status in Vitoria, Brazil. Int J Tuberc Lung Dis,
14(11), pp. 1395–1402.
Malczewski, J., 2000. On the use of weighted linear combination method in GIS:Common and best practice approcahes.Transanctions in GIS, 4, pp. 50-22.
Oppong, J. R., Mayer, J., and Oren, E., 2014. The global health threat of African urban slums: the example of urban tuberculosis. African Geographical Review, (December), pp. 1– 14. doi:10.1080/19376812.2014.910815
Oren, E., Narita, M., Nolan, C., and Mayer, J., 2014. Neighborhood socioeconomic position and tuberculosis transmission: a retrospective cohort study. BMC Infectious
Diseases, 14(1), 227. doi:10.1186/1471-2334-14-227
Queiroga, R. P. F. de, Sá, L. D. de, Nogueira, J. de A., Lima, E. R. V. de, Pinheiro, P. G. O. D., Silva, A. C. O., and Braga, J. U., 2012. Spatial distribution of tuberculosis and relationship
with living conditions in an urban area of Campina Grande – 2004 to 2007 Distribuição espacial da tuberculose e a relação com condições de vida. Rev Bras Epidemio, 15(1), pp. 222– 232.
Sánchez-Lozano J. M., Teruel-Solano J., Soto-Elvira, P. L. and García-Cascales M. S. (2013). Geographical Information System (GIS) and Multi-Criteria Decision Making (MCDM) methods for the evaluation of solar farms locations: Case study in south-eastern Spain. Renewable and Sustainable Energy
Reviews 24. pp. 544-556.
Satta, A., Snoussi, M., Puddu, M., Flayou, L., and Hout, R., 2016. An index-based method to assess risks of climate-related hazards in coastal zones: The case of Tetouan. Estuarine,
Coastal and Shelf Science, 175, pp. 93–105.
doi:10.1016/j.ecss.2016.03.021
World Health Organization [WHO]., 2015. Yearly Report “Global Tuberculosis Report 2015”, France http://apps.who.int/iris/bitstream/10665/191102/1/9789241565 059_eng.pdf?ua=1 (29 July 2016).