ASSESSING CHANGES IN POTATO CANOPY CAUSED BY LATE BLIGHT IN
ORGANIC PRODUCTION SYSTEMS THROUGH UAV-BASED PUSHBROOM
IMAGING SPECTROMETER
M. H. D. Franceschini a,*, H. Bartholomeus a, D. van Apeldoorn b, J. Suomalainen a,c, L. Kooistra a
a
Laboratory of Geo-Information Science and Remote Sensing, Wageningen University and Research, P.O. Box 47, 6700 AA Wageningen, The Netherlands - (marston.franceschini, harm.bartholomeus, lammert.kooistra)@wur.nl
b
Farming Systems Ecology group, Wageningen University and Research, PO Box 430, 6700AK Wageningen, The Netherlands - [email protected]
c
Finnish Geospatial Research Institute, National Land Survey of Finland, Geodeetinrinne 1, 02430 Masala, Finland - [email protected]
Commission I, ICWG I/II
KEY WORDS: hyperspectral imagery; Vis-NIR spectroscopy; organic potato production; late blight.
ABSTRACT:
Productivity of cropping systems can be constrained simultaneously by different limiting factors and approaches allowing to indicate and identify plants under stress in field conditions can be valuable for farmers and breeders. In organic production systems, sensing solutions are not frequently studied, despite their potential for crop traits retrieval and stress assessment. In this study, spectral data in the optical domain acquired using a pushbroom spectrometer on board of a unmanned aerial vehicle is used to evaluate the potential of this information for assessment of late blight (Phytophthora infestans) incidence on potato (Solanum tuberosum) under organic cultivation. Vegetation indices formulations with two and three spectral bands were tested for the complete range of the spectral information acquired (i.e., from 450 to 900 nm, with 10 nm of spectral resolution). This evaluation concerned the discrimination between plots cultivated with only one resistant potato variety in contrast with plots with a variety mixture, with resistant and susceptible cultivars. Results indicated that indices based on three spectral bands performed better and optimal wavelengths (i.e., near 490, 530 and 670 nm) are not only related to chlorophyll content but also to other leaf pigments like carotenoids.
1. INTRODUCTION
Monitoring approaches focusing on the assessment of crop development in the field can assist in the detection of plant stress with application in scenarios of limited production due to abiotic and/or biotic factors (Behmann et al., 2014). Such applications can guide the implementation of management practices by farmers or provide high-throughput solutions for field-based phenotyping frameworks. Remote and proximal sensing in the optical domain can be used in non-destructive retrieval of crop traits or to detected stress occurrence over the growing season. For instance, the application of vegetation indices based on physical or statistical relations between vegetation properties and its spectral response may provide a viable alternative to assess disease severity in crops (Mahlein et al., 2013). Although these approaches have great potential for practical application their evaluation concerning organic production systems is still underrepresented. Organic production of potato is mainly limited by nitrogen shortage and late blight occurrence, together with other stress factors that may affect the crop development, in particular for crops cultivated in organic systems. Also, assessment of late blight incidence and severity in potato based on optical sensing solutions has not been extensively studied yet, especially concerning data acquired at canopy level. Therefore, the present study aims to evaluate different two and three bands vegetation indices formulations with different combinations of spectral bands, in the visible and near-infrared, in order to identify important spectral regions and vegetation indices for late blight assessment at canopy level.
2. STUDY SITE
Data acquisition was performed on twelve plots cultivated with potato, during the 2015 growing season, as described by Franceschini et al. (2017). These plots were part of a stripcropping experiment and two cultivation methods were compared for this crop: (a) plots in which a variety mixture of four different cultivars, Annabelle, Ditta, Tiamo and Toluca, with different degrees of resistance (from low to high, respectively) to late blight, were iterated in each crop row, referred as mixed crop system; and (b) plots cultivated with only one potato variety (Toluca) considered highly resistant to late blight, named non-mixed system. The main objective of this experiment was to evaluate crop development and disease occurrence for these two organic production systems. In this context the potential of UAV-carried spectrometer for monitoring plant growth and disease development was tested. For that, UAV flights were followed by late blight severity assessments, according to the methodology described by the European and Mediterranean Plant Protection Organization - EPPO (2008).
3. UAV-BASED HYPERSPECTRAL DATA
Acquisition of spectral data was performed during the growing season using the WageningenUR Hyperspectral Mapping System (HYMSY), an UAV-based pushbroom imaging system (Suomalainen et al., 2014). Reflectance measurements were obtained in wavelengths between 450 and 915 nm, resampled to 10 nm of spectral resolution and 0.2 m of ground sampling distance. Although, data acquisition was performed in five different dates during the crop development, as described by Franceschini et al. (2017), analysis reported here are restricted to the last dataset obtained, since only on this date late blight The International Archives of the Photogrammetry, Remote Sensing and Spatial Information Sciences, Volume XLII-2/W6, 2017
International Conference on Unmanned Aerial Vehicles in Geomatics, 4–7 September 2017, Bonn, Germany
This contribution has been peer-reviewed.
was detected through visual assessment. The objective is to extend results reported previously concerning the evaluation of the disease incidence through optical spectral data.
4. OPTIMIZATION OF VEGETATION INDICES FOR DISCRIMINATION OF DISEASED CROP
In order to assess the potential of the spectral data to discriminate differences between treatments in the experiment, which were mainly related to late blight incidence, vegetation indices were evaluated. Some of the most used formulations for two and three spectral bands, indicated by le Maire et al. (2004), Yu et al. (2014) and Verrelst et al. (2015), were tested (Table 1): difference indices (DI); ratio indices (RI); normalized DI (NDI); difference of RI (DRI); and ratio of DI (RDI).
Index Formulation Nbr. of
spectral bands
DI Ri-Rj 2
RI Ri Rj 2
NDI Ri- Rj Ri+ Rj 2
DRI Ri- Rj Rk 3
RDI Ri- Rj Rk- Rj 3
Table 1. Formulations of vegetation indices
The discriminative potential of the different indices and the spectral bands assigned to then was judged based on the Bhattacharyya distance (B-dist.), as performed by Kim et al. (2015). This parameter was used to compare the distribution of vegetation indices corresponding to each treatment (i.e., increasing values from zero corresponding to increasingly distinct distributions). Therefore, for each index and spectral band combination, results corresponding to plots of the non-mixed system were compared to those related to plots of the mixed system. Considering the differences related to late blight development in plots under the different production systems, it was expected that the optimization effort would indicate important spectral regions and vegetation indices formulations for the discrimination of healthy from diseased areas through spectral information acquired at canopy level.
5. RESULTS AND CONCLUSIONS
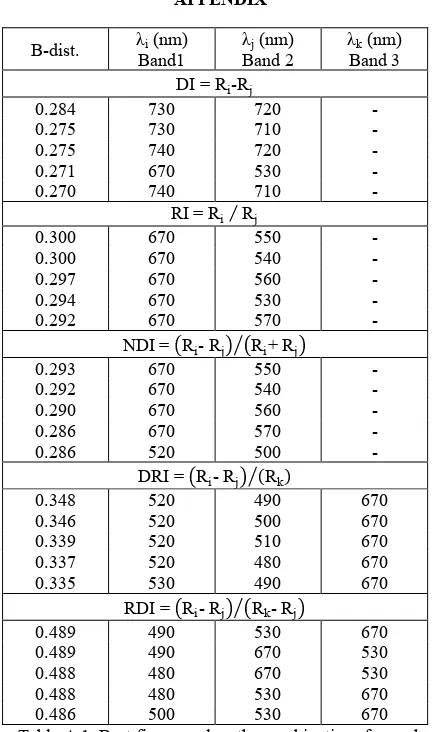
For vegetation indices that use two spectral bands the best segregation between plots of the different treatments was observed using ratio indices (RI; Figure 1b, Table A.1). However, results were comparable to those obtained using normalized difference indices (NDI; Figure 1c, Table A.1), including the optimal spectral bands selected in both cases, i.e., band one centred at 670 nm and band two between 530–570 nm, in most cases. The spectral region near 670 nm is characterized by strong energy absorption by chlorophylls, while reflectance in wavelengths near 530 nm can be associated mainly to other leaf pigments like carotenoids. Difference indices (DI) had a slightly worse performance and relied on a different spectral region in comparison with RI and NDI, with optimal bands frequently located between 710 and 740 nm, in the red-edge region (Figure 1a, Table A.1). For RI and NDI, bands in the red edge also performed well but in this case they were outperformed by bands in the red and green regions.
(a) (b) (c)
Figure 1. B-dist. for combinations of bands using DI (a), RI (b) and NDI (c).
Vegetation indices based on three spectral bands provided better discriminative potential than those formulated using two bands (Figure 1 – 3; Table A.1).
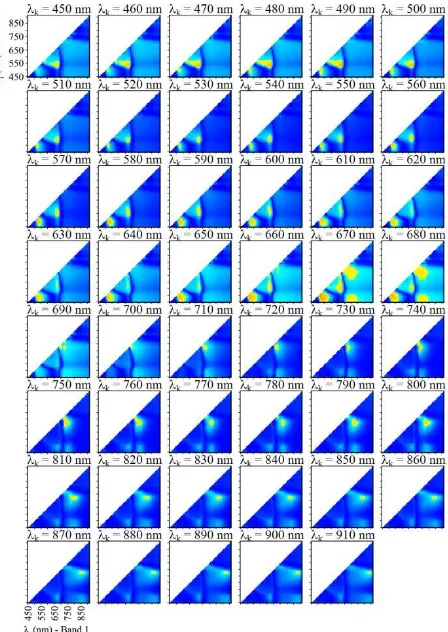
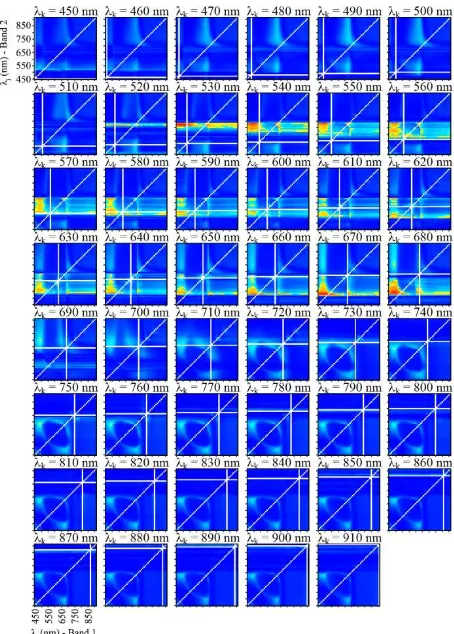
Although ratio of difference (RDI) and difference of ratio (DRI) indices achieved their best performance based on similar spectral bands, i.e., contrast between bands near 490, 530 and 670 nm, RDI would be a better option for discrimination of treatments based on spectral data acquired at canopy level.
Figure 4. B-dist. for combinations of bands using DRI (same legend as Figure 1).
These results indicate that not only wavelengths related to chlorophyll content, at leaf or canopy level, may be important to late blight assessment, but also wavelengths in regions affected by other leaf pigments, like carotenoids. In fact, other authors identified spectral bands in the red and green regions as candidates to improved discrimination between healthy and diseased plants, at leaf level (Ashourloo et al., 2014; Mahlein et al., 2013). However, the dataset analysed here concerns only one acquisition date and spectral data at the plot level corresponded to all spectral signatures acquired, including areas The International Archives of the Photogrammetry, Remote Sensing and Spatial Information Sciences, Volume XLII-2/W6, 2017
International Conference on Unmanned Aerial Vehicles in Geomatics, 4–7 September 2017, Bonn, Germany
This contribution has been peer-reviewed.
with considerable mix of vegetation with soil, in particular for plots of the mixed system, in which relatively advanced stage of late blight development was observed (i.e., between 25 and 75% of leaf area dead per plot). These conditions may limit the results presented in the sense that they may be too specific to this dataset. Despite that, results obtained indicate that spectral information acquired at canopy level can provide information potentially useful for late blight assessment. Also, identification of suitable spectral regions to discriminate diseased from healthy plants can apparently improve the performance of monitoring approaches. In this case, the acquisition of data over time can add complexity to the dataset analysed (e.g., changes in illumination conditions, variable canopy closure causing different degrees of background effects, etc.). These factors need to be take into account for assessment of disease incidence and severity, in particular if early stages of infestation need to be identified.
As future research needs, conventional indices and n-band optimization approaches have to be compared with more complex solutions, focusing on their application for monitoring disease development over time.
Figure 5. B-dist. for combinations of bands using RDI (same legend as Figure 1).
ACKNOWLEDGEMENTS
This work was partially funded through a scholarship to the first author conceded by CAPES — Brazilian Federal Agency for Support and Evaluation of Graduate Education (Project No. 13647-13-0) within the Ministry of Education of Brazil.
REFERENCES
Ashourloo, D., Mobasheri, M., Huete, A., 2014. Evaluating the Effect of Different Wheat Rust Disease Symptoms on
Vegetation Indices Using Hyperspectral Measurements. Remote Sensing 6, 5107–5123. doi:10.3390/rs6065107
Behmann, J., Steinrücken, J., Plümer, L., 2014. Detection of early plant stress responses in hyperspectral images. ISPRS Journal of Photogrammetry and Remote Sensing 93, 98–111. doi:10.1016/j.isprsjprs.2014.03.016
European and Mediterranean Plant Protection Organization, 2008. Phytophthora infestans on potato. EPPO Bulletin 38, 268–271. doi:10.1111/j.1365-2338.2008.01224.x
Franceschini, M.H.D., Bartholomeus, H., van Apeldoorn, D., Suomalainen, J., Kooistra, L., 2017. Intercomparison of Unmanned Aerial Vehicle and Ground-Based Narrow Band Spectrometers Applied to Crop Trait Monitoring in Organic Potato Production. Sensors 17, 1428. doi:10.3390/s17061428
Kim, D.M., Zhang, H., Zhou, H., Du, T., Wu, Q., Mockler, T.C., Berezin, M.Y., 2015. Highly sensitive image-derived indices of water-stressed plants using hyperspectral imaging in SWIR and histogram analysis. Scientific Reports 5, 15919. doi:10.1038/srep15919
le Maire, G., François, C., Dufrêne, E., 2004. Towards universal broad leaf chlorophyll indices using PROSPECT simulated database and hyperspectral reflectance measurements. Remote
Sensing of Environment 89, 1–28.
doi:10.1016/j.rse.2003.09.004
Mahlein, A.-K., Rumpf, T., Welke, P., Dehne, H.-W., Plümer, L., Steiner, U., Oerke, E.-C., 2013. Development of spectral indices for detecting and identifying plant diseases. Remote
Sensing of Environment 128, 21–30.
doi:10.1016/j.rse.2012.09.019
Suomalainen, J., Anders, N., Iqbal, S., Roerink, G., Franke, J., Wenting, P., Hünniger, D., Bartholomeus, H., Becker, R., Kooistra, L., 2014. A Lightweight Hyperspectral Mapping System and Photogrammetric Processing Chain for Unmanned Aerial Vehicles. Remote Sensing 6, 11013–11030. doi:10.3390/rs61111013
Verrelst, J., Rivera, J.P., Veroustraete, F., Muñoz-Marí, J., Clevers, J.G.P.W., Camps-Valls, G., Moreno, J., 2015. Experimental Sentinel-2 LAI estimation using parametric, non-parametric and physical retrieval methods – A comparison. ISPRS Journal of Photogrammetry and Remote Sensing 108, 260–272. doi:10.1016/j.isprsjprs.2015.04.013
Yu, K., Lenz-Wiedemann, V., Chen, X., Bareth, G., 2014. Estimating leaf chlorophyll of barley at different growth stages using spectral indices to reduce soil background and canopy structure effects. ISPRS Journal of Photogrammetry and Remote Sensing 97, 58–77. doi:10.1016/j.isprsjprs.2014.08.005 The International Archives of the Photogrammetry, Remote Sensing and Spatial Information Sciences, Volume XLII-2/W6, 2017
International Conference on Unmanned Aerial Vehicles in Geomatics, 4–7 September 2017, Bonn, Germany
This contribution has been peer-reviewed.
APPENDIX
B-dist. λi (nm) Band1
λj (nm) Band 2
λk (nm) Band 3 DI = Ri-Rj
0.284 730 720 -
0.275 730 710 -
0.275 740 720 -
0.271 670 530 -
0.270 740 710 -
RI = Ri Rj
0.300 670 550 -
0.300 670 540 -
0.297 670 560 -
0.294 670 530 -
0.292 670 570 -
NDI = Ri-Rj Ri+ Rj
0.293 670 550 -
0.292 670 540 -
0.290 670 560 -
0.286 670 570 -
0.286 520 500 -
DRI = Ri-Rj Rk
0.348 520 490 670
0.346 520 500 670
0.339 520 510 670
0.337 520 480 670
0.335 530 490 670
RDI = Ri-Rj Rk-Rj
0.489 490 530 670
0.489 490 670 530
0.488 480 670 530
0.488 480 530 670
0.486 500 530 670
Table A.1. Best five wavelengths combinations for each vegetation index formulation
The International Archives of the Photogrammetry, Remote Sensing and Spatial Information Sciences, Volume XLII-2/W6, 2017 International Conference on Unmanned Aerial Vehicles in Geomatics, 4–7 September 2017, Bonn, Germany
This contribution has been peer-reviewed.