THE DETECTION OF TRANSPORT LAND-USE DATA USING CROWDSOURCING
TAXI TRAJECTORY
T. Ai a*,W. Yang b
a School of Resource and Environmental Sciences, Wuhan University, Wuhan 430079, China – [email protected] b School of Resource and Environmental Sciences, Wuhan University, Wuhan 430079, China - [email protected]
Commission VIII /8
KEY WORDS: Crowdsourcing, Movement Trajectory, Land-use Data Update, Delaunay Triangulations
ABSTRACT:
This study tries to explore the question of transport land-use change detection by large volume of vehicle trajectory data, presenting a method based on Deluanay triangulation. The whole method includes three steps. The first one is to pre-process the vehicle trajectory data including the point anomaly removing and the conversion of trajectory point to track line. Secondly, construct Deluanay triangulation within the vehicle trajectory line to detect neighborhood relation. Considering the case that some of the trajectory segments are too long, we use a interpolation measure to add more points for the improved triangulation. Thirdly, extract the transport road by cutting short triangle edge and organizing the polygon topology. We have conducted the experiment of transport land-use change discovery using the data of taxi track in Beijing City. We extract not only the transport land-use area but also the semantic information such as the transformation speed, the traffic jam distribution, the main vehicle movement direction and others. Compared with the existed transport network data, such as OpenStreet Map, our method is proved to be quick and accurate.
.
1. INTRODUCTION
Transport land-use is the construction result of human movement activity and plays an important role in the land resource management and geographic information service. It is an interesting question to obtain and detect the change information of transport land use and land cover in transport GIS technology and land-use management. However, the traditional methods such as remote sensing monitoring, cross-scale map overlapping or field surveying are cost-intensive in time and other costs. Driven by the rapid development and popularization of positioning strategies (such as GNSS, etc.), the mobile technology has generated large volume of vehicle trajectory data and collected as VGI data base. From the perspective of human activities, the movement trajectory data reveals the spatial interaction between human and land-use. In some degree the land cover land land-use change (LULUC) is the embodiment of human behavior. So the transport land-use has a high association relationship with the movement trajectory data which is open, real time and with large volume uploaded by VGI users. In the era of Big Data, it is possible to detect and update the land-use and land-cover change using the crowdsourcing movement trajectory. This study tries to explore the question of transport land-use change detection by large volume of vehicle trajectory data, presenting a method based on Deluanay triangulation
2. RELATE WORK
Web 2.0 technologies have created a tremendous amount of user generated content, whereas volunteered geographic information (VGI) is part of the content (Goodchild 2007). Up until recently, citizens science projects, public participatory GIS projects (Carver 2001; Rambaldi et al. 2004), collaborative mapping projects (Rouse et al. 2007), and crowdsourcing geo-data (Heipke 2010) have been the main sources of VGI. Also a large number
* Corresponding author
of mapping projects and services have been launched since them and it is necessary to give a brief overview of them.
Openstreetmap (www.openstreetmap.org) is a popular VGI project where users collaboratively collect topographic data and POIs and build a spatial database for the world for free. OSM data have been further implemented in a variety of applications such as routing (www.Openrouteservice.org), 3D modelling (www.OSM-3d.org), disaster management (Yates and Paquette 2011), and land use mapping (Jokar Arsanjani et al. 2013). OSM has also been extended to include the mapping of the maritime— via OpenSeaMap (http://map.openseamap.org). Besides, VGI visualization has been applied for social media mapping (Roick and Heuser 2013), environmental and ecological monitoring (Fritz et al. 2012), crisis and disaster mapping (Zook et al. 2010; Yates and Paquette 2011), crime mapping, business mapping, etc.
In recent years many researchers have analyzed VGI data such as GPS-traces of pedestrian and drivers, which in principle can be considered as individual realizations of roads or footpaths. Useful information can be extracted from such individual data, such as road geometries, intersections, lanes, road width, travelling speed, etc. For example, Schroedl et al. (2004) describe a method that detects clusters in specific road segments, corresponding to the typical width of lanes. Cao and Krumm (2009) propose a force-based approach that detects individual road on opposite side of dual carriageways. Chen and Krumm (2010) use a Gaussian mixture model (GMM) to model the distribution of GPS traces across multiple lanes. Spatial trajectories are usually the subject of data mining to find travelling behavior of travelers (Dodge et al. 2008). To protect individual privacy however, generalization can be used to remove individual information from the trajectories (i.e. data anonymization) (Nergiz et al. 2009; Monreale et al. 2010). In terms of segmenting trajectories for augmenting the semantic aspects of the data, Biljecki et al 2013 The International Archives of the Photogrammetry, Remote Sensing and Spatial Information Sciences, Volume XLI-B8, 2016
XXIII ISPRS Congress, 12–19 July 2016, Prague, Czech Republic
This contribution has been peer-reviewed.
presented an important contribution that segments and classifies trajectories based on the transportation modes.
3. METHOD
The idea of our proposed method is as follows. Our method firstly preprocesses the raw trajectory data including the anomaly point removing and the conversion of trajectory point to track line. Secondly, construct Deluanay triangulation within the vehicle trajectory line to detect neighborhood relation. Thirdly, extract the transport road by cutting short triangle edge and organizing the polygon topology.
3.1 Trajectory data pre-processing
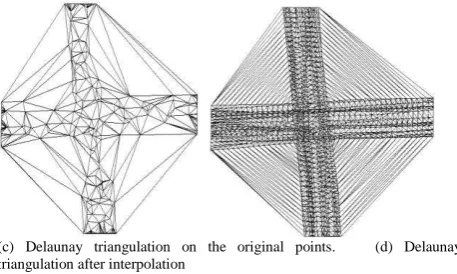
There are much noise data make difficult to extract transport land-use data due to the data sparse sampling, GPS drift and building block. Trajectory data cleaning including the anomaly point removing (such as time record error ) and deleting the track line with big turn angles. As to destroy the nearest neighbor feature of Delaunay triangulation through construct Delaunay triangulation within track line with sparse sampling, it is difficult to characterize the spatial distribution patterns of trace data and identify the road boundary. Considering this problem, we use a interpolation measure to add more points for the improved triangulation as shown in Fig. 1.The method of interpolation is to set a threshold value of step length of interpolation. When the distance between the adjacent two trace points on the trajectory line is larger than the threshold value, the track line interpolated, while not interpolated. At last, construct Delaunay triangulation using interpolated track line.
(a)Original Trajectory points (b) Interpolation of long trajectory segment
(c) Delaunay triangulation on the original points. (d) Delaunay triangulation after interpolation
Figure 1. Delaunay triangulation on the trajectory points
3.2 Road polygon extraction using Delaunay triangulation
From the Delaunay triangulation constructed using track line can be seen there are many triangles with smaller area and shorter
edge on the road area which trace line clustering, while triangles with lager area and longer edge distributed in non-road area. Therefore, the edges of triangle can be divided into two types: one is long edge which is distributed in non-road area, one is short edge which is distributed in road area. Transport land-use parcel can be extracted by deleting long edge in Delaunay triangulation. The deleting threshold value is calculated by the formula as
where Global_Mean(DT)= the average length of edges in DT. Global_Variation(DT)=the standard deviation of the density. For each point Pi in Delaunay triangulation DT, an edge ej ,which directly connects to Pi, if the length of ej is longer than or equal to Global_CutValue, ej will be removed from DT.Transport land-use parcel can be extracted through removing edge in DT as shown in figure2.
(a)Delaunay triangulation constructed by trajectory line b Road polygon extraction
Figure 2. Transport land-use extraction using Delaunay triangulation.
3.3 Road center line extraction data using Delaunay triangulations
Construct Delaunay triangulation within road polygon to extracted road center line. Triangle can be divided into 4 types according to the adjacency relationship between the triangle and road polygon. The zeroth type of triangle is located outside the road polygon which has little significance for the extraction of the road center line. First kinds of triangles have only 1 adjacent triangles, The second kind of triangle has two adjacent triangles, and the third kind of triangle has 3 adjacent triangles. So, the road center line is extracted using the algorithm as proposed in reference[Ai, 2000] as shown in Figure3.
The International Archives of the Photogrammetry, Remote Sensing and Spatial Information Sciences, Volume XLI-B8, 2016 XXIII ISPRS Congress, 12–19 July 2016, Prague, Czech Republic
This contribution has been peer-reviewed.
Figure 3. Center line extraction using Delaunay triangulation.
4. DATA AND EXPERIMENT
4.1 Trajectory Data
Taxi GPS trajectory of Beijing city in February 3rd
,2008 ,from
the Microsoft Research Institute Zheng Yu team TDriver.Taxi trajectory data including vehicle identification ,time,location information.There are 305510 trajectory points and 124506 track lines.The experiment data and study area as shown in Figure3.
Figure 4. Study area and trajectory lines
4.2 Experiment result analysis
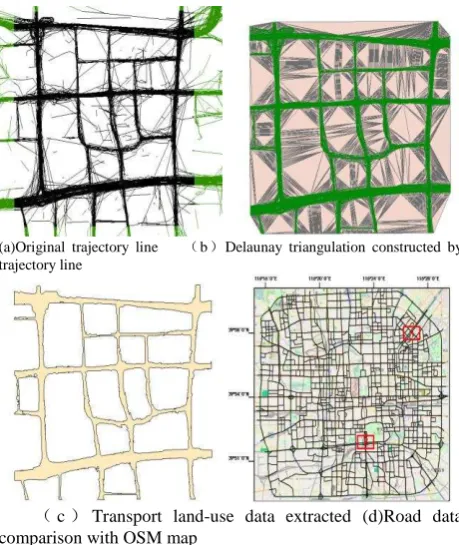
Construct Delaunay triangulation within pre-processing track lines,and removing long edge according to Global_Cutvalue to extract road polygon as shown in Figure 5.We extract not only the transport land-use area but also the semantic information such
as the transformation speed, the traffic jam distribution, the main vehicle movement direction and others. Compared with the existed transport network data, such as OpenStreet Map, our method is proved to be quick and accurate.
(a)Original trajectory line b Delaunay triangulation constructed by trajectory line
c Transport land-use data extracted (d)Road data comparison with OSM map
Figure 5. The experiment of transport land-use generation using vehicle movement trajectory.
5. CONCLUSIONS
Transport land-use is the construction result of human movement activity and plays an important role in the land resource management and geographic information service. It is an interesting question to obtain and detect the change information of transport land use and land cover in transport GIS technology and land-use management. In the era of big data, the uploaded VGI data, such as trajectory, can be used to detect the land-use update. This study explores the question of transport land-use change detection by large volume of vehicle trajectory data, presenting a method based on Deluanay triangulation. The whole method includes three steps, not only extracting the transport land-use area but also the semantic information such as the transformation speed, the traffic jam distribution, the main vehicle movement direction and others. Compared with the existed transport network data, such as OpenStreet Map, our method is proved to be quick and accurate.
.
ACKNOWLEDGEMENTS
The work described in this article was supported by research grants from the National Natural Science Foundation of China [grant number 41531180], and the Open Fund of Key Laboratory of Urban Land Resources Monitoring and Simulation, Ministry of Land and Resources [grant number KF-2015-01-038].. The International Archives of the Photogrammetry, Remote Sensing and Spatial Information Sciences, Volume XLI-B8, 2016
XXIII ISPRS Congress, 12–19 July 2016, Prague, Czech Republic
This contribution has been peer-reviewed.
REFERENCES
Ai Tinghua, Guo Renzhong. A Constrained Delaunay Partition of Areal Objects to Support Map Generalization [J]. Journal of Wuhan Technical University of Surveying and Mapping,2000, 25(1): 35-41.
Anmed M, Karagiorgou S, et al. A comparison and evaluation of map construction algorithms using vehicle tracking data[J]. GeoInformatica, 2015, 19(3): 601-632.
Estivill-castro V, Lee I. Multi-level clustering and its visualization for exploratory spatial analysis[J]. GeoInformatica, 2002, 6(2): 123-152.
Goodchild M F. Citizens as sensors: the world of volunteered geography[J]. GeoJournal, 2007, 69(4): 211-221.
HAUNTER J H, SESTER M. Area collapse and road centerlines based on straight skeletons[J]. GeoInformatica, 2008, 12(2): 169-191.
JIANG B. Street hierarchies: a minority of streets account for a majority of traffic flow[J]. International Journal of Geographical Information Science, 2009, 23(8): 1033-1048.
KUNTZSCH C, SESTER M, Brenner C. Generative models for road network reconstruction[J]. International Journal of Geographical Information Science, 2015: 1-28.
Li J, Qin Q, Xie C, et al. Integrated use of spatial and semantic relationships for extracting road networks from floating car data[J]. International Journal of Applied Earth Observation and Geoinformation, 2012, 19: 238-247.
Liu Q, Tang J, Deng M, et al. An Iterative Detection and Removal Method for Detecting Spatial Clusters of Different Densities[J]. Transactions in GIS, 2015, 19(1): 82-106.
LIU X, ZHU Y, WANG Y, et al. Road recognition using coarse-grained vehicular traces[J]. HP Labs, HP Labs2012, 2012.
WANG Y, LIU X, WEI H, et al. CrowdAtlas: self-updating maps for cloud and personal use[C]//Proceeding of the 11th annual international conference on Mobile systems, applications, and services. ACM, 2013: 27-40.
ZHENG Y, LI Q, CHEN Y, et al. Understanding mobility based on GPS data[C]//Proceedings of the 10th international conference on Ubiquitous computing. ACM, 2008: 312-321.
The International Archives of the Photogrammetry, Remote Sensing and Spatial Information Sciences, Volume XLI-B8, 2016 XXIII ISPRS Congress, 12–19 July 2016, Prague, Czech Republic
This contribution has been peer-reviewed.