c
2005 Springer Science + Business Media, Inc. Manufactured in The Netherlands.
Discovering Credit Cardholders’ Behavior by Multiple
Criteria Linear Programming
GANG KOU YI PENG
College of Information Science and Technology, University of Nebraska at Omaha, Omaha, NE 68182, USA
YONG SHI∗ [email protected]; [email protected]
College of Information Science and Technology, University of Nebraska at Omaha, Omaha, NE 68182, USA; Graduate School of Chinese Academy of Sciences, Beijing 100039, China
MORGAN WISE
First National Bank of Omaha, 1620 Dodge Street Stop 3103, Omaha, NE 68197, USA
WEIXUAN XU
Institute of Policy and Management, Chinese Academy of Sciences, Beijing, 100080, China
Abstract. In credit card portfolio management, predicting the cardholder’s spending behavior is a key to reduce the risk of bankruptcy. Given a set of attributes for major aspects of credit cardholders and predefined classes for spending behaviors, this paper proposes a classification model by using multiple criteria linear programming to discover behavior patterns of credit cardholders. It shows a general classification model that can theoretically handle any class-size. Then, it focuses on a typical case where the cardholders’ behaviors are predefined as four classes. A dataset from a major US bank is used to demonstrate the applicability of the proposed method.
Keywords:data mining, classification, multi-criteria linear programming, credit cardholders’ behavior, SAS algorithms
1. Introduction
The history of credit card can be traced back to 1951 when the Diners’ Club issued the first credit card in the US to 200 customers who could use it at 27 restaurants in New York (http://www.didyouknow.cd/creditcards.htm). At the end of fiscal 1999, there are 1.3 billion payment cards in circulation and Americans made $1.1 trillion credit pur-chases (http://www.nodebt.org/debt.htm). These statistics show that credit card business becomes a major power to stimulate the US economy growth in the last fifty years. How-ever, the increasing credit card delinquencies and personal bankruptcy rates are causing plenty of headaches for banks and other creditors. The increase in personal bankruptcy
rates was substantial. From 1980 to 2000, the number of individual bankruptcy filings in the US increased approximately 500% (Stavins, 2000). How to predict bankruptcy in advance and avoid huge charge-off losses becomes a critical issue of credit card issuers.
Since a credit card database can contain hundreds and thousands of credit trans-actions, it is impossible to discover or predict the cardholders’ behaviors without using mathematical tools. In fact, the practitioners have tried a number of quantitative tech-niques to conduct the credit card portfolio management. Some examples of known ap-proaches are (1) Behavior Score developed by Fair Isaac Corporation (FICO) (www. fairisaac.com); (2) Credit Bureau Score also developed by FICO (www.fairisaac.com); (3) First Data Resource (FDR)’s Proprietary Bankruptcy Score (http://www.firstdatacorp. com); (4) Multiple-criteria Score (Shi, 2001, 2002) and (5) Dual-model Score (Lin, 2002). A basic characteristic of these models is that they first consider the behaviors of the cardholders as two predefined classes: bankrupt accounts and non-bankrupt accounts according to their historical records. Then they use statistical methods, linear program-ming or neural networks to compute the Kolmogorov-Smirnov (KS) value that measures the largest separation of these two cumulative distributions of bankrupt accounts and non-bankrupt accounts in a training set (Conover, 1999). The resulting KS values from the learning process are applied to the real-life credit data warehouse to predict the per-centage of bankrupt accounts in the future. Thus, these methods can be generally regarded as two-class models in credit card portfolio management.
In order to discover more knowledge for advanced credit card portfolio manage-ment, multi-class (class number is larger than two) data mining methods are needed. Comparing with two-class model, the multi-class model enlarges the difference between bankrupt accounts and non-bankrupt accounts. This enlargement increases not only the accuracy of separation, but also provides more useful information for credit card issuers or banks. From theoretical point of view, a general multi-class model is easy to construct. From practical point of view, the best control parameters (such as class boundaries) have to be identified through a learning process on a training data set. Therefore, finding the practical technology with certain type of multi-class model is not a trivial task. Peng (2002) and Shi (2002) have explored a three-class classification model. This model pro-duces the prediction distribution for each behavior class so that credit card issuers can establish their credit limit policies for various cardholders.
This paper proceeds as follows. Section 2 proposes a general multi-class model for credit card portfolio management. Section 3 reviews the previous results of two-class and three-class models. Section 4 develops a four-class model to capture charge-off behavior of cardholders and provides an algorithm to implement the model. Section 5 reports results of the empirical study for the four-class model on a real-life credit data warehouse from a major US bank. Section 6 concludes the paper with further research directions.
2. General model
Data mining for credit card portfolio management decisions is to classify the different cardholders’ behavior in terms of their payment to the credit card companies, such as banks and mortgage loan firms. In realty, while all credit card companies share some common variables, some credit card companies have different variables to describe the cardholders’ behavior. The examples of common categories of the variables are balance, purchase, payment and cash advance. Some credit card companies may consider res-idence state category and job security as special variables. In the case of FDR, there are 38 original variables (or attributes) from the common variables over the past seven months. Then, a set of 80 derived variables is internally generated from the 38 variables to perform a precise data mining task.
A general multi-class model by using multiple criteria linear programming can be proposed as:
Given a set ofr variables about the credit cardholders’ behaviora =(a1, . . . ,ar), let Ai =(Ai1, . . . ,Air) be a development sample of credit data for the variables, where
i=1, . . . ,n and n is the sample size. We want to determine the coefficients of the variables, denoted byX=(x1, . . . ,xr). If a given problem can be predefined assdifferent
classes, then the boundary between thejth andj+1th groups can bebj, j =1, . . . ,s−1.
The separation of these classes is:
AiX ≤b1,Ai ∈G1; bk−1≤AiX≤bk,Ai ∈Gk,k=2, . . . ,s−1; AiX ≥bs−1,Ai ∈Gs.
Letαij be the overlapping degree with respect of Ai withinGj andGj+1, andβ
j i
be the distance from Ai withinGj andGj+1to its adjusted boundaries. The separation of these classes is modified as:
AiX=b1−α1 i +β
1
i,Ai ∈G1; bk−1+αik−1−β k−1
i = AiX=bk−αik
+βik,Ai ∈Gk,k=2, . . . ,s−1; AiX=bs−1+αs−1 i −β
s−1
i ,Ai ∈Gs;
The goal of this general problem is to reach the maximization ofjβ j
i and the
(M1) Minimize ijαij and Maximizeijβij
The background of the above model is based on both linear discriminant analysis and multiple criteria linear programming. In linear discriminant analysis, the misclassification of data separation can be described by two opposite objectives in a linear system. The first one is to maximize the minimum distances (MMD) of observations from the critical value. The second objective separates the observations by minimizing the sum of the deviations (MSD) among the observations (Freed, 1981, 1986; Koehler, 1990). Comparing with the traditional mathematical tools in Classification, such as decision tree, statistics and neural networks, this approach is simple and direct, free of the statistical assumptions, and flexible by allowing decision makers to play an active part in the analysis (Joachimsthaler, 1988). However, because linear discriminant analysis uses only MMD, MSD, or a given combination of MMD and MSD to measure the misclassification, it could not find the best tradeoff of two measurements. This shortcoming has been coped with by the techniques of multiple criteria linear programming (MCLP) (Shi, 2002). Using MCLP, we can optimize MMD and MSD simultaneously to identify the best tradeoff of MMD and MSD. The resulting classification produces better data separation than linear discriminant analysis. Theoretically speaking, the general model can classify data into any class-size of data (s ≥2). But, the practical model for two, three, four or more classes of data has to be built individually since each model involves different control parameters. In addition, in the case of credit card portfolio management, classifying credit cardholders’ behaviors into fewer than five categories is manageable and encouraged. This belief is not only based on business practice, but also comes from George Miller’s classic article: “The Magical Number Seven, Plus or Minus Two” (Miller, 1956). Miller pointed out that human capacity for processing information is limited to the magic number seven, plus or minus two which fits the credit card portfolio situation correctly. In the following section, we review the preliminary research findings on two and three-class models.
3. Two class models
Two-class model based on multiple criteria linear programming is initiated as Shi (2001): Given a set ofr variables (attributes)a =(a1, . . . ,ar), let Ai =(Ai1, . . . ,Air) be
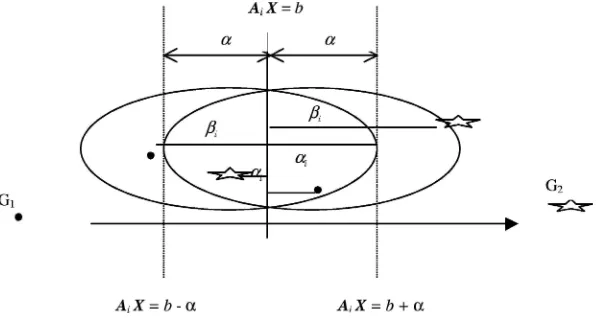
and a boundary valueb to separate two classes:G1 (bankrupt accounts) andG2 (non-bankrupt accounts); that is,
AiX ≤b,Ai ∈G1 and AiX≥b,Ai ∈G2.
To measure the separation ofG1and G2, we define:
αi = the overlapping of two-group (classes) boundary for case Ai (external
measure-ment);
βi =the distance of case Ai from its adjusted boundary (internal measurement);
According to the general model (M1), we want to minimize the sum of αi and
maximize the sum ofβi simultaneously (M2) as:
(M2)
Minimizeiαi and Maximizeiβi
Subject to:
AiX=b+αi −βi, Ai ∈G1, AiX=b−αi +βi, Ai ∈G2,
where Ai are given, Xandbare unrestricted, andαi andβi ≥0.
To facilitate the computation on the large-size of data warehouse, the compromise solution approach (Shi, 2001, 2001b) has been employed to reform the above model (M2) so that a commercial software package, such as SAS LP can be used to systematically identify thebest tradeoffbetween−iαi andiβi for an optimal solution. To explain
this, we assume the “ideal value” of−iαi beα∗ > 0 and the “ideal value” of iβi
beβ∗ >0. Then, if−
Remark 1. We see that by using the compromise approach, the bi-criteria problem (M2) is transformed to a single criterion problem (M3). The optimal solution of (M3) is that of (M2), but not vice versa. Therefore, (M3) is a reduced problem of (M2). However, model (M3) allows us to utilize SAS LP for computing a large-scale of credit card databases. Although the pair of regret measuresd−
α anddα+is stated in (M3), only one of two will
have a non-zero value in reality. This is also true fordβ−anddβ+. The two-class model is known as “Good vs. Bad” in credit card portfolio management. The purpose of using this model is to produce a “black list” of Bads. The empirical study of this model based on real-life credit database from a major US Bank is reported by Shi (2001).
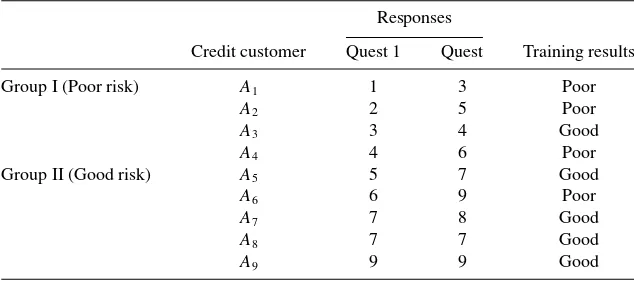
Example 1. As an illustration, a simple example is used to verify the feasibility of the
model. The example, which was transformed from Freed (1981)’s first article of applying linear programming on discriminant problems, is about assigning credit applicants to different risk groups. An applicant is to be classified as a “poor”, or “good” credit risk based on his/her responses to two questions appearing on a standard credit application. Table 1 shows previous experience with 9 customers.
According to the previously formulated model (Model 3), this classification problem can be recast as an MCLP problem:
Table 1
Small example of credit applicants risk classification. Responses
Credit customer Quest 1 Quest Training results
Group I (Poor risk) A1 1 3 Poor
A2 2 5 Poor
A3 3 4 Good
A4 4 6 Poor
Group II (Good risk) A5 5 7 Good
A6 6 9 Poor
A7 7 8 Good
A8 7 7 Good
A9 9 9 Good
3x1+4x2=b+α3−β3 4x1+6x2=b+α4−β4 5x1+7x2=b−α5+β5 6x1+9x2=b−α6+β6 7x1+8x2=b−α7+β7 7x1+7x2=b−α8+β8 9x1+9x2=b−α9+β9
where α∗ = 0.1, β∗ = 30000 and b = 1 are given, x1 and x2 are unrestricted, and
αi, βi,dα−,dα+,d − β,d
+
β ≥0,i =1, . . . ,9.
The results, coefficients values of
X = x
1
x2
=
3103.35632184
−2068.79310345
,
are applied to 9 customers to produce optimal solution of linear programming for this classifier and are obtained as Column 4 of Table 1, where only cases A3 and A6 we
misclassified.
4. Four-class model formulation
In the four-class separation, we use term: “charge-off” to predict the cardholders’ behaviors. According to this idea, four classes are defined as: Bankrupt charge-off ac-counts, Non-bankrupt charge-off acac-counts, Delinquent acac-counts, and Current accounts. Bankrupt charge-off accounts are accounts that have been written off by credit card is-suers because of cardholders’ bankrupt claims. Non-bankrupt charge-off accounts are ac-counts that have been written off by credit card issuers due to reasons other than bankrupt claims. The charge-off policy may vary among authorized institutions. Normally, an ac-count will be written off when the receivable has been overdue for more than 180 days or when the ultimate repayment of the receivable is unlikely (e.g., the cardholder can-not be located) (http://www.info.gov.hk/hkma/eng/press/2001/20010227e6.htm). Delin-quent accounts are accounts that have not paid the minimum balances for more than 90 days. Current accounts are accounts that have paid the minimum balances or have no balances.
This separation is more precise than two-class and three-class models in credit card portfolio management. For instance, bankrupt charge-off and non-bankrupt charge-off accounts are probably both classified as “Bad” accounts in two or three-group separations. This model, however, will call for different handling against these accounts.
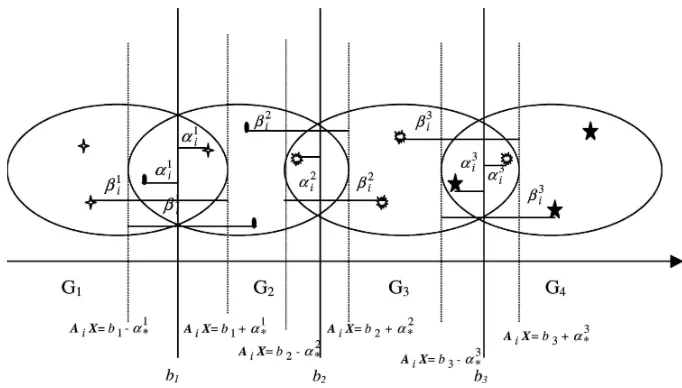
From the general model (M1), a four-class model has three boundaries,b1,b2, and
b3, to separate four classes (figure 2). Each class is represented by a symbol as follows:
stands forG1(Bankrupt charge-off account), stands forG2(Non-bankrupt charge-off account), stands forG3(Delinquent account), and
stands forG4(Current account).
Given a set of r variables about the cardholders A = (A1, . . . ,Ai), let At =
(Ai1, . . . ,Air) be the development sample of data for the variables, wherei =1, . . . ,n andn is the sample size. We try to determine the coefficients of the variables, denoted by X=(x1, . . . ,xr), boundaryb1to separateG1fromG2,G3, andG4, boundaryb3to
Similar to two-class and three-class models, we apply two measurements for better separations. Letα1i be the overlapping degree with respect of AiwithinG1and G2, α2
i be
the overlapping degree with respect of Ai withinG2andG3, andα3
i be the overlapping
degree with respect of Ai, withinG3 andG4. Letβ1
i be the distance from Ai within G1 and G2 to its adjusted boundaries (AiX = b1−α1∗, and AiX = b1+α1∗), βi2 be
of four groups by enforcingb1lower thanb2, andb2 lower thanb3. Then we apply the compromise solution approach (Shi, 1989, 2001) to reform the model. We assume the ideal value of−iαi1 beα1∗ > 0,−iαi2 beα∗2 > 0,−iαi3beα∗3 >0, and the ideal
Then, the four-group model (M4) is transformed as:
A SAS-based algorithm of this four-class model is proposed as follows:
Algorithm 1.
Step 1. UseReadCHD.sasto convert both the training and verifying data into SAS data sets.
Step 2. UseGroupDef.sasto divide the observations within the training data sets into four groups:G1,G2,G3, andG4.
Step 3. Use4GModel.sas to perform the separation task on the training data. Here, PROC LP in SAS is called to calculate the (M5) model for the best solution of the four-class separation given the values of control parameters (α∗1, β∗1, α∗2, β∗2, α∗3, β∗3,b1,b2,
b3).
Step 4. UseScore.sasto produce the graphical representations of the training results. Step 3–4 will not terminate until the best training result is found.
Step 5. UsePredict, sasto mine the four classes from the verifying data set.
5. Empirical study and managerial significance of four-class models
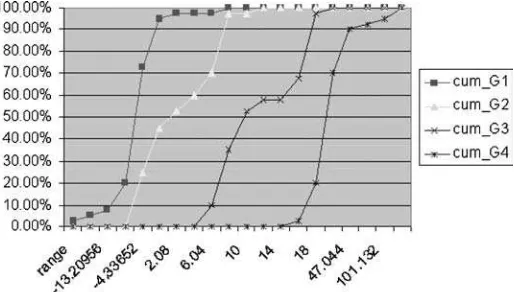
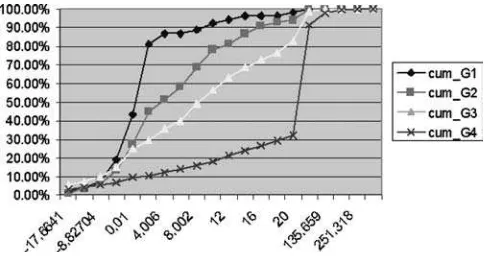
Figure 3. Four-class training data set (160) (X-axis is the score of each data andY-axis is the percents that group is successfully classified).
set with 5,000 accounts is then applied. Four groups are defined as: Bankrupt charge-off accounts (The number of over-limits≥13), Non-bankrupt charge-off accounts (7≤The number of over-limits≤12), Delinquent accounts (2≤The number of over-limits≤6), and Current accounts(0≤The number of over-limits≤2).
After several learning trials for different sets of boundary values, we found the values:b1 = 0.05,b2 = 0.8,b3 = 1.95 (without changingα∗1, α∗2, α∗3, β∗1, β∗2, andβ∗3)
brought the best separation as shown in figure 3, in which “cum Gl” refers to cumula-tive percentage ofG1 (Bankrupt charge-off accounts); “cum G2” refers to cumulative percentage ofG2(Non-bankrupt charge-off accounts); “cum G3” refers to cumulative percentage ofG3(Delinquent accounts); and “cum G4” refers to cumulative percentage of G4(Current accounts).
This Training set has total 160 samples. Gl has been correctly identified for 90% (36/40), G2 90% (36/40), G3 85% (34/40) and G4 97.5% (39/40). In addition to these absolute classifications criteria, the KS Score is calculated by KS value= max|Cum. distribution of Good - Cum. distribution of Badl.
The KS values are 50 for Gl vs. G2, 62.5 for G2 vs. G3 and 77.5 for G3 vs. G4. We observe some relationships between boundary values and separation: (1) Op-timal solution and better separation can be achieved by changing the value ofbj, α
j
∗
andβ∗j. (2) Once a feasible area is found, the classification result will be similar for
Figure 4. Four-class verifying data set.
In multi-group classification, a better result will be achieved in the separation between certain two groups. According to the definition of group and data attributes, the best KS score usually appears in the separation between the first group and second group or the separation between the last group and other groups. In the model, the last group is defined as individuals with perfect credit performance and other groups are defined as individuals who have some stains in their credit histories. As a result, the separations indicated that the distance between the last group (Good) and other groups is larger and a better KS score for that separation. It means that in practice it is easier to catch good ones or bad ones, but it is much more difficult to discriminant different levels of credit performance in between.
6. Concluding remarks
We have proposed a four-class model by using multiple criteria linear programming to discover the various behaviors of credit cardholders. In credit card portfolio management, predicting the cardholder’s spending behavior is a key to reduce the risk of bankruptcy. Given a set of predicting variables (attributes) that describes all possible aspects of credit card holders, we have first built a general classification model that can theoretically handle any size of multiple-class cardholders’ behavior problems. Then, we have focused on a special case where the cardholders’ behaviors are predefined into four classes: (i) bankrupt charge-off; (ii) non-bankrupt charge-off; (iii) delinquent; and (iv) current. The algorithm of the four-group classification is developed and implemented by SAS. In this paper, a data set of 5000 card account samples from 25,000 credit card records in the data warehouse of a major US bank was used to test the control parameters of the model for the best class separation.
multiple criteria linear programming classification in data mining, we may produce Linux codes by C++so that we can utilize IBM or other computing platforms for any available credit data warehouses. These problems are currently under investigation. We will report the significant results in the near future.
Finally, we shall note even though the classification models discussed in this paper have been directly applied in discovering the knowledge for credit card portfolio man-agement, they can be readily used in biomedical research, such as pharmaceutical and DNA analyses; in telecommunications and health cares industries for fraud management; and in retail industries for marketing analysis Han (2001) and Shi (2000).
Acknowledgments
This research has been partially supported by a grant under (DUE-9796243), the Na-tional Science Foundation of USA, a NaNa-tional Excellent Youth Fund under (#70028101), National Natural Science Foundation of China and the K.C. Wong Education Foundation (2001 and 2003), Chinese Academy of Sciences.
References
Conover, W.J. (1999).Practical Nonparametric Statistics. Wiley. “Debt Statistics,” http://www.nodebt.org/debt.htm.
“Enhancing human health through better decisions—from discovery through development to commercialization—and beyond”, SAS Institute Inc, http://www.sas.com/industry/pharma/.
Freed, N. and F. Glover. (1981). “Simple but Powerful Goal Programming Models for Discriminant Prob-lems.”European Journal of Operational Research7, 44–60.
Freed, N. and F. Glover. (1986), “Evaluating Alternative Linear Programming Models to Solve the Two-Group Discriminant Problem.”Decision Science17, 151–162.
Han, J. and M. Kamber. (2001).Data Mining: Concepts and Techniques. Morgan Kaufmann Publishers. http://www.firstdatacorp.com
Joachimsthaler, E.A. and A. Stam. (1988). “Four Approaches to the Classification Problems in Discriminant Analysis: An Experimental Study.”Decision Sciences19, 322–333.
Koehler, G.J. and S.S. Erenguc. (1990). “Minimizing Misclassifications in Linear Discriminant Analysis.”
Decision Science21, 63–85.
Lin, Y. (2002). “Improvement on Behavior Scores by Dual-Model Scoring System.”International Journal of Information Technology and Decision Making1, 153–164.
Miller, G.A. (1956). “The Magic Number seven, Plus or Minus Two.” The Psychological Review
63(2).
Peng, Y., Y. Shi, and W. Xu. (2002). “Classification for Three-group of Credit Cardholders’ Behavior Via A Multiple Criteria Approach.”Advanced Modeling and Optimization4, 39–56.
Quinlan, J.R. (1986). “Induction of Decision Tree.”Machine Learning1, 81–106.
Shi, Y. (2000). “Data Mining,” In M. Zeleny (ed),IEBM Handbook of Information Technology in Business. International Thomson Publishing, pp. 490–495.
Shi, Y. (2001b).Multiple Criteria Multiple Constraint-level Linear Programming: Concepts, Techniques and Applications. World Scientific Publishing.
Shi, Y., M. Wise, M. Luo, and Y. Lin. (2001). “Data Mining in Credit card Portfolio Management: A Multiple Criteria Decision Making Approach.” In M. Koksalan and S. Zionts (eds.),Multiple Criteria Decision Making in the New Millennium. Berlin: Springer, pp. 427–436.
Shi, Y. and P.L. Yu (1989). “Goal Setting and Compromise Solutions,” In B. Karpak and S. Zionts (eds.),
Multiple Criteria Decision Making and Risk Analysis Using Microcomputers. Berlin: Springer, pp. 165– 203.
Stavins, J. (2000), “Credit Card Borrowing, Delinquency, and Personal Bankruptcy.”New England Economic Review,July/August 2000, http://www.bos.frb.org/economic/neer/neer2000/neer400b.pdf.
“Survey on the Banking Sector’s Credit Card Receivables,” Hong Kong Monetary Authority, 2000, http://www.info.gov.hk/hkma/eng/press/2001/20010227e6.htm-annex.