A NEW METHOD FOR DETERMINING THE DEFORMATION MONITORABLE
INDICATOR OF POINT CLOUD
W. Xuan a, X. H. Hua a, b,*, W. N. Qiu a, J. G. Zou a, b, X.J. Chen c
a School of Geodesy & Geomatics, Wuhan University, People’s Republic of China – [email protected], (xhhua, wnqiu, jgzou)@sgg.whu.edu.cn
b Collaborative Innovation Center for Geospatial Technology,Wuhan University, People‘s Republic of China c School of Resource and Environment Engineering, Wuhan University of Technology, People‘s Republic of China -
[email protected] Commission VII, WG VII/5
KEY WORDS: Error Ellipsoid, Point Cloud Error Space, Point Error; Deformation Monitorable Indicator
ABSTRACT:
With the continuous development of the terrestrial laser scanning (TLS) technique, the precision of the laser scanning has been improved which makes it possible that TLS could be used for high-precision deformation monitoring. A deformation monitorable indicator (DMI) should be determined to distinguish the deformation from the error of point cloud and plays an important role in the deformation monitoring using TLS. After the DMI determined, a scheme of the deformation monitoring case could be planned to choose a suitable instrument, set up a suitable distance and sampling interval. In this paper, the point error space and the point cloud error space are modelled firstly based on the point error ellipsoid. Secondly, the actual point error is derived by the relationship between the actual point cloud error space and the point error space. Then, the DMI is determined using the actual point error. Finally, two sets of experiments is carried out and the feasibility of the DMI is proved.
* Corresponding author
1. INTRODUCTION
In recent years, terrestrial laser scanning (TLS) has attracted increasing attention from various fields, such as topographic survey (Armesto, 2009), recording of culture heritage (Grussenmeyer, 2011), as-built building survey (Tang, 2010) and deformation monitoring (Golparvar-Fard, 2011), since it started to mature as a surveying methodology. Deformation monitoring using TLS offers an opportunity to rapidly acquire dense 3D point data over an entire deformed object or surface, and the deformation can be computed by comparing the point clouds of the same object or surface at different epochs. So far, some cases about the application of TLS in the deformation monitoring field have been studied, which are broadly focused on two aspects: (1) Point based monitoring. This method is implemented based on setting artificial targets on the monitored points. By scanning the artificial targets, the 3D coordinates of the monitored points are measured, which are used to calculate the point displacement or difference along the three coordinate axes (Gordon, 2007; Zhang, 2008). Then the overall deformation is obtained after analyzing the deformation of the monitored points. (2) Surface based monitoring. This method focuses on the surface monitoring including two aspects. On the one hand, after acquiring dense point cloud of the object, point cloud resampling or reconstruction is performed which results in a 3D surface model. Then the overall deformation is obtained by calculating the difference between models of two epochs (Prokop, 2009; Abellán, 2010; Bonali, 2013). On the other hand, the deformation parameters (including displacement vectors and rotations) are estimated using the global co-registration and local surface matching (Monserrat, 2007). The main advantage of these methods is the easy acquisition of deformation estimated by the difference between epochs. A
limitation of these methods is that the estimated deformation field may be caused by the error of point cloud including point cloud error, registration error, modelling error, and cloud comparison error. Therefore, it is necessary that a deformation monitorable indicator (DMI) should be determined to distinguish the deformation from the error of the point cloud. The DMI, which is calculated through analyzing the accuracy of point cloud, is the threshold of deformation that could be used to assess the capability of point clouds for deformation extraction.
This paper presents a new method to determine the deformation monitorable indicator (DMI) where precursory displacements can be detected. A core of the approach is the computation of the actual volume of point error space. The main contents of the paper are as follow: (1) the establishment of point error space using the error ellipsoid which is calculated using the error standard deviation of the angle and range as well as the influence of the laser spot; (2) the computation of point cloud error space considering the relationship between the neighboring point error spaces; (3) the calculation of the actual point error according to the relationship between the point error space and the point cloud error space; (4) the determination of functional relationship between DMI and point error space. By determining the DMI at any distance and sampling interval before a case of deformation monitoring is carried out, a suitable plan could be draw up including choosing the appropriate instrument, setting up the appropriate scanning range and scanning interval according to the level of the deformation monitoring.
2. ERROR ELLIPSOID AND POINT CLOUD ERROR SPACE
2.1 Establishment of point error space
According to the theory of laser scanning, location of each point is acquired in a polar coordinate system ( , , ) , which is measurements (vertical angle and horizontal angle, respectively).
The variance-covariance matrix CX measurement of X that is caused by laser distance measurement and angle measurement is given by equation (2) according to the law of error propagation.
surface, see equation. (4) ( Soudarissanane, 2011).
arccos v n
v n
(4)
TLS is affected by many error sources, contaminating the laser point cloud with measurement distance, angle and laser spot
errors. The impact of the laser spot on the point cloud accuracy is not considered in standard error analysis. The presence of predicted since it cloud lie anywhere within the spot. Under the hypothesis of that the Gaussian energy distribution within the laser spot is uniform, the variance-covariance matrix CX spot of X that is caused by laser spot could be calculated approximately by equation (5) (Schaer, 2007).
2 2 2
value of three-dimensional footprint into its vertical and horizontal error components, see (Schaer, 2007) in detail. Because of the comprehensive affection of the accuracy of distance and angle measurement as well as laser spot, the point error is equal to the sum of the measurement error and spot
Therefore, the point error distribution can be expressed by
T 2x y z -1 x y z k
X
C (7)
The equation (7) above describes the error ellipsoid of the point X in point cloud. According to the matrix orthogonal theory, the error ellipsoid can be transformed into standard form (Du., 2009).
According to the standard form of ellipsoid, the semimajor axis of the error ellipsoid which is described by equation (8) can be expressed as ak 1 , bk 2 and ck 3 . The probability that a laser scanning point lies inside the ellipsoid which depends on the k coefficient could be calculated. Whenk3, the probability is 97.07%, which indicates that the ISPRS Annals of the Photogrammetry, Remote Sensing and Spatial Information Sciences, Volume III-7, 2016
error ellipsoid contains all the point error information. Hence, point error space could be described by the error ellipsoid corresponding to k3.
2.2 Point cloud error space
There exists intersection between neighboring point error spaces when the interval is very small, which leading to that the actual point error space has changed. To estimate the actual point cloud error space, the actual point error space should be calculated by eliminate the influence of the overlapping error space. Assuming that there is an intersection along the y -axis, the point error ellipsoids can be expressed as follow:
the neighbouring point error spaces can be derived as3
Without considering the intersection of the neighboring point error spaces, the total volume of the point cloud error space is
Therefore, the actual volume of the point cloud error space can be obtained as.
3. DETERMINATION AND COMPUTATION OF THE DEFORMATION MONITORABLE INDICATOR
The deformation monitorable indicator (DMI) is the minimum deformation that can be extracted from point cloud and could be used to assess the capability of deformation monitoring as well. The DMI could be determined by the relationship between the actual point cloud error space and the point error space.
3.1 Determination of the deformation monitorable indicator
The actual point error space volume could be obtained by averaging the actual point cloud error space after eliminating the influence of the overlapping error space (equation 14).
actual
Without the consideration of the intersection of the neighboring point error spaces, the point error space volume is given by.
total
According to the equation (16), the rate
l
can be obtained by.l vactual
v
(17)
Then the actual variance-covariance CX of point in point cloud
could be calculated by.
So the actual point error can be obtained easily by
(1,1) (2, 2) (3, 3)
P
CX CX CX (19)The actual accuracy of point cloud could be assessed by the actual point error, therefore, the DMI could be determined by.
DMI P (20) Assuming that the deformation value calculated of a point in point cloud is def, if defDMI, the point will be considered non-deformed because the deformation is affected by the actual point error; if def DMI, the point will be determined to be deformed.
3.2 Computation of the deformation monitorable indicator
Before a case of deformation monitoring is carried out, a DMI could be obtained which is aimed at designing a suitable plan including choosing the appropriate instrument, setting up the appropriate scanning range and scanning interval according to the level of the deformation monitoring. To calculate the DMI, a RIEGEL-VZ400 terrestrial laser scanner is employed in this study. The accuracy of the vertical angle, horizontal angle, and range is 0.002deg, 0.008deg, and 3mm, respectively, which can be obtained from the manufacture specifications. Assuming that the scanning object is plane, and the scanning distance is 25m, a monitoring coordinate system could established, as shown in Figure 1.
In Figure 1, the point P is the location where the laser intersects the plane perpendicularly, so the incidence angle of P is equal to 0, namely, 0 . Therefore, the coordinate vector of P in the the monitoring coordinate system is equal to (D 0 0). According to the manufacture specifications, the Table 1 shows the point error space volume of 49 (7×7) points on the plane.
Point No 1 2 3 … 49
v
(mm3) 274.928 275.228 276.035 … 275.654Table 1. The volume of point error space
As shown in Table 1, the volume of the adjacent point error spaces are approximately equal. Figure 3 shows the relationship of the adjacent point error spaces.
Figure 1. Establishment of the monitoring coordinate system, where O is the laser origin of the scanner, is the incidence angle of the laser point on the plane.
(a)
(b)
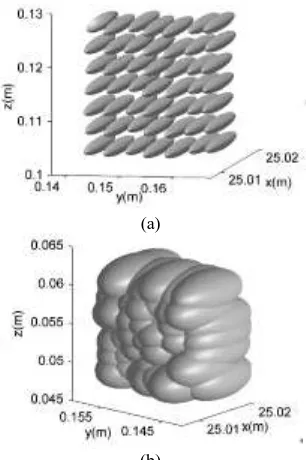
Figure 2. Point cloud error space:(a) the sampling interval
d
is equal to 5mm; (b) the sampling interval d is equal to 2mm. It is showed in Figure 2 that the 7×7=49 point cloud error space, where there obviously exist overlapping space between the neighbouring point error spaces in the case of d2mm, and non-overlapping space in the case of d5mm.According to the point error space volume shown in Table 1 and the interval d, the actual point error could calculated using the equations mentioned in the section 3 (Table 2).
The sampling interval of Table 2. The actual point error (mm)
The value of the actual point error with consideration of the overlapping error space is smaller than the value of the actual point error without consideration of the overlapping error space, as shown in Table 2.
It should be considered that the incidence angles of laser points change greatly in the point cloud in the case that the single sampling area is wide. Using the method mentioned earlier in this section, the actual point error of the laser point with the incidence angle changing from 0° to 60° by the step of 10° could be calculated (Figure 3).
TLS
Figure 3. The actual point error of the laser point with the changing incidence angle.
As shown in Figure 3, the actual point error of the points with the incidence angle changing from 0 to 40 are approximately equal. However, the actual point error increases obviously when the incidence angle is greater than 40°. Therefore, the sampling incidence angle should be control to the level that is less than or equal to 40 .
As derived above, considering the greatest sampling incidence angle, namely,
40 , the sampling area is equal totan tan
D D , and a piece of point cloud could be obtained including the sampling points whose quantity could reach
tan tan
D D
d d
as the greatest level. The actual error of the
whole points could be could be calculated and averaged, the DMI could be obtained at the distance D with the sampling interval d then.
4. EXPERIMENTS AND RESULTS
4.1 Experimental setup
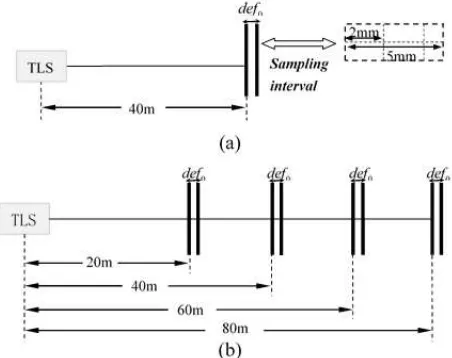
To assess the effectiveness of the proposed approach and evaluate its performance, validation experiments of plane board displacement have be carried out with the RIEGEL-VZ400 to simulate the procedure of deformation monitoring. A 0.4×0.5m plane board was used as the monitoring surface, which was mounted on a tripod via a moving appliance and the flatness is 0.2mm as depicted in Figure 4. The moving appliance could be moved along two perpendicular directions, and the amount of movement could be measured by the micrometer caliper. Two different sets of experiments were conducted to validate the performance of the DMI which is calculated by the proposed method, as depicted in Figure 5. A first set of experiments was performed to evaluate the effect of the DMI with the varying sampling interval at a fixed distance. The incidence angle was equal to 0deg. In the other set of experiments, the scanning distance was varied while the sampling interval was 2 mm and the incidence angle was equal to 0deg. In the two sets of experiments, the displacements of the plane board was implemented by operating the moving appliance, which ranged between 1 and 10mm, with an increment of 1mm between each scan. After each induced displacement, a TLS point cloud was acquired (referred to here after as data point cloud) and compared with the initial point cloud captured at 0mm displacement (referred to here after as reference point cloud).
Figure 4. The monitoring surface. A plane board was mounted on a tripod via a moving appliance, by which the board could be moved along two perpendicular directions.
Figure 5. Two different sets of experiments were conducted to validate the performance of the DMI, with (a) varying sampling intervals; (b) varying scanning distances. The def0 refers to the simulated displacement of the planar board.
4.2 Displacement detection and computation of the plane board
The computation of point deformation values in the data point cloud were performed using PolyWorks and following the point-to-primitive strategy (Pesci, 2013): A reference plane was determined by interpolating and fitting all the points in the reference point cloud. Then the differences point-to-primitive were computed and the displacement of the planar board was calculated by averaging the point differences in the data point cloud.
Assuming that def refers to the point difference in the data point cloud, the point will be determined to be deformed if def is greater than DMI, else it will be considered to be non-deformed. Percent of the deformed points (PODP) in the data point cloud could be calculated statistically then. The displacement detection of the planar board was processed by the normal distribution law of the point differences (Abellan, 2009):
68%
PODP (1) indicated conditions where the displacement ISPRS Annals of the Photogrammetry, Remote Sensing and Spatial Information Sciences, Volume III-7, 2016
could not be detected; PODP68%(1 ) indicated that the displacement could be detected.
The DMI was determined based on the accuracy of the instrument, the scanning distance and the sampling interval by two different approaches: the proposed method (PM,DMIPM)
considering the affect of the overlapping space between neighboring point error space, and the traditional method (TM,
TM
DMI ) without considering the influence of the overlapping space between neighboring point error space.
4.3 Results
4.3.1 Experiment 1: influence of varying sampling interval: The first set of experiment was performed to evaluate the effect of the DMI with the varying sampling interval at a fixed distance. The scanning distance was 40m, and the incidence angle was equal to 0deg.
Figure 6. The DMI calculated using the PM and TM method respectively for each sampling interval.
(a)
(b)
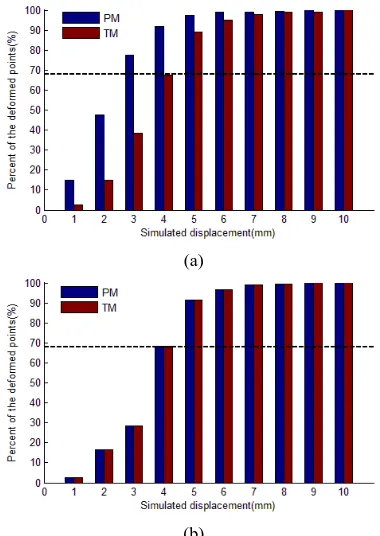
Figure 7. Results of the PDOP of each data point cloud with the varying sampling interval: (a) sampling interval=2mm; (b)
sampling interval=5mm. The black dotted line shows the threshold value of the PDOP where the displacement could be detected.
PM
DMI and DMITM were calculated for each sampling interval
with the fixed scanning distance, as shown in Figure 6. It is obvious that the DMIPM is sensitive to the sampling interval
variation but the DMITM is not, since the latter does not consider the overlapping space at all. Then the PODP of each data point cloudwas computed using the DMIPM and DMITM respectively, as depicted in Figure 7. Although the DMIPM and
TM
DMI both produce good performance to detect the displacement whose magnitude is same to itself, that proves their feasibility to be the indicator of monitorable deformation, the former does better than the latter in detecting the smaller displacement on the condition that there exists a intersection between the adjacent point error spaces, as shown in Figure 8.
Figure 8. The minimum magnitude of the monitorable displacements of each data point cloud with the varying sampling interval.
4.3.2 Experiment 2: influence of varying scanning distance: The other set of experiment was carried out to evaluate the effectiveness of the DMI with the varying scanning distance at a fixed incidence angle of 0deg and sampling interval of 2mm. The scanning distance ranged from 20m to 80m with the step of 20m.
Figure 9. The DMI calculated by the PM and TM method respectively for each scanning distance.
PM
DMI and DMITM were calculated for each scanning
distance with the fixed sampling interval, as shown in Figure 9. Then the PODP of each data point cloudwas computed using the DMIPM and DMITM respectively, as depicted in Figure 10.
(a)
(b)
(c)
(d)
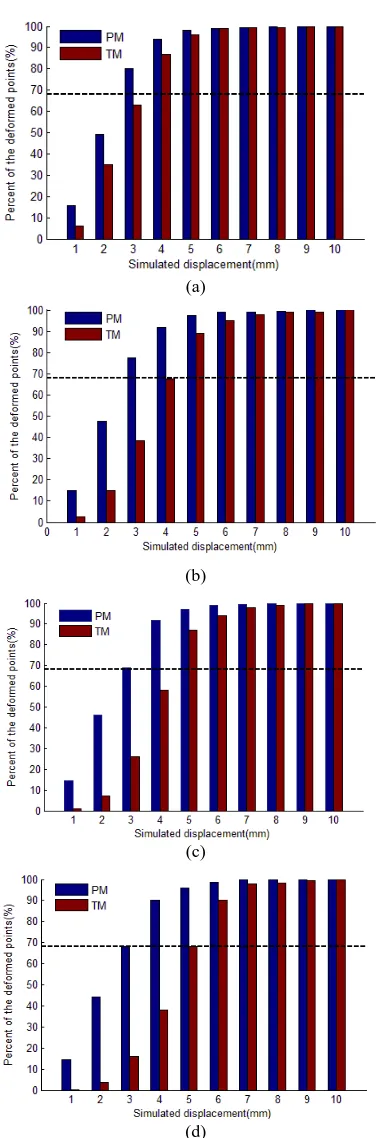
Fig. 10 Results of the PDOP of each data point cloud with the varying scanning distance: (a) distance=20m; (b) distance=40m; (c) distance=60m; (d) distance=80m. The black dotted line shows the threshold value of the PDOP where the displacement could be detected.
Fig. 11 The minimum magnitude of the monitorable displacements of each data point cloud with the varying scanning distance.
Figure 10 shows that the DMIPM is insensitive to the distance variation, whereas the DMITM is significantly influenced by the
distance variation since the sampling interval is small that leading to the existence the overlapping error space. Although the DMIPM and DMITM both produce good performance to
detect the displacement whose magnitude is same to itself, that proves their feasibility to be the indicator of monitorable deformation, the former does better than the latter in detecting the smaller displacement on the condition that there exists an intersection between the adjacent point error spaces, as shown in Figure 11.
5. CONCLUSIONS
In this paper, a new method for determining the deformation monitorable indicator (DMI) of point cloud using point cloud error space has been proposed. The core of the method is the calculation of the actual point error according to the relationship between the actual point cloud error space and the point error space. According to the results of the simulated experiments, the feasibility of DMIPM and DMITM to be the
indicator of monitorable deformation has been proved. Furthermore the DMIPM has produced better performance on
the condition of varying interval and varying scanning distance when there exists an intersection between the adjacent point error spaces. So a DMI could be determined by the proposed method before a case of deformation monitoring is carried out, then a plan would be designed to set up an appropriate scanning range and scanning interval.
ACKNOWLEDGEMENTS
This work is supported by the Changjang River Scientific Research Institute (CRSRI) Open Research Program (Program No. CKWV2014217/KY) and the National Natural Science Foundation of China (Grant No. 41174010).
REFERENCES
Abellán A., 2009. Detection of millimetric deformation using a terrestrial laser scanner: experiment and application to a rockfall event. Natural Hazards and Earth System Sciences, 9, pp.365– 372.
Armesto J., 2009. Terrestrial laser scanning used to determine the geometry of a granite boulder for stability analysis purposes. Geomorphology, 106(3 – 4), pp. 271 – 277.
Abellán A., 2010. Detection and spatial prediction of rockfalls by means of terrestrial laser scanner monitoring. Geomorphology, 119, pp. 162 – 171.
Bonali E., 2014. Deformation of ancient buildings inferred by terrestrial laser scanning methodology: the Cantalovo church case study (north Italy). Archaeometry, 56(4), pp. 703–716. Gordon S., 2007. Modelling terrestrial laser scanner data for precise structural deformation measurement. Journal of Surveying Engineering © ASCE, 133, pp. 72-80.
Du Z., 2009. Accuracy analysis of laser radar measurement system based on error ellipsoid model. Journal of Shanghai Jiaotong University, 43(12), pp. 1181-1885.
Grussenmeyer P., 2011. Accurate documentation in cultural heritage by merging TLS and high-resolution photogrammetric data. Proc. SPIE, 8085, pp.808508.
Golparvar-Fard M., 2011 Evaluation of image-based modelling and laser scanning precision for emerging automated performance monitoring techniques. Autom. Constr., 20(8), pp.1143 –1155.
Monserrat O., 2008. Deformation measurement using terrestrial laser scanning data and least squares 3D surface matching. ISPRS Journal of Photogrammetry and Remote Sensing, 63, pp. 142– 154.
Prokop A., 2009. Assessing the capability of terrestrial laser scanning for monitoring slow moving landslides. Natural Hazards and Earth System Sciences, 9, pp. 1921–1928. Pesci A., 2013. A laser scanning-based method for fast estimation of seismic-induced building deformations. ISPRS Journal of Photogrammetry and Remote Sensing, 79, pp. 185– 198.
Tang P., 2010. Automatic reconstruction of as-built building information models from laser-scanned point clouds: a review of related techniques. Autom. Constr, 19(7), pp.829 – 843. Schaer P., 2007. Precision estimation for laser point cloud including scanning geometry. In: The International Archives of the Photogrammetry, Remote Sensing and Spatial Information Sciences, Vol. 35, Issue 5, pp. 1-8.
Soudarissanan, S., 2011. Scanning geometry: Influencing factor on the accuracy of terrestrial laser scanning points. ISPRS Journal of Photogrammetry and Remote Sensing, 66, pp. 389– 399.
Zhang S., 2008. Discussion on application of 3D laser scanning technology to ground subsidence monitoring. COAL SCIENCE AND TECHNOLOGY, 36(11), pp. 91-94.