VESSEL CLASSIFICATION IN COSMO-SKYMED SAR DATA USING HIERARCHICAL
FEATURE SELECTION
A. Makedonas a, C. Theoharatos b, *, V. Tsagaris b, V. Anastasopoulos a, S. Costicoglou c
a
Electronics Laboratory (ELLAB), Physics Department, University of Patras, Patras 26500, Greece – (anmack, vassilis)@upatras.gr b
Computer Vision Systems, IRIDA Labs S.A., Patras Science Park, Stadiou Str., Platani, 26504 Patras, Greece – (htheohar,tsagaris)@iridalabs.gr
c Space Hellas S.A., 312 Messogion Ave., 15341 Athens, Greece – [email protected]
Commission VI, WG VI/4
KEY WORDS: Ship classification, COSMO-SkyMed data, high resolution SAR imagery, vessel recognition, feature extraction, hierarchical feature selection.
ABSTRACT:
SAR based ship detection and classification are important elements of maritime monitoring applications. Recently, high-resolution SAR data have opened new possibilities to researchers for achieving improved classification results. In this work, a hierarchical vessel classification procedure is presented based on a robust feature extraction and selection scheme that utilizes scale, shape and texture features in a hierarchical way. Initially, different types of feature extraction algorithms are implemented in order to form the utilized feature pool, able to represent the structure, material, orientation and other vessel type characteristics. A two-stage hierarchical feature selection algorithm is utilized next in order to be able to discriminate effectively civilian vessels into three distinct types, in COSMO-SkyMed SAR images: cargos, small ships and tankers. In our analysis, scale and shape features are utilized in order to discriminate smaller types of vessels present in the available SAR data, or shape specific vessels. Then, the most informative texture and intensity features are incorporated in order to be able to better distinguish the civilian types with high accuracy. A feature selection procedure that utilizes heuristic measures based on features’ statistical characteristics, followed by an exhaustive research with feature sets formed by the most qualified features is carried out, in order to discriminate the most appropriate combination of features for the final classification. In our analysis, five COSMO-SkyMed SAR data with 2.2m x 2.2m resolution were used to analyse the detailed characteristics of these types of ships. A total of 111 ships with available AIS data were used in the classification process. The experimental results show that this method has good performance in ship classification, with an overall accuracy reaching 83%. Further investigation of additional features and proper feature selection is currently in progress.
1. INTRODUCTION
During the past two decades, ocean ship monitoring and recognition has raised much attention in the remote sensing community, with applications in maritime management, fishing law enforcement, illegal immigration monitoring and rescue, safe shipping and oil spill detection. Conventional techniques include Automatic Identification Systems (AIS) and Vessel Traffic Services (VTS), which are functional mainly at shoreline and for compliant ships. In recent years, satellite Synthetic Aperture Radar (SAR) systems have raised much attention in vessel traffic monitoring (Limes, 2006; Greidanus, 2006), due to their insensitivity to weather and illumination condition changes, but also due to the need to provide feedback in cases that AIS or VTS systems are not adequate or fully functional.
Even though SAR images have been widely used for ship detection practices, little research has been performed on ship classification. Early works were devoted to the analysis of backscattering properties of vessel signatures in inverse synthetic aperture radar (ISAR) images (Musman, 1996; Menon, 1993), which have also gained some insights nowadays (Martorella, 2009). However, the classification accuracy of these methods is rather limited in low or medium resolution SAR images, without having the means to be further improved. Recently, research has shifted to the exploitation of polarimetric SAR data properties presented by (Touzi, 2004), (Margarit, 2006) and (Margarit, 2009), which utilize the composite mechanisms of ships based on
combinations of basic scattering procedures. The geometric properties of the polarimetric scattering behaviour can act as a good estimate of the vessel’s category under investigation. However, this method requires fully polarimetric data and the adoption from ship recognition systems is rather limited, mainly due to the increased cost of polarimetric data with respect to single-pol (or even dual-pol) ones.
Besides research on ISAR and polarimetric data that impose the limitations addressed previously, various feature extraction and selection techniques have been proposed for ship pattern analysis and classification. For example, a variety of extracted features and different distance metrics were used in (Cotuk, 2003) to compare the performance of point-enhanced high range-resolution (HRR) profiles and successfully recognize oil tankers, ferries and yachts. An approach to categorize targets using fuzzy logic decision rule was presented in (Margarit, 2011), based on some macroscale features such as length, breadth, and radar cross section profile along the ship signature.
(Zhang, 2013), the orientation of the principal axis is extracted based on Hough Transform (HT) and the minimum enclosing rectangle (MER) of ship chips. Both features are used to classify correctly between three different ship types on Cosmo-SkyMed SAR data according to the width ratio of MER between the HT line, the ratio of ship and non-ship points on the principal axis, as well as the scattering density. Recognition of civilian vessels based on the ratio of backscattering and structural features was also performed on Cosmo-SkyMed images (Jiang, 2012), demonstrating good classification precision on three different ship types containing cargos, containers and oil tankers.
However, the extraction of a high number of features and their utilization in the classification scheme increases significantly the dimension of the constructed feature space, not to mention that there exists redundancy among the various features. Therefore, some researchers have recently proposed different feature selection methodologies to cope with these restrictions. In such a study, an abundant of feature extraction algorithms for ship pattern analysis were proposed (Chen, 2012), followed by a novel RCS density encoding feature for ship description and a two-stage feature selection approach. A novel ship classification scheme based on analytic hierarchy process (Zhao, 2013) on both feature selection containing several evaluation measures and classification decision demonstrated good results on TerraSAR-X images. Recently (Wang, 2014), a novel hierarchical ship classifier for COSMO-SkyMed SAR data was proposed based on the analysis of geometric and backscattering characteristics of various ship types. The ships were classified into bulk carriers, container ships, and oil tankers, with an average accuracy of more than 80%. In this way, commercial ships can be divided into container ships, tankers, general cargos, bulk carriers and other types of ships (e.g. ferries, passenger, etc.) (Zhang, 2013). This manuscript presents a novel hierarchical vessel classification procedure for ship classification using COSMO-SkyMed SAR data with 3-m resolution. In the first stage, four different types of feature extraction algorithms are implemented in order to form the utilized feature pool, able to represent the structure, material, orientation and other vessel type characteristics. A two-stage hierarchical feature selection algorithm is utilized next in order to be able to discriminate effectively civilian vessels into three distinct types, in COSMO-SkyMed SAR images: cargos, small ships and tankers. In our analysis, scale and shape features are utilized in order to discriminate smaller types of vessels present in the available SAR data, or shape specific vessels. Then, the most informative texture and intensity features are incorporated in order to be able to better distinguish the civilian types with high accuracy. A feature selection procedure that utilizes heuristic measures based on features’ statistical characteristics, followed by an exhaustive research with feature sets formed by the most qualified features is carried out, in order to discriminate the most appropriate combination of features for the final classification. A total of 111 ships were used in the classification process, while AIS data were applied to verify the effectiveness of the algorithm. The experimental results show that this method has good performance in ship classification, with an overall accuracy reaching 83%.
The rest of this paper is organized as follows. The experiment and SAR data description is provided in Section 2. Section 3 provides the general methodology of the approach, consisting of the data pre-processing algorithms, a short description of the utilized CFAR-based ship detector, the general feature extraction methodology, the proposed feature selection
technique and the description of the classification procedure. Experimental results are analysed in Section 4 and conclusions are made in Section 5 along with future research objectives.
2. EXPERIMENT DESCRIPTION
The high resolution SAR scenes used in this study were acquired on June 17 to June 19, 2013 in the greater area of Malta, by the Cosmo-SkyMed instrument, having HH polarization and resolution of . × . . The incident angle was between . ° and . °. The experiment area is located in the yellow rectangle presented in Figure 1. Five scenes that were situated in the highlighted area and for the specific dates were used for the experiments. For all the processed scenes AIS data were also used in order to classify the detected ships according to the AIS class specifications.
Figure 1. The experiment’s test site (acquired from Google Earth).
3. METHODOLOGY
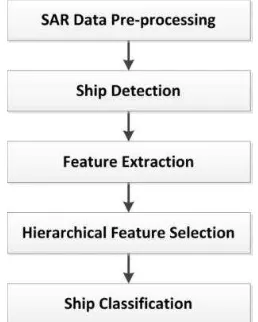
The proposed method can be mainly divided into five parts, which are shown in Figure 2. In the following sections a brief description of the approaches implemented for the specific flow chart is given.
3.1 SAR Data Pre-processing
The application of proper pre-processing techniques will not only reduce the recognition computational burden but also give the user the opportunity to extract the most useful information and avoid of the redundant and confusing patterns in terms of classification. The pre-processing step consists of the initial scene ortho-rectification, speckle filtering and land masking, along with the conversion in a format suitable for the next processing steps.
3.2 Ship Detection
Ship detection from SAR images has been deeply reviewed during these past three decades. Crisp (Crisp, 2004) compares a number of ship detection software systems, while the topic is actively researched until nowadays (Tunaley, 2010; Juan, 2009). Ships must be detected against a background of radar sea clutter. Different distributions have been proposed in the literature to describe the intensity statistics of radar sea clutter (Crisp, 2004; Darymli, 2013). These techniques involve the specification of a Constant False Alarm Rate (CFAR), which implies that a threshold of detection is set according to the local statistics of the clutter at each point in the image plane in order to avoid increased false alarms.
In this work, the optimal parametric CFAR for Weibull clutter proposed by Anastassopoulos was utilized (Anastassopoulos, 1995). The optimal Weibull CFAR (OW-CFAR) detector is implemented using the maximum likelihood estimation (MLE) method, which was proven to be asymptotically efficient estimator of the mean power of the Weibull clutter.
Prior to feature extraction from the detected ships some basic pre-processing stages comprising:
The rotation of ships in such a way that the main axis is the tangent of the horizontal axis.
The extraction of the Minimum Enclosing Rectangle (MER).
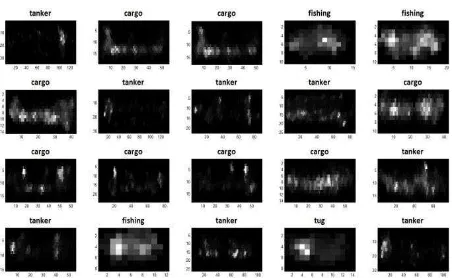
A number of the resulting pre-processed detected ships are illustrated in Figure 3.
Figure 3. Resulting pre-processed detected ships.
3.3 Feature Extraction
A huge number of features appropriate for characterizing the detected vessels are available in the remote sensing literature (Chen, 2012). In this work, the selected features are grouped into two main categories.
Scale and shape features
Textural features
A brief description of the proposed features will be given in the following section. Nevertheless more features can be used in order to have a better characterization and discrimination of the final vessel classes.
3.3.1 Extraction of shape and scale features: After computing the bounding box that surrounds the detected vessel a shape feature extraction scheme will be applied. The shape features initially selected for this purpose are the following:
Area: the actual number of pixels of the detected vessel.
Equivalent Diameter: the diameter of a circle with the same area as the detected vessel body, computed as:
Equivalent Diameter = √ ×a eaπ (1)
Extent: the ratio of pixels in the region to pixels in the total bounding box. Computed as the Area divided by the area of the bounding box.
Gamma value: �, is given by
γ = Peπ e eea 2 (2)
Major Axis: the length (in pixels) of the major axis of the ellipse that has the same normalized second central moments as the detected vessel body.
Perimeter: the distance around the boundary of the detected vessel body.
Size ratio: is given by
Size ration = a (3)
Solidity: the proportion of the pixels in the convex hull that are also in the detected vessel body, computed as:
Solidity = veea ea (4)
3.3.2 Extraction of textural features: In order to extract meaningful texture features, appropriate modification of the given data must be done. Texture measures like the co-occurrence matrix have found application in satellite image processing and analysis. In order to extract texture features from the detected vessel bounding box, Gray-Level Co-occurrence Matrices (GLCMs) along with Gray Level Run-Length Matrices (GLRLM) will be utilized.
Whether considering the intensity or grayscale values of the image-data or various dimensions of colour, the co-occurrence matrix can measure the texture of the image-data. Because co-occurrence matrices are typically large and sparse, various metrics of the matrix are often taken to get a more useful set of features. Features, generated using this technique, are usually called Haralick features (Haralick, 1973).
co-occurring values at a given offset. It is formulated over an
Δx, Δy represent the given offset.
Given the GLCM, local Haralick texture features (Haralick, 1973) can be now computed, such as:
Energy=∑ GLCM i, jI, (6) of the row (or column, due to symmetry) sums, μ is the weighed pixel average given by:
μ = ∑ i ∙ GLCM i, j =, ∑ j ∙ GLCM i, j,
and σ is the weighed pixel variance given by:
σ = ∑ i − μ GLCM i, j = ∑ j − μ GLCM i, j ,
,
Moreover local higher order statistics texture coefficients based on the Gray Level Run-Length Matrix (GLRLM) will be processed (Tang 1998). The GLRLM is a two dimensional matrix in which each element GLRLM i, j|θ gives the total number of occurrences of runs of length j at grey level i, in a given direction θ. Thus, given the GLRLM we can calculate the following indices:
Low Grey Level Run Emphasis= =
r∑
, 2
, (19)
High Grey Level Run Emphasis=
r∑ i GLRLM i, j, (20)
Short Run Low Grey Level Run Emphasis= =
r∑
, 2 2
, (21)
Short Run High Grey Level Run Emphasis=
r∑
2 ,
2
, (22)
Long Run Low Grey Level Run Emphasis= =
r∑
2 ,
2
, (23)
Long Run High Grey Level Run Emphasis= =
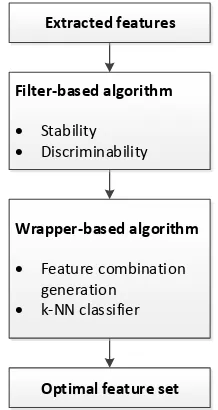
Various feature selection algorithms are available in the literature. Those algorithms can be classified into filter-based and wrapper-based algorithms (Chen, 2012). A feature selection scheme adopted is presented in Figure 4.
Extracted features
Figure 4. Feature selection procedure scheme.
optimal feature set is the one that presents the maximum overall classification accuracy.
3.4.1 Stability: For calculating the stability measure, the normalized variance coefficient is used, given by (Chen,
� the feature checked for its stability,
‖ ��‖ is the second norm of feature vector
��, while
� [‖ ��‖ ] denotes the square of mean value.
The lower the stability ρω is, the more stable the feature is found, and thus this feature will be able to provide better classification results.
3.4.2 Discriminability: The discriminability of a given feature is calculated as an inter-intra class distance ratio defined as (Chen, 2012):
J = B
W (26)
where SW is the average within-class covariance matrix, while S is the estimation of the average between-class covariance matrix.
Those values can be estimated from the given data sets by:
SW =
denotes the number of classes,
�� the number of ships that belongs to the class �, and
� the total number of the ships in the dataset.
The higher the value of J is, the more discriminative the feature is, and thus this feature can be able to better discriminate different types of ships.
3.4.3 Wrapper-based algorithm: Features that present high stability and discriminability scores can next be checked thoroughly in every possible combination. The created feature sets are applied to a training classifier directly with their performance evaluation based on the classification results of the training data. K-NN classifier is used in order to evaluate the aforementioned formed feature sets and the maximum precision is used for the selection of the most appropriate feature set. The precision is computed by:
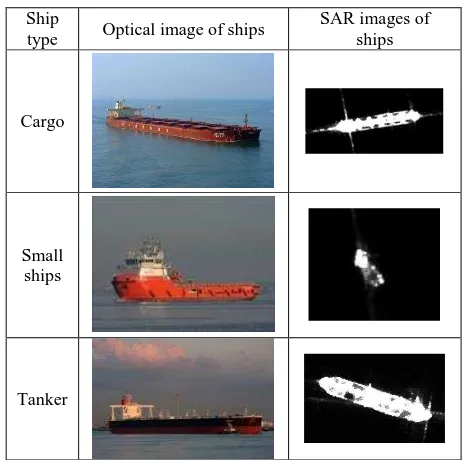
P = c (29) constructed by different materials and their deck is occupied by different structures, so the backscattering coefficient in SAR images is different as well. Table 1 shows typical images of all three kinds of ships forming the given dataset. The images show that the scattering components can represent the physical meaning of the ships’ structure in a very accurate way.
Ship
type Optical image of ships
SAR images of
Table 1. Optical images of ships and their associated SAR images.
Small ships category consists of 7 fishing boats and 6 tug pilots. For all the ships of the dataset a feature vector of 26 dimensions, as the total number of the aforementioned shape and texture features is created. The first 8 dimensions refer to the shape features described in 3.3.1, while the remaining vector is completed by the texture features derived by the GLRLM and GLCM respectively.
category of small ships could be divided into fishing boats and tugs, as shown in Figure 5.
Figure 5. Hierarchical classification scheme, utilizing two distinct classification stages, plus a potential third one.
4. EXPERIMENTAL RESULTS
For a classification scheme, where all extracted features are taken into count, using a k-NN classifier (� = ) the overall accuracy is calculated equal to . % (recall for each category is . % | . % | . %) for the three categories. The confusion matrix for the specific classification scheme is presented in Table 2.
Actual classes
Predicted classes
Recall cargo small ships tanker
cargo 32 0 8 80,00%
small
ships 2 9 2 69,23%
tanker 12 4 42 72,41%
Precision 74,47% 69,57% 80,77% 74,77% Table 2. Confusion matrix for a classification scheme using
all extracted features.
Although the overall accuracy of the previous classification scheme, where all the extracted features were used for the classification, a hierarchical approach is more adequate and, as we will see in what follows, gives better classification results.
4.1 Hierarchical-based vessel classification results
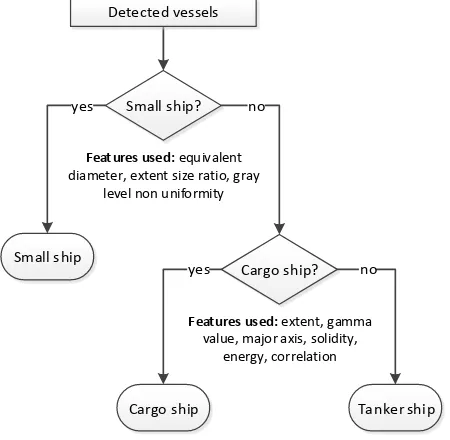
For every stage of the hierarchical classification procedure an exhaustive search between the strongest features for the specific stage is implemented. The features used for each one of the two stages of the Hierarchical classification scheme are shown in Figure 6.
Following the feature extraction procedure, feature stability and discriminability analysis results are presented in Figure 7 and Figure 8 respectively. From the resulting measurements a first selection of the stronger features regarding those filter based algorithms is done, with those features used as an input to the wrapper based algorithms section, where an exhaustive search is implemented using all possible combinations of those features as an input in a k-NN classifier.
Small ship?
Small ship yes
Cargo ship? no
Cargo ship
yes no
Detected vessels
Features used: extent, gamma value, major axis, solidity,
energy, correlation Features used: equivalent
diameter, extent size ratio, gray level non uniformity
Tanker ship
Figure 6. Hierarchical classification scheme with the dominant features used in every stage.
Figure 7. Feature stability results.
Figure 8. Feature discriminability results.
Actual classes
Predicted classes
Recall tanker / cargo small ships
tanker /
cargo 97 3 97,00%
small ships 1 10 90,90%
Precision 99,00% 76,90% 96,40% Table 3. Confusion matrix for the first stage of the
hierarchical classification.
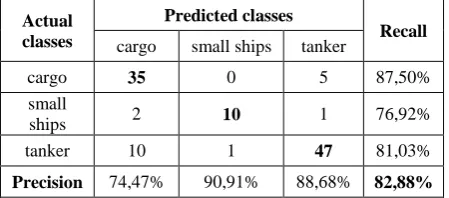
Moving forward to the second stage, where cargo ships are separated from tanker ships, the confusion matrix of the overall Hierarchical classification scheme is presented in Table 4. The overall accuracy is computed equal to , % cargo small ships tanker
cargo 35 0 5 87,50%
small
ships 2 10 1 76,92%
tanker 10 1 47 81,03%
Precision 74,47% 90,91% 88,68% 82,88% Table 4. Confusion matrix for the overall hierarchical
classification scheme.
5. CONCLUSIONS
In this paper, a novel hierarchical vessel classification procedure for ship classification using COSMO-SkyMed SAR data with 3-m resolution is presented. Different types of feature extraction algorithms are implemented in order to form the utilized feature pool, able to represent the structure, material, orientation and other vessel type characteristics. A two-stage hierarchical feature selection algorithm is utilized next in order to be able to discriminate effectively civilian vessels into three distinct types, in COSMO-SkyMed SAR images: cargos, small ships and tankers. In our analysis, scale and shape features are extracted in order to discriminate smaller types of vessels present in the available SAR data, or shape specific vessels. Next, the most informative texture and intensity features are incorporated in order to be able to better distinguish the civilian types with high accuracy. A feature selection procedure that utilizes heuristic measures based on features’ statistical characteristics, followed by an exhaustive research with feature sets formed by the most qualified features is carried out, in order to discriminate the most appropriate combination of features for the final classification. A total of 111 ships were used in the classification process, while AIS data were applied to verify the effectiveness of the algorithm. The experimental results show that this method has good performance in ship classification, with an overall accuracy reaching 83%. The fact that various feature combinations achieve similar classification results might be used in training various classifiers and combine them in order to have a more accurate final classification. Several combinations of the strongest features can provide similar classification results, as the one presented previously. The feature combination that achieved the highest classification accuracy and consists of fewer features is chosen for the evaluation of the proposed
procedure. Nevertheless other feature combination setup might be used in order to achieve similar results.
Future research objectives include the incorporation of other feature selection algorithms for the selection of the strongest features, regarding the classification task and the sensor used. It is expected that different feature combination will perform better in other SAR sensors and resolution. In addition, further investigation of additional features is currently in progress.
6. ACKNOWLEDGEMENTS
This work was supported in part by the Hellenic General Secretariat for Research and Technology (GSRT), in the frame of project “JASON”, belonging to “Cooperation 2011”.
REFERENCES
Anastassopoulos, V., Lampropoulos, G.A., 1995. Optimal CFAR detection in Weibull clutter, IEEE Trans. on Aerospace and Electronic Systems. 31(1), pp. 52-64.
Chen, W.-T., Ji, K.-F, Xing, X.-W., Zou, H.-X., 2012. Ship recognition in high resolution SAR images based on feature selection. In: International Conference on Computer Vision in Remote Sensing (CVRS12), pp. 301-305.
Cotuk, N., Turea S., Certin, M., 2003. Application of point enhancement technique or ship target recognition by HRR. In: Proc. SPIE 5095, Algorithms for Synthetic Aperture Radar Imagery X, vol. 185, doi:10.1117/12.487930.
Crisp, D.J., 2004. The State-of-the-Art in Ship Detection in Synthetic Aperture Radar Imagery. Intelligence, Surveillance and Reconnaissance Division Information Sciences Laboratory, DSTO–RR–0272.
Darymli, K. E., McGuire, P., Power, D., Moloney, C., 2013. Target Detection in Synthetic Aperture Radar Imagery: A State-of-the-Art survey. Journal of Applied Remote Sensing, 7(1).
Greidanus, H., Kourti, N., 2006. Findings of the DECLIMS project—Detection and classification of marine traffic from space. In: Proceedings of SEASAR, Frascati, Italy, pp. 1-9.
Haralick, R. M., Shanmugam, K., Dinstein, I., 1973. Textural features for image classification. IEEE Transactions on Systems, Man, and Cybernetics, 3(6), pp. 610-621.
Jiang, S., Wu, F., Wang, C., Zhang, B., 2012. Civilian Vessel Classification with COSMO-SkyMed Images Based on Feature Analysis. In: 2012 International Conference on Computer Vision in Remote Sensing (CVRS), 16-18 Dec. 2012, pp. 279-284.
Juan, W., Lijie, S., Xuelan, Z., 2009. Study evolution of ship target detection and recognition in SAR imagery. In: Proc. International Symposium on Information Processing (ISIP’09), Huangshan, P. R. China, pp. 147–150.
Margarit G., Tabasco, A., 2011. Ship classification in single-pol SAR images based on fuzzy logic. IEEE Trans. Geoscience and Remote Sensing, 49(8), pp. 3129-3138.
Margarit, G. Mallorqui, J.J., Rius, J.M., Sanz-Marcos, J., 2006. On the usage of GRECOSAR, an orbital polarimetric SAR simulator of complex targets, to vessel classification studies. IEEE Trans. on Geoscience and Remote Sensing, 44(12), pp. 3517-3526.
Margarit, G., Mallorqui, J.J., Fortuny-Guasch, J., Lopez-Martinez, C., 2009. Exploitation of ship scattering in polarimetric SAR for an improved classification under high clutter conditions. IEEE Trans. on Geoscience and Remote Sensing, 47(4), pp. 1224-1235.
Martorella, M., Giusti, E., Capria, A., Berizzi, F., Bates, B., 2009. Automatic target recognition by means of polarimetric ISAR images and neural networks. IEEE Trans. on Geoscience and Remote Sensing, 47(11), pp. 3786-3794.
Menon, M.M., Boudreau, E.R., Kolodzy, P.J., 1993. An automatic ship classification system for ISAR imagery. Lincoln Laboratory Journal, 6(2), pp. 289-308.
Musman, S., Kerr, D., Bachmann, C., 1996. Automatic recognition of ISAR ship images. IEEE Trans. on Aerospace and Electronics Systems, 32(4), pp. 1392-1404.
Tang, X., 1998. Texture information in run-length matrices. IEEE Transactions on Image Processing, 7(11), pp. 1602 – 1609.
Touzi, R., Raney, R.K., Charbonneau, F., 2004. On the use of permanent symmetric scatterers for ship characterization, IEEE Trans. on Geoscience and Remote Sensing, 42(10), pp. 2039-2045.
Tunaley, J.K.E., 2010. Ship detection in SAR imagery. Tech. rep., LRDC Technical Report.
Wang, C., Zhang, H., Wu, F., Jiang, S., Zhang, B., Tang, Y., 2014. A Novel Hierarchical Ship Classifier for COSMO-SkyMed SAR Data. IEEE Trans. on Geoscience and Remote Sensing Letters, 11(2), pp. 484-488.
Yin, X., Wang C., Zhang, H., 2012. Vessel recognition with high resolution TerraSAR-X image based on structure feature. Journal of Image and Graphics, l7(1), pp.106-113, January 2012.
Zhang, H., Tian, X., Wang, C., Wu, F., Zhang, B., 2013. Merchant vessel classification based on scattering component analysis for COSMO-SkyMed SAR images. IEEE Geoscience and Remote Sensing Letters, 10(6), pp. 1275-1279.