www.elsevier.nlrlocaterjappgeo
A ground-penetrating radar survey for archaeological
ž
/
investigations in an urban area Lecce, Italy
V. Basile, M.T. Carrozzo, S. Negri, L. Nuzzo
), T. Quarta, A.V. Villani
( )
OsserÕatorio di Fisica e Chimica della Terra e dell’Ambiente OFCTA , Dipartimento di Scienza dei Materiali,
UniÕersita Degli Studi di Lecce, Via per Arnesano, 73100 Lecce, Italy`
Received 22 September 1999; accepted 10 November 1999
Abstract
Ž . Ž
A ground-penetrating radar GPR survey, using mostly a 500 MHz antenna, was carried out in an urban area Lecce,
.
Italy to obtain a detailed characterization of the most superficial layers, where presumably archaeological structures are buried, and to quickly identify anomalous zones for excavation. In the area, the presence of remnants of a historical
Ž . Ž .
Franciscan friary built in 1432 and pulled down in 1971 and, probably, of more ancient Roman andror Messapic features
Ž .
was expected. The geological setting mainly wet calcarenite named ‘‘Pietra Leccese’’ was not the most favourable for the application of GPR methodology because of an expected high attenuation of electromagnetic energy. The low penetration depth of the signal, not exceeding 1 m and even using a 100 MHz antenna, made it possible to obtain information only between the ground level and the top of the calcarenitic basement. Data recorded along parallel profiles, 1 m spaced, prevented the clear identification of the walls of the historical building constructed in ‘‘Pietra Leccese’’ blocks, because of the weak contrast in the electromagnetic parameters with respect to the hosting material. On the other hand, the analysis of the radar sections allowed for identification and reconstruction of the shape and extension of a barrel-vault cavity, subsequently confirmed by archaeological excavations. Time slice representations were used as a tool to locate other features including modern-day urban utilities and the planimetric development of the barrel-vault cavity.q2000 Elsevier Science
B.V. All rights reserved.
Keywords: Ground-penetrating radar; Archaeological investigations; Time slices; Barrel-vault cavity; Urban area
1. Introduction
Geophysical investigations play an important role in defining shallow subsurface geology. In
)Corresponding author. Fax:q0039-832-320-547.
Ž .
E-mail address: [email protected] L. Nuzzo .
particular, they can be a non-destructive, cost-effective way to locate buried structures in archaeological studies. Compared with con-ventional geophysical tools for very shallow explorations, the electromagnetic method,
Ž .
ground-penetrating radar GPR , is more eco-nomical and produces large amounts of continu-ous, high resolution subsurface data.
Archaeo-0926-9851r00r$ - see front matterq2000 Elsevier Science B.V. All rights reserved. Ž .
logical prospecting using GPR has proven to be successful in a wide variety of applications:
– search for graves, burial sites, or human
Ž
remains Vaughan, 1986; Bevan, 1991;
Mel-.
lett, 1992; Unterberger, 1992 ;
– detection of buried foundations, walls, floors and other housing structures, and
Ž
sometimes, man-made objects Vaughan, 1986; Imai et al., 1987; Sternberg and McGill,
.
1995 ;
– restoration of ancient villages buried by
Ž
volcanic eruptions Conyers, 1996; Tohge et
.
al., 1998 ;
Ž
Appropriate data processing stacking, filtering,
.
migration and advanced visualization tech-niques can help in understanding and interpret-ing GPR data. To obtain a significant ‘‘picture’’ of the underground electromagnetic discontinu-ities, both 3D data collection, generally along closely-spaced parallel survey lines with suffi-cient spatial sampling in order to reduce aliasing problems, and time-consuming 3D data process-ing are required. The limited time available for the survey and positioning problems related to the sizes of the antennae generally lead to the selection of a line separation larger than that required for 3D data processing to be effective. The acquisition along parallel profiles, however, permits the realization of GPR time slices
ŽGoodman et al., 1994; Conyers and Goodman,
.
1997 which allow the correlation of anomalies recorded at the same time and so are one of the most useful data presentations for understanding the nature of subsurface structures over large areas at different depths.
In this paper, the experimental results of a
Ž
GPR survey, carried out in an urban area Tito
.
Schipa Square, Lecce, Southern Italy to locate buried archaeological structures related to a his-torical building and to ascertain whether other remnants of previous ages were present in the area, are reported. The survey area is located on
a wet Miocenic calcarenite named ‘‘Pietra Lec-cese’’ characterized by high degree of homo-geneity. ‘‘Pietra Leccese’’ has been commonly used, since ancient times, to construct private and public buildings, therefore ruins can be mistaken for irregularities of the calcarenitic basement. The survey was carried out in the continuous mode along parallel profiles, 1 m spaced, using mostly a 500 MHz antenna. The raw data generally show, as expected, low am-plitude signals locally broken by very shallow reflections andror hyperbolically shaped anomalies characterized by high amplitudes. The quality of the original data did not require ad-vanced processing techniques; in fact the appli-cation of different filters did not significantly improve the data quality. To recover, at least partially, the true shape of subsurface reflectors, a 2D migration routine was made. This tech-nique, collapsing the diffraction hyperbolas due to small-scale heterogeneities, enhances the most significant events. Time-slice maps, obtained from migrated sections, furnished a good pic-ture of the pipes present in the first half meter of depth and of a barrel-vault cavity of large dimensions in the second half meter, but was not able to clearly locate the ruins of the ancient building because of the low amplitudes of anomalies produced by it.
2. Site description
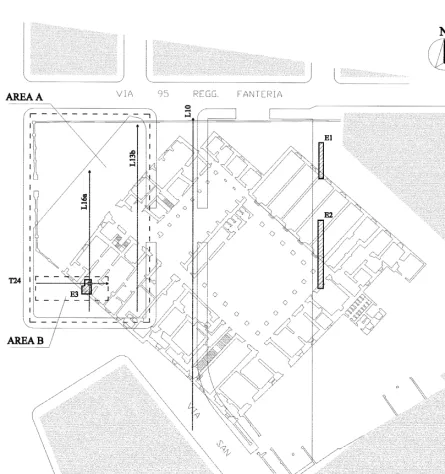
The site, a flat area measuring approximately 10,000 m2, is at present a square centrally lo-cated in the city of Lecce, partially asphalted
Ž .
and used as parking area Fig. 1 . The city of Lecce is almost entirely built on a fine-grained, compact, wet Miocenic calcarenite, named ‘‘Pietra Leccese’’, that is interbedded with thin clay layers, especially toward the top. The stone, which is easy to sculpt, is used not only as building stone for houses and public buildings,
Ž
stat-Ž . Ž .
Fig. 1. Location a and photograph b of the survey site: Tito Schipa square, Lecce, Italy.
.
ues , as can be seen in the numerous famous baroque monuments.
In the area, near a pre-existent chapel named ‘‘S. Maria al Tempio’’, a Franciscan friary was built in 1432, using ‘‘Pietra Leccese’’
calcaren-Ž .
ite as building stone Cappello et al., 1981 . In 1861, the Franciscan building was transformed into military barracks named ‘‘Caserma Oronzo Massa’’ and underwent numerous enlargements and modifications until its destruction in 1971. The investigation area is just outside the histori-cal centre of the city near the Carlo V Castle
ŽXVI century and the Roman Amphitheatre II. Ž .
century . Because of its geographical position,
archaeological targets could be, not only ruins related to the ancient Franciscan building, but also remnants and hypogean structures, such as
Ž
tombs, of Roman or Messapic VI–VIII century
.
BC ages. Indeed, such interesting remnants have been discovered in close proximity to the investigation area during excavations for instal-lation of urban utilities.
archaeological investigations were planned by the Archaeological Superintendency of Puglia and carried out by the Department of Cultural
Heritage of the University of Lecce. Further-more, a GPR survey was performed in the first week of July 1997 by OFCTA, before carrying
Fig. 2. Survey area and location map of ‘‘Caserma O. Massa’’ before its destruction. Dashed lines mark the limits of areas A
Ž Ž ..
out archaeological excavations, to obtain a de-tailed map of the most superficial layers, where presumably, some archaeological structures were
buried. In Fig. 2, the location map of GPR survey overlaid on the archaeological outlines resulting from a recent map of the ‘‘Caserma O.
Massa’’ is shown, while a close-up of the west-ern zone is shown in Fig. 3. For clarity only, the profiles mentioned in the text are labeled.
3. GPR survey
3.1. Field instrumentation and data acquisition
Ž
A Subsurface Interface Radar System-2 SIR
.
2 manufactured by Geophysical Survey
Sys-Ž .
tems, GSSI was used for the GPR survey. Two antennae with centre frequencies of 100
Ž . Ž
MHz GSSI model 3207 , and 500 MHz GSSI
.
model 3102A were used. Most of our work used the 500 MHz antenna, because the resolu-tion obtained with the 100 MHz antenna was too low to be effective for most archaeological targets of interest. After some tests in situ aimed at calibration of the instrument, the following data acquisition parameters for the 500 MHz antenna were selected:
Ø recording time window: 60 ns;
Ø band-pass IIR filters: from fAr3 to 2 f ,A where fA is the antenna central frequency;
Ø gain function: manual;
Ø reference marks distance: 0.95 m.
A reconnaissance survey on the entire area was made using the 500 MHz antenna, with profile lines oriented S–N at 5 m intervals. The highest density of radar anomalies was found in
Ž
the western part of the survey area area A in
.
Fig. 2 , where an interesting, as well as strong hyperbolically-shaped anomaly, was also
re-Ž .
vealed area B in Fig. 2 . A more detailed survey, along S–N parallel profiles, 1 m spaced,
Ž .
was then carried out in area A Fig. 3 .
More-Ž .
over, in area B Fig. 3 an orthogonal set of profiles, at the same spacing, was also run to better define the planimetric development of the main anomaly.
3.2. Preprocessing and data analysis
A minimal processing was realised before analysing the radar sections. Horizontal scale
Ž
was normalised using the same factor 40
.
scanrm for all profiles. This operation, which is needed if one intends to perform successive data processing such as migration, corrects un-equal sampling caused by variations in towing speed of the radar antenna.
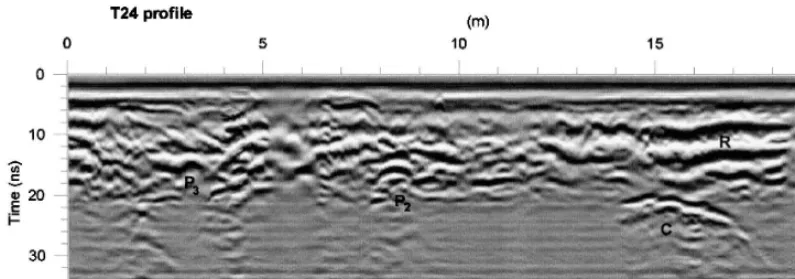
A preliminary inspection of the radar sections relative to the entire survey area, revealed sev-eral latsev-eral variations between zones charac-terised by numerous chaotic reflections and zones where the signal was highly attenuated, with the presence of very weak reflection sur-faces. Unfortunately, the last case was the most frequent in the area of the ‘‘Caserma’’. Most of the observed anomalies range from 5 to 20 ns
Ž
and only exceptionally up to 35 ns Figs. 4–7, relative to profiles L13b, L10, L16a, and T24,
.
respectively . For this reason, all the radar sec-tions in this paper are displayed up to 40 ns. A general character of the survey area is the low
Ž
penetration depth about 0.6 m using the mean
.
velocity value of 0.06 mrns, as later explained , which may be due to the physical characteristics of ‘‘Pietra Leccese’’. As stated in the introduc-tion, the city of Lecce is built on a very shallow, wet, highly homogeneous, calcarenitic base-ment, outcropping in numerous peripheral area; this material greatly dissipates the
electromag-Ž
netic energy. A low penetration depth about 1
.
m was also observed on the radar sections acquired with 100 MHz antenna. The fact that the penetration depth is almost independent of the frequency of antennae used is pointed out by
Ž .
Conyers and Goodman 1997 for soils having the same characteristics as ‘‘Pietra Leccese’’. Hence, the top of the zones where the radar signals are strongly attenuated can be roughly associated with the top of the ‘‘Pietra Leccese’’ basement.
Ž
Many anomalies as those labeled W in Figs.
.
correspon-Ž .
Fig. 4. Horizontal normalized radar section 500 MHz antenna . Note the attenuation zones between 7 and 20 m and between
Ž .
27 and 35 m. Generally weak anomalies W were found in correspondence of ancient walls mapped in Fig. 2. P is a4
hyperbolic anomaly associated to a buried pipe.
dence with the presumed position of the
Ž .
‘‘Caserma’’ walls in the map Fig. 2 . More-over, a great number of anomalies was also found outside the area presumably occupied by the building. Ground evidence and the analysis of the shape and alignment of the anomalies
Ž
suggested that some of them such as those
.
labelled P in Figs. 4–7 were related to the presence of public utilities, a disturbing ele-ment, which could cause interpretation pitfalls.
Ž .
Anomalies of this type P are clearly visible in Fig. 5, in the first part of the profile L10 just outside the boundary of the ‘‘Caserma’’. This boundary is located approximately in correspon-dence with the chaotic anomalies between 11 and 17 m present in the same radar section.
Numerous anomalies, found both inside and outside the area of the ‘‘Caserma’’, however, remained of unknown origin and would require a more detailed investigation. It is worth noting that in the archaeological trenches E1 and E2
ŽFig. 2 , not only walls related to the ‘‘Caserma’’.
but also other masonry features, such as walls or portion of steps, not reported in the existing
Ž .
map Fig. 2 were found. Probably, this map is incomplete and does not correspond to the ac-tual planimetry of the archaeological targets in the subsurface.
The most interesting anomalies were found along both sets of orthogonal profiles carried
Ž .
out in area B Fig. 3 . On the radar sections, they appeared as half-hyperbola or asymmetric
Ž . Ž . Ž
Fig. 5. Horizontal normalized radar section 500 MHz antenna . Pipe anomalies P and a chaotic reflection zone between
.
Ž .
Fig. 6. Horizontal normalized radar section 500 MHz antenna . P and W indicate a pipe and a wall anomaly, respectively;4 C the curved anomaly associated to the barrel vault of an underground stone-filled cavity and R near-horizontal reflections due to different layers of reworked sediments. EW and PP are in correspondence to a stone wall and a couple of iron pipes revealed by the excavation.
Ž .
hyperbola C in Figs. 6 and 7 , of almost the
Ž .
same horizontal extent 4–5 m in both direc-tions, between 22 and 30 ns. They are overlaid
Ž
by strong near-horizontal reflections R in Figs.
.
6 and 7 partially interfering with narrower hyperbolas. Comparing the different shapes of
Ž .
the curved anomaly C in the radar sections, it was argued that the structure responsible for that anomaly had a cylindrical top with axis oriented in an oblique direction with respect to the profiles. To verify this hypothesis, four
Ž .
shorter profiles Q1, Q2, Q3 and Q4 in Fig. 3 , centred at the same point, at 458 from each
other, were run. While in the radar sections
Ž
relative to Q1 and Q2 profiles Fig. 8a and b,
.
respectively , the anomaly showed the above-mentioned asymmetric shape, in that relative to
Ž .
Q3 profile Fig. 8c it looked like an almost perfectly symmetrical hyperbola, and like a near-horizontal anomaly in that relative to Q4
ŽFig. 8d . On the other hand, the absence of.
multiple reflections below the anomaly induced us to exclude that the structure could be empty. In order to locate the buried structure in
Ž .
depth, moreover, a Common Mid-Point CMP gather, centred at the same point of the four
Ž .
Ž .
Fig. 8. Example of the different anomaly patterns of a barrel vault on GPR sections recorded using a 500 MHz antenna
Ž . Ž . Ž .
along profiles oriented at 458from each other: Q1 running S–N a , Q2 running W–E b , Q3 running SE–NW c , Q4
Ž .
running SW–NE d ; and a sketch of the extension of the vault deduced by the analysis of radar sections compared with the
Ž .
profiles, was made using the two 100 MHz
Ž .
antennae the only couple available to obtain a velocity estimate of the radar pulse in the ground. Antennae were moved symmetrically in 0.2 m steps from an offset of 0.6 m to a maximum offset of 6.4 m. The time window was fixed at 100 ns. A Wide-Angle Reflection
Ž .
and Refraction WARR profile was also carried out along the same line. Using the direct ground wave, a mean near-surface velocity of 0.06 mrns was estimated from both methods. Using this value, the shallower part of the presumed vault was at 0.66 m below the ground surface. The location of this anomalous zone and its presumed depth was pointed out to the archaeol-ogists for excavating.
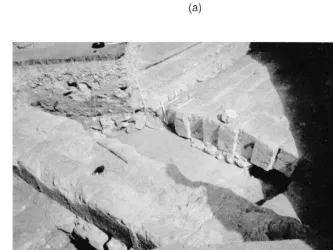
3.3. ExcaÕation results
Excavation results confirmed the hypothesis made on the basis of the radar data, as can be seen in Fig. 8e, where the plan view of the archaeological excavation E3 and the main structures discovered is sketched together with the position of the four radar profiles. Indeed, excavation brought to light part of a SW–NE
Ž
oriented barrel vault depth of the apex 0.65 m
.
from ground surface made of squared carenitic blocks standing directly on the cal-carenitic basement, whose average depth in the excavation is 0.90 m. Above the vault, several horizontal layers of different materials, some of which containing irregular big boulders, were
Ž .
found Fig. 9a . Boulders of sizes near the signal wavelength of the radar wavelength in
Ž .
ground f0.12 m are responsible for the diffraction hyperbolas observed on the radar
Ž .
sections Fig. 8 . Through a small opening, under the top of the vault, it was seen that the cavity is now almost entirely filled with irregu-lar stones and debris.
Other archaeological features, uncovered dur-ing excavation, did not reveal such evident anomalies on radar sections. In Fig. 9b, the
Ž
excavated stone-wall, width: 0.60 m, thickness: 0.60 m, depth of the top: 0.30 m, distance from
the barrel vault: 1 m; labelled EW in the radar
.
sections shown in Figs. 6–8 , made by regular
Ž .
‘‘Pietra Leccese’’ blocks 0.60=0.25 m in the upper section and by irregular ‘‘Pietra Leccese’’ stones in the lower part is visible. It corresponds to zones characterised by weaker signals than the adjacent zones on radar sections and there-fore was not identified in the preliminary analy-sis because the weak anomaly associated with it is confused with the strong continuous reflec-tions generated by the material in which it is immersed. Unlike the most frequent cases of
Ž
stone-wall anomalies in literature Vaughan,
.
1986; Sternberg and McGill, 1995 , where the hosting material is characterised by weaker sig-nals than that propagated in the wall, when the opposite situation occurs, it is extremely diffi-cult, if not impossible, to identify the relative anomaly. The excavation also revealed, in the
Ž .
N–W corner Fig. 9a and b , a couple of iron pipes, of diameter 0.03 m, at depth of f0.40 m from the ground level. The anomaly associated with the pipes corresponds to the clearest
hyper-Ž .
bola PP in Figs. 6 and 8 intersecting the horizontal reflections R, that was initially inter-preted as also being boulders.
3.4. Data processing andÕisualization
2D and 3D data representations play an im-portant role in archaeological investigations since they furnish a synthetic view of the loca-tion and sizes of the most important anomalies in the area. In particular, the realization of horizontal slices enables one to compare ampli-tude anomalies occurring at fixed intervals in time. If the survey area is flat and the propaga-tion velocity does not have significant lateral andror depth variations, the anomalies shown in a horizontal slice may roughly correspond to particular remnants, of sizes comparable to the resolution allowed by the survey and brought to light during an archaeological excavation at a
Ž .
Ž .
Fig. 9. Photos of the excavation results. a SW–NE oriented barrel vault made of squared calcarenitic blocks whose apex is
Ž .
at about 0.65 m below ground level, overlaid by several horizontal layers of different materials. b Thick stone wall SE–NW oriented 1 m distant from the barrel vault and, in the left corner, a couple of iron pipes.
since the joint interpretation can concentrate on simple geometrical occurrences related to the structures being sought.
In order to prepare data for time slices, radar sections were processed using a commercial
Ž
Fig. 10. Migrated radar section obtained applying Kirchhoff migration to the section from T24 profile shown in Fig. 7, and
Ž .
using a mean velocity value of 0.06 mrns a scale function was applied to improve the image quality . The labels have the same meaning as in Fig. 7.
. Ž
and Levin, 1990 , Seismic Unix-SU Cohen and
.
Stockwell, 1997 and routines developed by the
Ž .
authors in MATLAB The Math Works, 1999 . Radar sections, previously normalized along the
Ž
horizontal direction, were migrated RADAN 3
.
Kirchhoff migration using the obtained mean
Ž .
velocity value 0.06 mrns to collapse small diffraction hyperbolas and to reduce the lateral branches of the larger hyperbolas due to the finite horizontal extent of the causative bodies. In Fig. 10, an example of 2D migration applied
Ž .
to T24 profile Fig. 7 is shown. This migrated section clearly highlights, in correspondence with the pipes and the barrel vault, strong re-flections, whose extension is close to their real sizes. Despite the large spacing between the
Ž .
lines 1 m , a trial of 3D migration, by means of
Ž
a two-pass approach as described in Yilmaz,
.
1987 , was also made on a subset of the W–E profiles in area B, centred on the barrel vault, using the above mentioned constant velocity value. A close similarity was observed between the 2D and 3D migrated sections. Indeed, due to
the large crossline spacing, 3D migration mainly summed energy in inline direction and only little energy in crossline one. This fact sug-gested that it was possible to avoid such a time-consuming technique, so 2D migrated sec-tion was used to produce time slice maps.
Time slices are obtained by building 2D am-plitude maps of the radar signals using a speci-fied time window across parallel radar profiles. Data need to be averaged in horizontal and in vertical directions in order to obtain useful in-formation. In fact, simply cutting horizontally through the nth data sample level across a parallel profile dataset produces time slices that are usually noisy, even in the case when the data themselves are not particularly noisy
ŽGoodman et al., 1994; Conyers and Goodman,
.
1997 . A proper time window needs to be cho-sen so as to average at least one pulse width in order to avoid noise due to small variations in the transmitted pulse. Selecting different
win-Ž
dows, longer than one pulse width which for a 500 MHz antenna is approximately equal to 2
Ž .
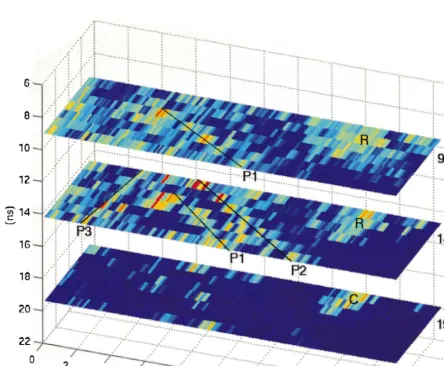
Fig. 11. Time slices obtained from W–E profiles relative to area B in Fig. 2 . Interpolated data. Grid cell sizes: 0.25=0.25 m. R represents anomalies related to different layers of reworked sediments; C for anomalies related to the top and the flanks of a barrel vault cavity; P and P for anomalies related to two parallel pipes running SE–NW, and P for anomalies related1 2 3
.
ns , may reveal features having different verti-cal extents.
Taking into account the above considerations, data were stacked in the horizontal direction
Žalong the profile so as to obtain one averaged.
trace every 0.1 m. This operation makes it possible to reduce random noise present in the data. Subsequently, the horizontally stacked sec-tions were also stacked along the time axis,
Ž
using a 5 ns time window f0.15 m depth
.
window . Stacking-in time was realised using the square amplitude of the radar traces in order
to obtain a mean intensity of the signal in each time window.
The entire stacking procedure was applied to the set of parallel profiles W–E oriented in the
Ž .
area B Fig. 3 in the range of 4–29 ns corre-sponding to the useful signal. In this way, a 3D data matrix of 208=8=5 elements was ob-tained, with cell sizes of 0.1, 1 and about 0.15 m in X, Y and Z directions, respectively. To reduce the differences in sampling interval along
X and Y directions in each time slice, the data
Ž
were interpolated and gridded every 0.25=
. Ž
0.25 m by weighing through the inverse of the
.
squared distance surrounding points in a search radius of62 m, using Application Visualization
Ž . Ž .
System 1992 AVS package. This grid size was chosen as a reasonable compromise in or-der to avoid a great amount of averaging in the
Ž . Ž
densely sampled X inline direction which
.
could cause a remarkable loss of resolution and a great amount of interpolation in the coarsely
Ž . Ž
sampled Y crossline direction which could
.
introduce computing artifacts . The slices ob-tained are presented in Fig. 11. The color scale
Ž .
adopted ranges from dark blue low amplitude
Ž .
to red high amplitude .
In the eastern part of the 19–24 ns time slice
Žcorresponding to 0.57–0.82 m below ground
.
level the SW–NE elongation of the top of the
Ž .
anomaly due to the vault of the cavity C is evident, while in the next 24–29 ns slice, two anomalies due to the flanks of the structure are evident. In the three upper slices the complexity of anomaly patterns generally characterizing the shallower half meter of soil is visible. The
Ž .
eastern anomalies R , just above the vault anomaly, were interpreted as due to interfaces between different layers of reworked materials
Žsee Figs. 6, 7 and 9 . Three straight align-Ž ..
ments of anomalies: two running approximately
Ž .
SE–NW P and P1 2 and one running
approxi-Ž .
mately S–N P3 are visible on the slices 9–14 and 14–19 ns. They showed the characteristic hyperbola shape in the original radar sections
ŽFig. 7. and appeared as ‘‘bright spots’’ of
Ž
different lateral sizes in the migrated ones Fig.
. Ž .
10 . The most superficial P , clearly visible in1
Ž
the 9–14 ns time slice and to a lesser degree in
.
the next slice , ends in correspondence with an
Ž
intense anomaly probably due to a reworked pit
.
around a metallic manhole cover , and was in-terpreted as a large pipe buried about 0.30 m below ground. The alignments P and P , corre-2 3 sponding to smaller hyperbolas in the radar
Ž .
sections as P and P in Fig. 7 , were inter-2 3 preted as smaller pipes buried at an estimated depth of about 0.45 m. However, the horizontal extent of P and P appear greater than they are1 2 in reality because they are crossed at an oblique angle by the profiles, while that of P is closer3 to the real size since it is traversed almost perpendicularly. Certainly, the continuity of the
Ž .
imaged events such as pipes would be en-hanced in collecting data in more closely spaced profiles.
To ensure that no artifacts were produced by the interpolation procedure, the most
representa-Ž .
tive time slices 9–14, 14–19 and 19–24 ns are displayed in Fig. 12 using data without interpo-lation. This figure shows a rough representation of the same features present in Fig. 11. A 3D plot of the barrel-vault anomalies was obtained, combining the migrated data from the
orthogo-Ž .
nal profiles Q3 and Q4 Fig. 13 .
To facilitate identification of anomalies due to potential archaeological features having cer-tain presumed alignments, such as walls, and to help to distinguish them from other anomalies, the same time slice procedure was applied to the set of S–N, 1 m distant, parallel profiles for the
Ž .
entire area A Fig. 3 . Five slices from 4 to 29 ns were computed. The most interesting slice
Ž9–14 ns corresponding to f0.30 m below .
ground surface is shown in Fig. 14. Some features that have already been discussed in the
Ž
corresponding slice of Fig. 11 obtained from an
.
orthogonal set of profiles are also evident in
Ž .
this slice P and R . The two quite similar1 anomalies R and RXare found in correspondence to the extreme south–western rooms of the ‘‘Caserma’’ and are both interpreted as due to reworked layers. Another almost straight
align-Ž . X
ment of anomalies P , beginning near R and4 running SW–NE, is confirmed by asphalt dif-ferences to be related to another pipe probably installed after the destruction of the ‘‘Caserma’’ and intersecting some of the buried walls of the building.
A remarkable result is that the most intense anomalies were found mainly outside the ‘‘Caserma’’ and in correspondence to its main entrance, where there is greater probability of human activities, whereas few anomalies of weaker intensities were found in correspon-dence to some walls of the building. The diffi-culty in obtaining clear anomalies in correspon-dence to the walls is probably due to the ‘‘Pietra Leccese’’ stones used to build them, as shown in paragraph 3.4 by analyzing the anomalies caused by the excavated wall.
4. Conclusions
In this paper the power and the limitations of the GPR technique for archaeological inves-tigations in an urban area are examined. The presence of an extremely superficial, wet and calcarenitic basement, responsible for the low
Ž
penetration depth not exceeding 1 m also using
.
a 100 MHz antenna prevented the exploration of deeper structures; but at the same time, the characteristic low amplitude of the signal propa-gated in them made it possible to identify the top of this basement. The quite similar physical characteristics of the basement and the walls of
Ž . Ž . X
Fig. 14. Time slice 9–14 ns obtained from S–N profiles relative to area A in Fig. 2 . R and R represent anomalies related to different layers of reworked sediments, P for anomalies related to a SE–NW oriented pipe, and P for anomalies related1 4
the historical building prevented unambiguous identification of the latter. A surprising result of the excavation, in fact, was the discovery of a thick wall built in ‘‘Pietra Leccese’’ stone which caused weak anomalies that were very difficult to recognize on the radar sections.
GPR survey, however, with data recorded along parallel profiles, 1 m spaced, and visual-ized through time slice representation, success-fully located, at about 0.65 m from ground surface, an unexpected barrel-vault cavity near a wall of the historical building and urban utilities buried in the area in the first half meter of soil. In particular, it made it possible to identify and reconstruct the shape, depth and extension of this barrel-vault cavity, subsequently confirmed by archaeological excavations. Fig. 8 represents a good didactic example of the different anomaly patterns of such man-made cylindrical structures on GPR sections recorded along profiles ori-ented at different azimuth.
The comparison between the observed anomalies on the radar sections and the struc-tures responsible, confirms the need for archae-ological excavations for the calibration of geo-physical methods in complex environments such as archaeological sites in urban areas.
Acknowledgements
The authors wish to thank the technicians, S. Corriero, T. Margiotta, and M. Luggeri, for their precious collaboration during data acquisi-tion and Dr. Rosella Cataldo for her construc-tive suggestions in software implementation. The authors are also grateful to Dr. Janice Beccaria for revising the English form of the manuscript and to the reviewers and editor for their valu-able comments and remarks.
References
Ž .
Application Visualization System AVS . Advanced Visual
Ž .
Systems, Release 4 May .
Bevan, B.W., 1991. The search for graves. Geophysics 56, 1310–1319.
Cappello, A., Palasciano, R., Rizzo, F., 1981. Valore e Significato di un’area Indagine sulla Caserma O. Massa. Edizioni Milella, Lecce.
Cohen, J.K., Stockwell, J.W. Jr., 1997. CWPrSU: Seismic Unix Release 30: A Free Package for Seismic Research and Processing. Center for Wave Phenomena, Colorado School of Mines.
Conyers, L.B., 1996. The use of ground penetrating radar to map the archaeology and paleogeography of the Ceren Site, El Salvador. In: Proceedings of the 6th International Conference on Ground Penetrating Radar
ŽGPR ’96 , September 30–October 3, Sendai, Japan..
pp. 89–94.
Conyers, L.B., Goodman, D., 1997. Ground-Penetrating Radar — An Introduction for Archaeologists. Alta Mira Press, A division of Sage Publications.
Galinovsky, L., Levin, K., 1990. RADAN 3.0. Geophysi-cal Survey Systems, North Salem, NH.
Goodman, D., Nishimura, Y., Tobita, K., 1994. GPRSIM forward modeling software and time slices in ground penetrating radar surveys. In: Proceedings of the Fifth International Conference on Ground Penetrating Radar
ŽGPR ’94 , June 12–16, 1994, Kitchener, Ontario,.
Canada. pp. 31–43.
Imai, T., Sakayama, T., Kanemori, T., 1987. Use of ground penetrating radar and resistivity surveys for archaeolog-ical investigations. Geophysics 52, 137–150.
Mellett, J.S., 1992. Location of human remains with ground-penetrating radar. In: Fourth International Con-ference on Ground Penetrating Radar, June 8–13, 1992, Rovaniemi, Finland. Geological Survey of Finland Spe-cial Paper 16pp. 359–365.
Sternberg, B.K., McGill, J.W., 1995. Archaeology studies in southern Arizona using ground penetrating radar. Journal of Applied Geophysics 33, 209–225.
The Math Works, 1999. MATLAB Version 5.3.0. . Tohge, M., Karube, F., Kobayashi, M., Tanaka, A., Ishii,
K., 1998. The use of ground penetrating radar to map an ancient village buried by volcanic eruptions. Journal of Applied Geophysics 40, 49–58.
Unterberger, R.R., 1992. Ground penetrating radar finds disturbed earth over burials. In: Fourth International Conference on Ground Penetrating Radar, June 8–13, 1992 Rovaniemi, Finland. Geological Survey of Fin-land Special Paper 16pp. 351–357.
Vaughan, C.J., 1986. Ground-penetrating radar surveys used in archaeological investigations. Geophysics 51, 595–604.