Ž .
Energy Economics 22 2000 383]394
Decomposition of industrial CO emissions:
2The case of European Union
K. Liaskas, G. Mavrotas, M. Mandaraka, D. Diakoulaki
UDepartment of Chemical Engineering, Laboratory of Industrial and Energy Economics, National Technical Uni¨ersity of Athens, Athens, Greece
Abstract
This paper aims at identifying the factors that have influenced changes in the level of industrial CO emissions. By means of an algebraic decomposition method the observed2
changes are analyzed into four different factors: output level, energy intensity, fuel mix and structural change. The application study refers to the industrial sector of European Union countries. The results show that CO emissions are possible to decrease without negatively2
affecting economic growth. In this sense, they confirm the decoupling of economic growth from energy consumption realized in the developed countries and prove that this detach-ment holds true also for the atmospheric emissions associated with energy use. Q 2000
Elsevier Science B.V. All rights reserved.
JEL classification:Q40
Keywords:CO emissions; Decomposition; European Union2
1. Introduction
In recent years, decomposition analysis has been extensively used in an attempt to explain the mechanisms influencing energy consumption. The aim was to disentangle distinct components behind historical energy consumption data in order to identify the factors that may have caused the observed changes.
Further-U
Corresponding author. 9, Heroon Polytechniou, Zografou Campus, Athens GR-157 80, Greece. Tel.:q30-1-772-32-57r772-32-00-1; fax:q30-1-772-31-55.
0140-9883r00r$ - see front matterQ2000 Elsevier Science B.V. All rights reserved.
Ž .
more, the obtained results assist in estimating future trends and in designing suitable policies to decouple economic growth from energy use. The most widely applied decomposition techniques can be broadly classified into two categories:
Ž .a Techniques based on input]output analysis which are capable of identifying
the impact on energy consumption of technological changes and structural shifts in Ž
the macro-economic context Park, 1982; Gowdy and Miller, 1987; Han and .
Lakshmanan, 1994 . Despite their simplifying assumptions, input]output based
techniques have a sound theoretical background and provide a thorough insight into the relationships between energy use and macroeconomic variables. Their main drawback is that they do not allow for cross-national comparisons since
input]output tables of different countries are hardly comparable to each other.
Ž .b Disaggregation techniques based either on simple algebraic methods such as
Ž . Ž .
those proposed by Hankinson and Rhys 1983 , and by Park 1992 , or on indices,
Ž .
such as the Divisia approach Boyd et al., 1988; Li et al., 1990 or the Laspeyres
Ž .
approach Howarth et al., 1991 . Although much less sophisticated than the
input]output based techniques and failing to examine important macroeconomic
parameters, disaggregation methods achieved to identify the most crucial factors that may have influenced changes in energy consumption. Furthermore, due to their simplicity, data collection and computational effort do not set any serious problems, while they enable comparisons across nations.
Disaggregation techniques have been primarily applied to the manufacturing sector due to its prominent contribution on both the economic development and the final energy consumption of countries. In addition, industry is by nature more sensitive to energy prices and more open to technical change. In all relevant studies the decomposition analysis has focused on three different factors affecting
Ž . Ž .
changes in energy consumption. These refer to: a total production output; b Ž . structural changes referring to shifts across different industrial sectors; and c energy intensity, which is assumed to reflect both price changes and investments on energy saving technologies. In addition, most of these methods are able to identify the combined effect of all three factors. In spite of the expected differences, which are due to the different methodologies, time periods, countries and industrial branches examined, all studies converge to some common key findings. As
illus-Ž ..
trated in the cross-country comparison work of Park 1993 , developed countries have to a large extent achieved the decoupling of industrial production and energy use, while improved energy intensity and shifts to less energy intensive sectors seem to be the main factors explaining changes in energy consumption. On the contrary, with few exceptions, the traditional link between industrial production and energy consumption is still present in less developed economies.
( )
K. Liaskas et al.rEnergy Economics 22 2000 383]394 385
and the new question raised is how one can achieve the separation of greenhouse gases emissions from both economic growth and energy consumption.
As a response to the new policy needs, decomposition analysis has been ex-tended in order to identify the factors influencing changes in greenhouse gases
Ž .
emissions and in particular in carbon dioxide CO2 which is the major contributor
to the greenhouse effect. In the literature there are mostly applications of
input]output based techniques which have been modified by including the
emis-Ž sion factors associated to the different energy flows through the economy Casler
. Ž .
and Rose, 1998; Chang and Lin, 1998 . In addition, Greening et al. 1998 have
used the Divisia approach in a cross-national comparison of manufacturing CO2
emissions in 10 OECD countries.
The purpose of this paper is to make such an extension to the algebraic Ž .
disaggregation method proposed by Park 1992 and to proceed to a cross-national
comparison of the factors that have influenced CO emissions generated in the2
Ž .
industrial sector of European Union EU countries. The analytical procedure
followed is analytically described in Section 2. Data on CO emissions for the time2
periods 1973]1983 and 1983]1993 are given and the obtained results are presented
and discussed. Some concluding remarks are included in Section 4.
2. Decomposition method
The approach applied for decomposing changes in industrial carbon dioxide emissions into distinct effects of specific factors relies on a series of simple algebraic calculations derived from Park’s method and uses as much as possible the same symbols. For each country the following input data are used:
Etstotal industrial energy consumption in period t;
Ž .
Ptstotal industrial output in constant prices manufacturing value-added in
period t;
Ei tsith industrial branch energy consumption in period t; and
Pi tsith industrial branch output in constant prices in period t.
From the above definition it results that:
m
with msthe number of industrial branches.
Energy consumption is translated into CO emissions by taking into account the2
F
Ctstotal industrial CO emissions in physical units in period2 t;
efjsthe emission factor of fuel j;
stjsthe share of fuel jin total industrial energy consumption in period t;
Ci tsith industrial branch CO emissions in physical units in period2 t;
sj
sthe share of fuel jin ith industrial branch’s energy consumption in period
i t
t; and
Fsthe number of different fuels.
The energy intensity and the CO emission intensity of2 ith branch at period t
are defined as follows:
A change in the total industrial emissions of CO between a base period2 ts0
Ž .
( )
K. Liaskas et al.rEnergy Economics 22 2000 383]394 387
m F m F
j j j j Ž .
DCsP ?
Ý
a ?e ?Ý
ef ?s yP ?Ý
a ?e ?Ý
ef ?s 11n i n i n i n 0 i0 i0 i0
is1 js1 is1 js1
It can be seen from the last equation that the change in total CO emissions is a2
Ž .
function of four variables: The total output Pt , the share of each branch to the
Ž . Ž . Ž j.
total output a , the energy intensity e and the fuel share s in each
i t i t i t
industrial branch. The emission factors are taken as constants because they do not change with time.
Ž .
Applying the total differential formula, Eq. 11 can be decomposed as follows:
m F
Residuals are then divided into 11 combinatorial product terms of the four variables where each term represents the joint effect of two variables. For example the term which expresses the joint effect of change in output and change in energy intensity is the following:
Under the ceteris paribus condition all variables remain unchanged except of
. Ž .
one each time each term of Eq. 12 expresses the change in CO emissions2
attributed on the specific variable given that there is no change in the rest of the variables
3. Application study
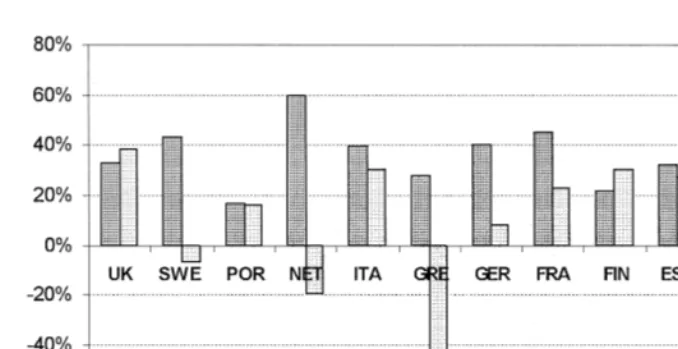
consider-Fig. 1. Change in industrial CO emissions.2
ably reduced. At the same time, efforts for the diversification of the energy mix and shifts towards domestically produced fuels have taken place in order to reduce the dependence of EU economics on oil. These changes have also influenced the level and composition of energy consumption in the industrial sector. Nevertheless, it is not clear at what extent the reduction of energy intensities has assisted in
controlling CO emissions and if this positive effect was augmented or counter-2
balanced by changes of other parameters, such as structural changes, fuel mix and production output.
Ž
The performed analysis refers to the time period 1973]1993 divided in two
.
subintervals and includes 13 countries of the EU. Ireland was excluded because of missing data while Luxembourg is a particular case with one industrial sector dominating its whole energy system. The data for fuel consumption are taken from
Ž .
OECD Energy Balances OECD, 1994 , the output data from OECD’s STAN
Ž .
database OECD, 1995 , while the emission factors are taken from EUROSTAT. As shown in Fig. 1, with the exception of Greece and Portugal, in all other EU
countries CO emissions have considerably decreased during the period 1973]1983.
2
In the next decade the rates of decrease diminish and in many countries CO2
emissions tend to stabilize or even to slightly increase.
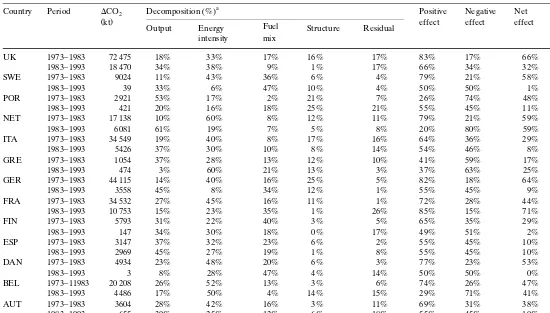
The application of the proposed decomposition method gives the results pre-sented in Table 1. The positive or negative contribution of each factor is expressed on a percentage basis, while the last three columns give the sum of all positive and negative effects and the corresponding net effect.
It is clear that the higher the net effect the more significant the reduction in
()
Results of the decomposition method
a
Ž .
Country Period DCO2 Decomposition % Positive Negative Net
Ž .kt Fuel effect effect effect
Output Energy Structure Residual
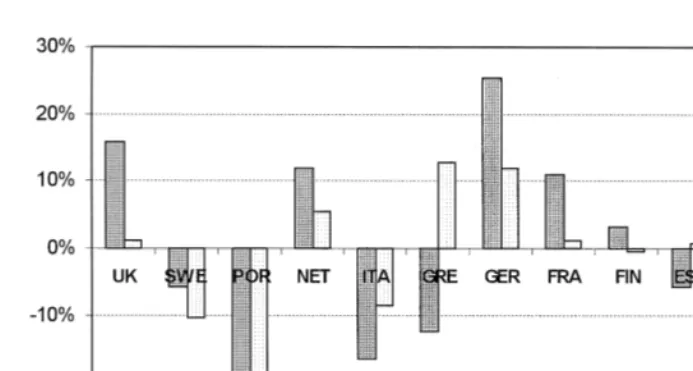
Fig. 2. Energy intensity effect on the reduction of industrial CO emissions.2
trends observed in Fig. 1 presenting the changes of CO emissions over time. With2
the exception of France, which shows an increase of the net effect value in the second time interval, in all other EU countries the sum of factors having a
beneficial influence on the reduction of CO emissions diminishes. Respectively,2
the relative contribution of adverse factors increases.
For facilitating a comparative evaluation between countries as regards the
relative impact of each separate factor Figs. 2]5 are constructed. Fig. 2 shows the
contribution of the energy intensity effect on the reduction of CO emissions. It2
can be seen that during the period 1973]1983 all the examined countries have
achieved to decrease their industrial energy intensity and this improvement is
found to be the most important factor that led to the reduction of CO emissions.2
In most of the examined countries the value calculated for the energy intensity effect is equal or higher than 40%, while Finland and Portugal present the lowest values. In the next decade, the relative impact of the energy intensity effect has
Ž
decreased and in some countries Belgium, Netherlands, Sweden, Greece and .
Denmark becomes negative, meaning that industrial energy intensity has in-creased in these countries.
The other factor explaining the reduction of CO emissions is the change in the2
fuel mix. Fig. 3 shows that fuel substitutions in the industrial sector have
benefi-cially influenced the reduction of CO emissions and that in most countries this2
effect becomes more important in the second time period under consideration. This is because of the growing environmental concern, which during the 1980s resulted in increased shares of cleaner fuels, especially of natural gas. The only exception is Belgium where the shift towards coal had a small but negative impact
( )
K. Liaskas et al.rEnergy Economics 22 2000 383]394 391
Fig. 3. Fuel mix effect on the reduction of industrial CO emissions.2
The beneficial impact of changes in energy intensity and fuel mix has been to a large extent offset by the output effect. Fig. 4 shows that, in almost all countries,
the increase of the industrial output has a negative effect on CO emissions.2
Moreover, this negative impact has increased in the 1980s, when the European industry has overcome the problems caused by the energy and economic crisis.
Fig. 5. Structural effect on the reduction of industrial CO emissions.2
Only in United Kingdom in the first time period, the decline of CO emissions was2
owed to some extent to the decrease of the industrial output. Greece shows also in the 1980s a low but positive value of the output effect.
Things are more complicated in the case of structural effects. As shown in Fig. 5 no clear trend is discernible in the values assigned to this factor. There are
Ž .
countries Germany, Belgium, Netherlands, Denmark, UK and France where
changes in the sectoral mix have positively influenced CO emissions, although in2
the two last countries this impact tends to disappear in the second time period. In
Ž .
other countries Portugal, Sweden, Italy, Austria the structural effect is negative Ž over the whole examined period, while in the rest it is either negligible as in
.
Finland or turns from positive to negative values or vice-versa. Nevertheless, in all cases the calculated values vary at relatively low levels indicating that structural
effects have not had a significant influence on the changes of CO emissions in EU2
countries. The same remarks hold true for the interaction terms, which present both positive and negative values varying mostly at low levels.
4. Conclusions
The decomposition analysis presented in this paper leads to some interesting
conclusions about the factors that have in the past influenced changes in CO2
emissions from the manufacturing sector. It has been found that the decoupling between energy consumption and industrial output ascertained by other studies to
hold for the developed countries is translated also in a decoupling from CO2
( )
K. Liaskas et al.rEnergy Economics 22 2000 383]394 393
developed EU countries such as Greece and Portugal, CO2 emissions from
manufacturing have been reduced or stabilized despite the continuous growth of
the industrial production. The results show that the decline of CO emissions2
observed in most EU countries during the 1970s was primarily a side-effect of the measures promoted after the energy crisis for decreasing energy intensities. It is worth noticing that with the fall of energy prices after the second oil crisis, the relative importance of the energy intensity effect tends to decrease since efforts to save energy have been relaxed. Another factor that is increasingly contributing to
the reduction of CO emissions was the change in the energy mix. Fuel shifts were2
aiming not only to reduce dependence on oil but also to cope with the adverse environmental effects of energy use. The most important change in fuel mix that has taken place in the EUs industrial sector is the rapid penetration of natural gas,
which has the lowest CO emission factors compared to all other conventional2
fuels. Nevertheless, it can be stated that as further improvements in energy
efficiency in developed countries become more difficult, efforts to reduce CO2
emissions will be predominantly directed towards the use of clean energy forms and especially towards the deployment of renewable energies.
It should be noted that there is no clear evidence that restructuring of the manufacturing sector in EU countries has positively influenced the abatement of
CO emissions. Although in previous studies, shifts towards less energy-intensive2
sectors in developed countries are found to have positively influenced the observed
decrease in industrial energy consumption, a similar influence on CO emissions is2
not clearly discernible in all EU countries. Moreover, in some countries sectoral shifts seem to be inversely correlated with the emissions level. However, the type of interactions between structural change and the global warming effect necessitates a deeper analysis, which is beyond the scope of this paper.
References
Boyd, G., Hanson, D., Sterner, T., 1988. Decomposition of changes in energy intensity: a comparison of the Divisia index and other methods. Energy Econ. 10, 309]312.
Casler, S.D., Rose, A., 1998. Carbon dioxide emissions in the US Economy: a structural decomposition
Ž .
analysis. Environ. Resour. Econ. 11 3-4 , 349]363.
Chang, Y.F., Lin, S.J., 1998. Structural decomposition of industrial CO2 emission in Taiwan: an
Ž .
input]output approach. Energy Pol. 26 1 , 5]12.
Gowdy, J.M., Miller, J.L., 1987. Technological and demand change in energy use: an input]output analysis. Environ. Plan. 19, 1387]1398.
Greening, L.A., Davis, W.B., Schipper, L., 1998. Decomposition of aggregate carbon intensity for the manufacturing sector: comparison of declining trends from 10 OECD countries for the period 1971]1991. Energy Econ. 20, 43]65.
Han, , Lakshmanan, T.K., 1994. Structural changes and energy consumption in the Japanese economy 1975]85: an input]output analysis. Energy J. 15, 165]188.
Hankinson, G.A., Rhys, J.M.W., 1983. Electricity consumption, electricity intensity and industrial structure. Energy Econ. 5, 146]152.
Li, J.-W., Shrestra, R.M., Foell, W.K., 1990. Structural change and energy use: the case of the manufacturing sector in Taiwan. Energy Econ. 12, 109]115.
OECD, 1994. Energy Balances of OECD countries. OECD, Paris.
OECD, 1995. The OECD STAN Database for Industrial Analysis. OECD, Paris.
Park, S.-H., 1982. An input]output framework for analyzing energy consumption. Energy Econ. 4, 105]110.
Park, S.-H., 1992. Decomposition of industrial energy consumption: an alternative method. Energy Econ. 14, 265]270.
Park, S.-H., 1993. A cross-country decomposition analysis of manufacturing energy consumption. Energy
Ž .