An artificial immune system for data analysis
Jon Timmis
a,*, Mark Neal
a, John Hunt
baDepartment of Computer Science,Centre for Intelligent Systems,Uni6ersity of Wales,Aberystwyth,Ceredigion SY23 3DB,UK bJay Dee Technology,PO Box153,Chippenham SN14BTU,UK
Abstract
We present a simplified view of those parts of the human immune system which can be used to provide the basis for a data analysis tool. The motivation for and reasoning behind such a model is given and the desire for a ‘transparent’ model and meaningful visualization and interpretation techniques is noted. A minimalist formulation of an artificial immune system and some of its behaviour is described. A simple implementation and a suitable visualization technique are demonstrated using some trivial data and the famous ‘iris’ data set. © 2000 Elsevier Science Ireland Ltd. All rights reserved.
Keywords: Immune network; Artificial immune system; Unsupervised machine learning; Visualisation; Cluster analysis; Self organising
www.elsevier.com/locate/biosystems
1. Introduction
The human immune system is a complex natu-ral defense mechanism. It has the ability to learn about foreign substances (pathogens) that enter the body and to respond to them by producing antibodies that attack the antigens associated with the pathogen. Ultimately, this removes the infec-tion from the body. The human immune system has provided inspiration for the fields of computer science and engineering (Kepart, 1994; Dasgupta, 1996; Forrest et al., 1996). A detailed survey of this work can be found in Dasgupta (1998).
Previous work has been done on the use of artificial immune systems for learning and has been shown to have great potential in the field of machine learning (Cooke et al., 1995). This work took as its inspiration, the immune network the-ory (Perelson, 1989) and applied it to the field of machine learning using artificial immune net-works as a basis. The work presented here is a consolidation of the work described in Cooke et al. (1995), Hunt et al. (1998), Neal et al. (1998) and defines what is meant by an artificial immune system (AIS), including the fundamental compo-nents and how they interact to exhibit learning. We primarily present the AIS as an unsupervised machine learning method, but also stress its use as an exploratory data analysis and visualization tool.
* Corresponding author.
E-mail addresses: [email protected] (J. Timmis), [email protected] (M. Neal), [email protected] (J. Hunt)
2. The human immune system
The human immune system protects our bodies from infectious agents such as viruses, bacteria. fungi and other parasites. There are two types of immunity, innate and adaptive. Innate immunity is not directed in any way towards specific in-vaders into the body, but against any pathogens that enter the body. It is said to be non specific and is generally not modified by repeated expo-sure. Adaptive immunity is directed against spe-cific invaders and is modified by exposure to such invaders. Thus, it is said to have immunological memory.
Our work is concerned with the latter and the former will be disregarded. The adaptive immune system is made up of lymphocytes which are white blood cells, more specifically B and T cells. These cells aid in the process of recognising and destroy-ing specific substances. Any substance that is ca-pable of generating such a response from the lymphocytes is called an antigen or immunogen. Antigens are not the invading microorganisms themselves; they are substances such as toxins or enzymes in the microorganisms that the immune system considers foreign. Immune responses are normally directed against the antigen that pro-voked them and are said to be antigen-specific.
Immunological memory is the ability of the adaptive immune system to mount a more effec-tive immune response against an antigen after its first encounter, leaving the body better able to resist in the future.
2.1. Primary and secondary response
Primary response is provoked when the im-mune system encounters an antigen for the first time. A large number of antibodies may be pro-duced by the immune system in response to the infection that will help to eliminate the antigen from the body. After the infection has been cleared a number of these antibodies will remain and act as part of the secondary immune re-sponse. These cells that are left effectively remem-ber the antigen that they were designed to attack. This means that the body is prepared for re-infec-tion, should it occur. The secondary response is
characterised by more rapid and more abundant production of the antibody. The secondary re-sponse can be elicited from an antigen that is similar, although not identical, to the original one, which originally established the memory.
There are two theories of how this immunolog-ical memory is achieved. The traditional view is that of virgin B cells being stimulated by an antigen producing memory: cells. These stay be-hind in the system after the infection has gone. A more contentious theory is the immune network theory first proposed by Jerne (Jerne, 1974) and reviewed by Perelson (Perelson, 1989). This theory proposes that a network dynamically maintains the immune memory using feedback mechanisms. Thus, if something has been learnt, it can be ‘forgotten’ unless it is reinforced by other parts of the network. It is this approach that we use to underpin this research.
2.2. Antibody/antigen binding
Antibodies posses two paratopes, which are portions of the antibody that are used to match or identify other molecules. The regions on the molecules that the paratope can attach to are called the epitopes. Identification of the antigen is achieved by complementary matching between the paratope and the epitope, comparable to a lock and a key. The strength of the bind depends on how closely the two match. The closer the match between the antibody and the antigen then the stronger the molecular binding and the better the recognition.
2.3. B Cell stimulation
com-bined with molecules found on the surfaces of the other cells. These molecules are called MHC molecules (major histocompatibility complex). As T cells circulate through the body they scan the surfaces of body cells for the presence of foreign antigens that have been picked up by the NIHC molecules. This function is sometimes called im-mune surveillance. These helper T cells when bound to an antigen secrete interleukins that act on B cells helping to stimulate them. Our initial model of the immune system ignores the effect of T cells.
If the stimulation of a B cell reaches a certain threshold the B cell is transformed into a blast cell. This blast cell begins to divide rapidly pro-ducing clones of itself. To allow the immune system to be adaptive the clones that are pro-duced turn on a mutation mechanism that gener-ates mutations in the genes coding for the antibody molecule; this is called somatic hyper-mutation (Kepler et al., 1993). If however the stimulation level falls below the threshold the B cell will not replicate and in time it will die.
2.4. Immune network influence
As stated above, the stimulation level is also dependent on its affinity with other B cells in the immune network. This network is formed by B cells recognising other B cells in the system. The network self-organises and stabilises since survival is acheived by mutual reinforcement between B-cells via a feedback mechanism. The more neigh-bours that a B cell has, the more stimulation it will receive from the network and vice-versa. Sur-vival of a new B cell. either produced by the bone marrow or by hypermutation, clepends on its affinity to any antigens that are present and to its neighbors in the immune network. The new B cells may have an improved match for an antigen and will thus proliferate and survive longer than existing B cells. By repeating this process of muta-tion and selecmuta-tion a number of times, the immune system learns to produce better matches for the antigen. It is this behaviour upon which we wish to capitalise.
3. The artificial immune system
This section introduces the artificial immune systems (AIS) for data analysis. The following sections detail what is actually required in order to construct an AIS in non data-specific terms. An AIS consists of a set of B cells, links between those B cells (used to support the B cell in the network via its stimulation level) and cloning and mutation operations that are performed on the B cell objects.
In the real immune system, pathogens produce antigens when invading a host. It is these antigens that are matched with the antibodies of the im-mune system. For the sake of simplicity in the AIS separate antigens are not created, the com-plete data items are considered to be representa-tive of antigens rather than entire pathogens.
3.1. AIS population
This AIS consists of a population of B cell objects (T cells are currently ignored). The AIS population is made up of two sub-populations the initial population and the clone population. The initial set is generated from a subset of the raw training data.
3.2. B cell object and stimulation
Each B cell object can represent a data item which is being used for learning and is capable of responding to a stimulus closely matching that data item (analogous to the real immune system where B cells respond to particular antigens). In the natural immune system, the level to which a B cell is stimulated relates both to how well its antibody binds to the antigen and to its affinity (or enmity) to its neighbours in the network (Farmer et al., 1986). The AIS reflects all three of these influences.
ps=(1−pd) (1) The second stimulus for a B cell is the affinity of the particular B cell to the neighbours to which it is connected. This is defined in Eq. (2), wherens
is the amount by which the B cell is stimulated by its neighbors, n is the number of links to the current cell anddisxthe distance of thexth
neigh-bor from the B cell. This is simply the sums of all the affinity values to a particular B Cells n
neighbours.
ns= %
n
x=0
1−disx (2)
As mentioned above, a B cell is not only stimu-lated, but also suppressed by loosely connected neighbours. This is taken into account in the AIS and is defined in Eq. (3). nn is the suppression factor due to its neighbours, wherendxrepresents
the distance of the xth neighbour from the cur-rent B cell (where 05disx51)and the rest are as
Thus the stimulation of a B cell in the AIS is as shown in Eq. (4).slis the stimulation level for the B cell and other expressions are as defined above.
sl=ps+ns+nn51 (4)
Eq. (4) can be re-written and simplified as below:
When a B cell’s stimulation level exceeds a certain threshold then that cell undergoes cloning.
3.3. B cell cloning
In the natural immune system, cloning is ini-tiated by a particular B cell becoming stimulated above a certain threshold. The B cell replicates producing large numbers of B cells and thus antibodies specific to the particular antigen stimu-lating it. Somatic hypermutation (Farmer et al.,
1986) ensures that of the clones produced a rela-tively large proportion will vary in some way from the parent cell. The cells which remain specific to the original invader are retained within the body and contribute to the immunological memory spe-cific to that particular antigen. Those cells which vary in some way from their parent cell allow the immune system to adapt to variations in the antigen (due to for example a mutation in the infecting agent). This allows the immune system to ‘pre-empt’ further infections.
In the same way, the AIS clones and mutates B cells to build up a memory of B cells that can identify similar patterns to the one that caused the cloning. This process allows areas of similarity to emerge as clusters of cells in the network that identify certain types of data pattern. It is impor-tant to note that only those cells which are suffi-ciently closely related to active parts of the network will survive. The clonal rate of a B cell is defined in Eq. (7) below, where k is a scalar constant and sl(x) is as defined in Eq. (4).
ex=k(sl(x)) (7)
The rate at which mutation occurs is fixed throughout the construction of the network. This rate is used probabilistically to decide when a clone should be mutated. So for example a muta-tion rate of 10% means that any individual data field within a clone has a 10% probability of being mutated. Mutation of numerical values is cur-rently carried out by simply replacing the value with a random number.
3.4. Links between B cell objects
The links between nodes in the AIS represent relationships between B cell objects. The link is a record of the affinity between the two B cell objects involved in the link. This affinity is defined to be the Euclidean distance between the two B cells. All data is normalised to ensure that values remain between 0 and 1. This is defined below,
affinity (a,b)=
'
% NDn=1
(a(n)−b(n))2 (8)
A link between two objects is created only if the affinity between the two exceeds the network affinity threshold.
3.5. Network affinity threshold
The network affinity threshold is defined in Eq. (9).If the affinity between two B cells exceeds this value then the two B cells are linked.lirepresents
the affinity associated with the i’th link in the network,Nis the number of linics present and A
is a constant scalar used to control connectivity, where 05A51. li represents the affinity
associ-ated with thei’th link in the network. As learning progresses the NAT will become more stringent requiring matches between B Cells to be higher for a link to be made between them.
NAT=A
!
%iN=0aff(li)"
N (9)
3.6. Building the immune network
To train the AIS, the data set is presented repeateadly to the network (Fig. 2b) and new clones are integrated at each step. Once the AIS has undergone one training cycle, the weakest 5% of the B Cell population are removed from the AIS. This is akin to how the real immune system operates with about 5% of B Cells being replaced each day.
4. Initial experimental results
Preliminary experiments involved the creation of a small 2-dimensional data set in which two distinct clusters of data were easily seen. Fig. 1(a) below shows a simple scatter diagram of the simulated data. This data was presented to the AIS system for two iterations the results of which can be seen in Fig. 1(b) in which it is clear that the network has detected two well separated clus-ters. This experiment was repeated a number of times with consistent results. This is a promising
first step. Real data is however, the best test for a system and to this end the well known ‘Fisher iris data set’. Fisher (1936) was tackled in order to test data of higher dimensionality and with a less obvious structure. The iris data is a widely used benchmark test set in the clustering and machine learning community. The data consists of 150 instances of three different kinds of iris plants. These are Iris Setosa Iris Virginica and the Iris Versicolor. The data has four attributes: sepal length, sepal width, petal length and petal width. Two groups of the groups of plants can not be linearly separated from each other (Iris Virginica and Iris Versicolor), but Iris Setosa is linearly separable from the other two. Thus, it is reason-able to expect two groups to be easy to detect and the separation of the Versicolor and Virginica groups to pose more of a problem.
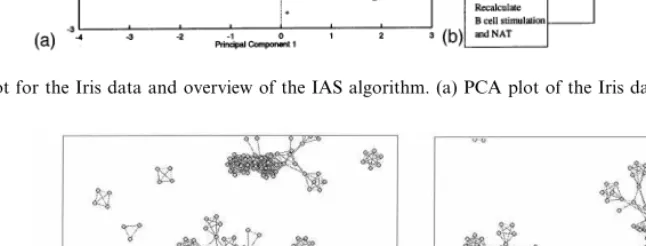
Initially a principal components analysis was performed on the data (Everitt, 1974). PCA makes it possible to represent the data in a simple two dimensional plot which reflects most of the information that it contains (Fig. 2 a ) and pro-vides a useful basis for comparison. A selection of the data set was taken for the initial network and the training set and the remainder left as unseen data to test the validity of the network. From Fig. 3(a) and (b) below, it can be seen that the AIS identified three distinct clusters in the data set. A feature of the AIS is the ability to manually investigate the evolved network via the visualiza-tion technique that has been developed. The al-gorithm used to present the data uses attraction between cells that are connected by links and repulsion between all cells. This means that cells that are connected to each other reach a dynamic equilibrium. It should be stressed that the repre-sentations of the network generated are not mean-ingful as a conventional two dimensional plot. They represent the information in the AIS as a topological structure. The attraction and repul-sion algorithm simply spreads out the cells into a less cluttered shape (Timmis et al.).
the network. The cluster to which it was drawn was found to be a mixture of original Iris Setosa cells that had survived from the initial set and mutated clones that have similar values. The AIS has created a diverse set of Setosa derivatives, hence the large cluster. This enables the AIS to be
an effective classifier on items which vary signifi-cantly from the original training items. Clearly there is a balance to be held here between over-generalisation and lack of tolerance to noise. Fig. 3(b) shows an Iris-Virginica antigen being classified. Here the cell seems to be acting as a
Fig. 1. Behaviour with easily seperable 2-dimensional data. (a) Scatter plot of simple 2-dimensional simulated data; (b) graphical representation of the artificial immune system generated.
Fig. 2. PCA plot for the Iris data and overview of the IAS algorithm. (a) PCA plot of the Iris data; (b) overview of the algorithm.
bridge between two clusters. These two clusters are Iris Virginica and Iris Versicolor. These two vari-eties of Iris have very similar characteristics within tile data-set so that some cross-over between the clusters is to be expected. This can clearly be seen in the PCA plot (Fig. 2a) where crosses represent Iris Versicolor samples and the diamonds represent Iris Virginica samples. The inclusion of some of the disconnected portions of the network leads to the question: ‘What is the significance of the discon-nected portions of the network?’
As the network evolves over time, similar cells are clustered together. As new cells are introduced into the network as a result of cloning and mutation some will be closer matches to thc existing data and some will not. Those that are not very close matches, but still quite similar may be loosely integrated into the edges of an existing cluster. However. those that are more similar will be integrated into the centre of the cluster. As the network affinity threshold becomes more stringent the weaker links are removed thus, detaching portions of the network that are loosely connected. The cells that were originally in the centre of clusters will become exposed at the edges of their cluster and possibly break away as cells which match the data more closely appear at the centre of the cluster. They may still survive in the network as they are sufficiently stimulated during the learn-ing cycle to maintain sufficient stimulation to escape culling. Those cells that break off earlier are likely to be poorer matches for the data and thus their stimulation level will be lower and they will die as new cells appear in the network. Over time this leads to the ‘fountain effect’ as new cells replace old ones at the centre of clusters forcing older ones at the edges to break off and die. Thus it is these disconnected clusters of cells which can be seen in Fig. 3 are those which provide the variety which allows the immune system to generalise and ‘pre-empt’ variations in the data encountered (Section 3.3).
5. Future work
Demonstrating clearly that the fountain-effect described above occurs and using the behaviour to
limit the size of the network is an immediate priority. This will clearly involve some more care-fully selected criteria for culling B cells and may involve some changes to our initial formulation of the algorithm. It will also involve the application of the algorithm to more complex data-sets of higher dimensionality.
Longer term work will include the use of hierar-chical decompositions of the networks produced and techniques for improving the visualization software. Exploration of further enhancements to the algorithm including the use of a T cell analogue may also prove fruitful.
6. Conclusions
The networks produced by the artificial immune system presented here are effective when used as a simple classification tool. They perform well on all of the data with which they have been tested so far. The ability to produce a network which not only models that data presented, but also generalises to cover a larger region of the input space seems to be valuable. The networks also lend themselves easily to some very effective visualization tech-niques which enhances their usablity further.
References
Cooke, D.E., Hunt, J.E., 1995. Recognising promoter se-quences using an artificial immune system. In: Proceed-ings of Intelligent Systems in Molecular Biology 95, AAAI Press.
Dasgupta, D.,1996. Using immunological principles in anomaly detection. In: Proceedings of the Artificial Neu-ral Networks in Engineering (ANNIE96), St Louis, USA. Dasgupta, Dipanka, 1998. Artificial Immune Systems and their Applications. Springer, Nerlag ISBN 3-540- 64390-7.
Everitt, B., 1974. Cluster Analysis. Heinemann, London. Farmer, J.D., Packard, N.H., Perelson, A.S., 1986. The
im-mune system, adaptation and machine learning. Physica 22D, 187 – 204.
Fisher, R.A., 1936. The use of multiple measurements in taxonomic problems. Ann. Eug. Part II 7, 179 – 188. Forrest, S., Hofmeyr, S.A., Somayaji, A., Longstaff, T.A.,
Hunt, J.E., Timmis, J., Cooke, D.E., Neal, M.J., King, C.M., 1998. Jisys: development of an artificial immune system for real world applications. In: Dasgupta, D. (Ed.), Artificial Immune Systems and their Applications. Springer, Verlag.
Jerne, M.K., 1974. Towards a network theory of the immune system. Ann. Immunol. (Inst. Past.) 125C, 373 – 389. Kephart, J.O., 1994. A biologically inspired immune system
for computers artificial life IV. In: Brooks, R.A., MaesP., (Eds.), Proceedings of 4th International Workshop on the Synthesis and Simulation of Living Systems, MIT Press, pp. 130 – 139.
Kepler, T.B., Perelson, A.S., 1993. Somatic hypermutation in B cells: an optimal control treatment. J. Theor. Biol. 164, 37 – 64.
Neal, M.J., Hunt, J.E. Timmis, J., 1998. Augmenting an artificial immune system. In: Proceedings of IEEE Inter-national Conference Systems, lan and Cybernetics, San Diego, pp. 3821 – 3826.
Perelson, A.S., 1989. Immune Network Theory. Immun. Rev. 110 (5), 36.
Timmis, J., Neal, M., Visualising artificial immune networks. Technical report no. NWA-DCS-00-034, University of Wales, Aberystwyth, 2000.