www.elsevier.com / locate / econbase
Non-linear Granger causality in the currency futures returns
a ,
*
a bIoannis Asimakopoulos
, David Ayling , Wan Mansor Mahmood
a
School of Accounting, Banking and Economics, University of Wales, Bangor LL57 2DG, UK
b
School of Business and Management, MARA Institute of Technology, Terengganu, Malaysia
Abstract
This paper examines the relationship between currency futures returns by employing a test for non-linear causality. The results indicate evidence of unidirectional non-linear causality relationship in four cases. However, after filtering the returns using a GARCH (1,1) model we find insignificant and statistically weaker non-linear causality relationships. 2000 Elsevier Science S.A. All rights reserved.
Keywords: Non-linear causality; Currency futures; Volatility persistence
JEL classification: C32; G13
1. Introduction
Although many studies during the 1980s and 1990s reported that financial time series exhibit non-linear dependence (e.g., Hsieh, 1989, 1991; Scheinkman and LeBaron, 1989), researchers often neglect it when they test for causal relationships. As noted by Hiemstra and Jones (1994) and Fujihara
´
and Mougoue (1997), all previous studies on causal relationship rely exclusively on traditional linear Granger causality tests. However, as shown by Baek and Brock (1992), these tests generally have low power against non-linear relationships.
The interest in uncovering non-linear causal relationships started with Baek and Brock (1992) who proposed a non-parametric statistical method for uncovering these relationships. Applying this methodology, Hiemstra and Jones (1994) report highly significant bi-directional non-linear causality between daily returns on the Dow Jones Industrial Average and percentage changes in new York ´ Stock Exchange trading volume over the 1915–1946 and 1947–1990 periods. Fujihara and Mougoue (1997) show that significant bi-directional non-linear causality between returns and trading volume for three petroleum futures contracts exist. Finally, Abhyankar (1998) finds a significant bi-directional non-linear causal relationship between the FT-SE 100 index futures and cash markets.
*Corresponding author. Fax: 144-1248-364-760.
E-mail address: [email protected] (I. Asimakopoulos)
However, the aforementioned studies wrongly presume that a test of Granger causality implies that a change in one series causes a reaction in another series. In fact, one of the series may react first without necessarily causing a reaction in another series. Hamilton (1994, p. 306) gives an example where Granger causality may have no economic interpretation. Also, Engle and Susmel (1993) and Arshanapalli and Doukas (1994) suggest that a common factor could be driving a causal relationship. In the present study, using a non-linear Granger causality test to investigate the causal relationship between daily currency futures returns, we find that the ignorance of a common informational factor (which is the volatility) provides misleading results. Specifically, while significant causal relationships were initially identified between four currency futures returns, further tests reveal that the causality found was no more than one currency reacting more quickly than another to a common informational factor.
2. Data and methodology
Daily currency futures prices for the British Pound (BP), the Deutsche Mark (DM), the Japanese Yen (JY) and the Swiss Franc (SF) in US dollars between January 1986 and April 1997 are used for the analysis. Thus, the series are not affected by the removal of the daily price limit by the Chicago Mercantile Exchange (CME) on 22 February 1985. The data set was constructed from quotations of the International Monetary Market of the CME via Datastream. Continuously compounded returns are calculated as the first differences of the natural logarithms of daily settlement futures prices multiplied by 100 resulting in 2954 observations in each return series providing sufficient degrees of freedom for the tests applied.
The application of a non-linear causality test implies first that the series should not have any linear dependence and second that they exhibit non-linear dependence. To ensure that, we apply a vector autoregressive (VAR) model to the four return series in order to remove any linear dependencies. Then, the residuals are tested for non-linear dependencies using the BDS test. Finally, we test for the presence of non-linear causality.
Baek and Brock (1992) propose a nonparametric statistical method for detecting non-linear causal relationships, since the standard linear causality tests fail to do so. Their approach employs the correlation integral, an estimator of spatial dependence across time, to uncover the relationship between time series.
Consider two stationary time serieshXj andhYj, t51, 2, . . . n. Let the m-length lead vectors X be
t t t
m Lx
designated by X , and the Lx-length and Ly-length lag vectors of X and Y be designated by Xt t t t Lxand Ly
Y , respectively. For given values of m, Lx, and Ly$1 and for e.0, Y does not strictly Granger
t Ly
two arbitrary m-length lead vectors of hXtj are within a distance e of each other, given that their corresponding Lx-length lag vectors are within a distance e of each other. A test based on Eq. (1) can be implemented as follows:
C (m1Lx, Ly, e) C (m1Lx, e)
1 3
]]]]]]5]]]]] (2)
C (Lx, Ly, e)2 C (Lx, e)4
CI ,CI CI1 2, 3 and CI4 in the above equation are the correlation-integral estimators of the joint probabilities which are discussed in detail by Hiemstra and Jones (1994). For given values of m, Lx and Ly$1 and for e.0 under the assumptions that hXj and hYj are strictly stationary and weakly
t t
dependent, if hYtj does not strictly Granger cause hXtj then,
C (m1Lx, Ly, e, n) C (m1Lx, e, n)
where s (m, Lx, Ly, e) and an estimator discussed in detail in Hiemstra and Jones (1994).
3. Results
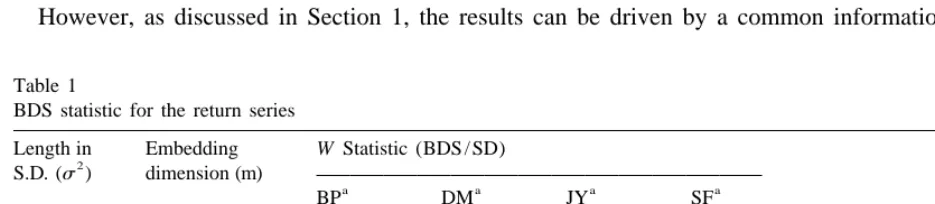
After removing the linear dependencies using a VAR model, we test for the presence of non-linear dependencies using the BDS test. Table 1 sets out the results.
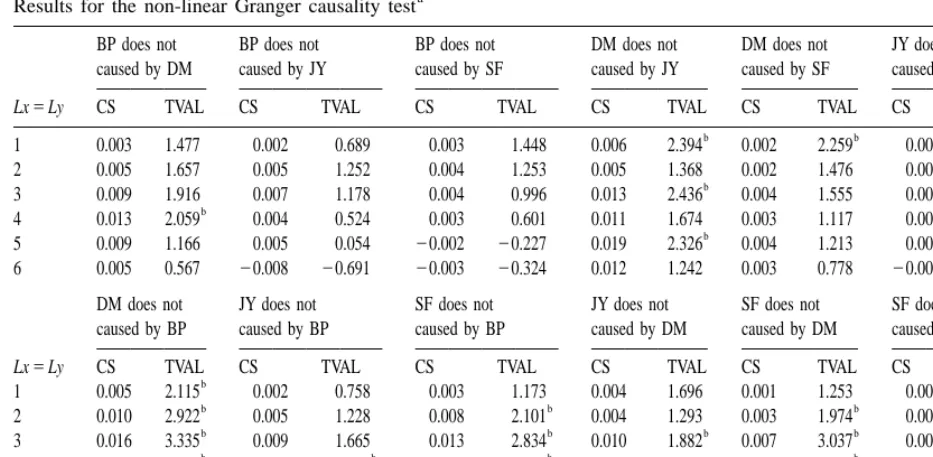
As can be clearly seen, all series show significant non-linear dependencies. Therefore, we can proceed by testing for non-linear causality. Table 2 presents the empirical results of the non-linear Granger causality test.
The standardised test statistic (TVAL) reports highly significant unidirectional non-linear Granger causality particularly from Japanese Yen to Deutsche Mark, British Pound to Deutsche Mark, British Pound to Swiss Franc and Deutsche Mark to Swiss Franc showing that the British Pound is the most influential currency and that the Swiss Franc has no influence at driving changes to the other currencies.
However, as discussed in Section 1, the results can be driven by a common informational factor
Table 1
BDS statistic for the return series
Length in Embedding W Statistic (BDS / SD)
2
S.D. (s ) dimension (m)
a a a a
BP DM JY SF
b b b
1.0 2 4.237 3.115 4.578 1.348
b b b
1.0 4 8.969 1.414 7.159 2.290
b b b b
BP, British Pound; DM, Deutsche Mark; JY, Japanese Yen; and SF, Swiss Franc.
b
Table 2
a
Results for the non-linear Granger causality test
BP does not BP does not BP does not DM does not DM does not JY does not caused by DM caused by JY caused by SF caused by JY caused by SF caused by SF
Lx5Ly CS TVAL CS TVAL CS TVAL CS TVAL CS TVAL CS TVAL
b b
1 0.003 1.477 0.002 0.689 0.003 1.448 0.006 2.394 0.002 2.259 0.003 1.525 2 0.005 1.657 0.005 1.252 0.004 1.253 0.005 1.368 0.002 1.476 0.003 0.815
b
3 0.009 1.916 0.007 1.178 0.004 0.996 0.013 2.436 0.004 1.555 0.005 1.023
b
4 0.013 2.059 0.004 0.524 0.003 0.601 0.011 1.674 0.003 1.117 0.005 0.838
b
5 0.009 1.166 0.005 0.054 20.002 20.227 0.019 2.326 0.004 1.213 0.003 0.374
6 0.005 0.567 20.008 20.691 20.003 20.324 0.012 1.242 0.003 0.778 20.002 20.176
DM does not JY does not SF does not JY does not SF does not SF does not caused by BP caused by BP caused by BP caused by DM caused by DM caused by JY
Lx5Ly CS TVAL CS TVAL CS TVAL CS TVAL CS TVAL CS TVAL
b b
1 0.005 2.115 0.002 0.758 0.003 1.173 0.004 1.696 0.001 1.253 0.005 2.087
b b b
2 0.010 2.922 0.005 1.228 0.008 2.101 0.004 1.293 0.003 1.974 0.003 0.851
b b b b
3 0.016 3.335 0.009 1.665 0.013 2.834 0.010 1.882 0.007 3.037 0.007 1.464
b b b b
4 0.020 3.464 0.018 2.283 0.019 3.075 0.010 1.389 0.011 3.412 0.005 0.832
b b b b
5 0.023 3.292 0.023 2.269 0.023 3.16 0.011 1.242 0.015 3.725 0.007 0.947
b b b b
6 0.026 3.105 0.020 1.651 0.021 2.499 0.008 0.695 0.015 3.349 0.004 0.492
a
The results are based on the residuals of a VAR model and CS and TVAL are the difference between the two conditional probabilities and the standardised test statistic, respectively. Lx and Ly denote the number of lags in the residual series used in the test. In all cases, the lead length, m, is set to unity. Under the null hypothesis of non-linear Granger causality the test statistic is asymptotically distributed, N (0,1).
b
Denotes significance at the 5% level of significance.
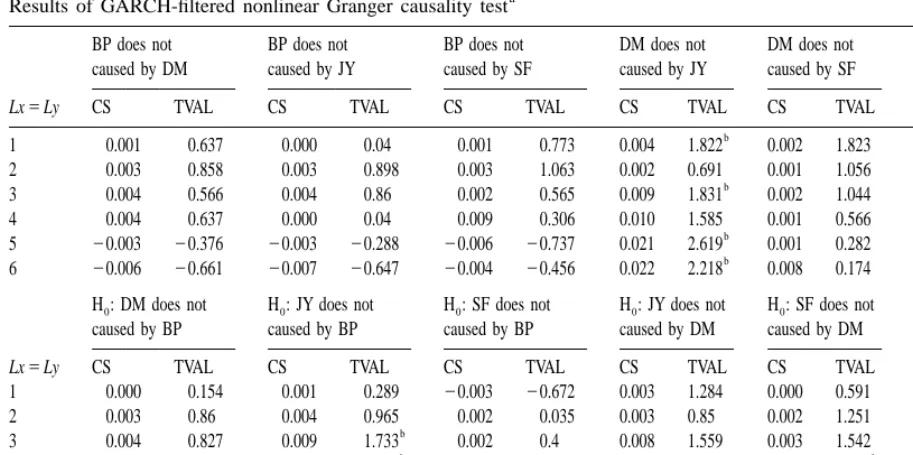
which, following the literature, is assumed to be the persistence in variance. Therefore, we filter the return series using a GARCH (1,1) model and we repeat the tests. The results in Table 3 show that even the filtered series seem to have non-linear dependencies. I must point out that the results from the BDS test reported in Table 3 may be biased since the test is applied to standardised GARCH (1,1) residuals. As was shown in Brock et al. (1991, p. 143), among others, the asymptotic distribution of the BDS statistic is affected when using standardised residuals from GARCH models. However, the
Table 3
BDS statistic for the GARCH (1,1) filtered series
Length in Embedding W Statistic (BDS / SD)
2
S.D. (s ) dimension (m)
BP DM JY SF
1.0 2 0.331 0.313 1.495 1.032
a a
Table 4
a
Results of GARCH-filtered nonlinear Granger causality test
BP does not BP does not BP does not DM does not DM does not JY does not caused by DM caused by JY caused by SF caused by JY caused by SF caused by SF
Lx5Ly CS TVAL CS TVAL CS TVAL CS TVAL CS TVAL CS TVAL
b
1 0.001 0.637 0.000 0.04 0.001 0.773 0.004 1.822 0.002 1.823 0.002 1.009 2 0.003 0.858 0.003 0.898 0.003 1.063 0.002 0.691 0.001 1.056 0.004 0.366
b
3 0.004 0.566 0.004 0.86 0.002 0.565 0.009 1.831 0.002 1.044 0.005 1.056 4 0.004 0.637 0.000 0.04 0.009 0.306 0.010 1.585 0.001 0.566 0.006 0.894
b
5 20.003 20.376 20.003 20.288 20.006 20.737 0.021 2.619 0.001 0.282 0.009 1.089
b
6 20.006 20.661 20.007 20.647 20.004 20.456 0.022 2.218 0.008 0.174 0.004 0.414
H : DM does not0 H : JY does not0 H : SF does not0 H : JY does not0 H : SF does not0 H : SF does not0
caused by BP caused by BP caused by BP caused by DM caused by DM caused by JY
Lx5Ly CS TVAL CS TVAL CS TVAL CS TVAL CS TVAL CS TVAL
1 0.000 0.154 0.001 0.289 20.003 20.672 0.003 1.284 0.000 0.591 0.003 1.406
2 0.003 0.86 0.004 0.965 0.002 0.035 0.003 0.85 0.002 1.251 0.000 0.231
b
3 0.004 0.827 0.009 1.733 0.002 0.4 0.008 1.559 0.003 1.542 0.004 0.874
b b
4 0.005 0.878 0.013 1.783 0.003 0.56 0.007 1.069 0.005 1.764 0.006 1.085
b b
5 0.007 1.069 0.020 2.111 0.011 1.459 0.014 1.507 0.007 1.93 0.008 1.14
b
6 0.012 1.417 0.017 1.466 0.011 1.198 0.012 0.956 0.007 1.671 0.007 0.758
a
The results are based on the residuals of a VAR model and CS and TVAL are the difference between the two conditional probabilities and the standardised test statistic, respectively. Lx and Ly denote the number of lags in the residual series used in the test. In all cases, the lead length, m, is set to unity. Under the null hypothesis of non-linear Granger causality the test statistic is asymptotically distributed, N (0,1).
b
Denotes significance at the 5% level of significance.
reported values in Table 3, especially at higher dimensions, exceed the critical values based on simulation results reported by Hsieh (1989) and Brock et al. (1991) by far.
Applying the non-linear causality test to the filtered series we find weaker results as shown in Table 4. At the 5% level of significance the null hypothesis of non-linear Granger causality is rejected in all cases except from Japanese Yen to Deutsche Mark and German Mark to Swiss Franc which are statistically weaker as compared to the case where adjustments for volatility persistence were not made. Thus, the currency futures returns have a weak predictive power for one another when the volatility effects are taken into consideration. Again, the asymptotic distribution of the non-linear causality test might be affected by the use of standardised residuals from a GARCH model. However, following the simulation results offered by Hiemstra and Jones (1994), the finite-sample rejection rates of the test when applied to the estimated standardised residuals of certain GARCH-family models processes are very close to their corresponding nominal sizes. In sum, we agree that the evidence of non-linear causality is weak after taking into account the volatility effect.
4. Conclusion
lagged information from one currency futures returns can be used to forecast changes in another currency futures returns. However, after taking into account the persistence in variance for each currency return we find much weaker relationships suggesting that the ignorance of a common informational factor may provide misleading results.
Acknowledgements
We thank Craig Hiemstra for generously providing his software.
References
Abhyankar, A.H., 1998. Linear and non-linear Granger causality: evidence from the FT-SE 100 Stock Index futures market. Journal of Futures Markets 18 (5), 519–540.
Arshanapalli, B., Doukas, J., 1994. Common volatility in S&P 500 Stock Index and S&P 500 Stock Index futures prices during October 1997. Journal of Futures Markets 14 (8), 915–925.
Brock, W., Hsieh, D.A., LeBaron, B., 1991. In: Non-linear Dynamics, Chaos and Instability: Statistical Theory and Economic Evidence, MIT Press, Cambridge, MA.
Baek, E., Brock, W., 1992. A General Test for Non-linear Granger Causality: Bivariate Model. Working Paper, Iowa State University and University of Wisconsin, Madison, WI.
Engle, R.F., Susmel, R., 1993. Common volatility in international equity markets. Journal of Business and Economic Statistics 11, 167–176.
`
Fujihara, R.A., Mougoue, M., 1997. An examination of linear and non-linear causal relationships between price variability and volume in petroleum futures markets. Journal of Futures Market 4, 385–416.
Hamilton, D.J., 1994. In: Time Series Analysis, Princeton University Press, Princeton, NJ.
Hiemstra, C., Jones, J.D., 1994. Testing for linear and non-linear Granger causality in the stock price–volume relation. Journal of Finance 5, 1639–1664.