SPATIAL DATABASE FOR THE IMPACT OF
the vulnerable fisheries sector is necessa ry,.for susta ina ble use.Some a mbitious but importa nt phenomena had been ta ken into a ccount dissolved oxygen and biologica l va ria bles : chlorophyll, phytopla nkton, zoopla nkton a nd la rva e (mostly fish a nd cr usta cea n la r va e) of sha llow wa ter J a va sea , sma ll pela gic or deepwa ter la rge pela gic refer to ea ch specia l purposes.
Keywo rds: spa tia l-da ta ba se, clima te-cha nge, vulner a ble, fisher ies, a da pta tion-str a tegy
1. INTRODUCTION
temperature o f t he fie ld measurement 1997 and 2002 and 2007 TRITON data. Spat ia l mu lt i-dept h-la yer seawat er t emperat ure approach had been developed in the paper is important to detect its impact and analysis of deep water large pelagic fishery such as tuna fishery and its seasonal spatial distribution pattern (Hartoko, 2009; Hartoko, 2010a).
The paper would also specially analyze and discuss the sub-surface of horizontal temperature profile, which is not yet known and not developed yet to this matter before. The study was the first ever attempt in fisheries oceanography sciences to explore the empiric correlation between the spatial distribution of tuna (Thunnus.sp) and sub-surface in-situ temperature data. By means of optimalization and use of an in-situ data of both vertical and horizontal which will be processed into a multilayer subsurface seawater temperature of ARGO Float in Indian ocean. So far only sea surface temperature (with temperature around 29 °C) dat a were used to lo o k fo r t he co rrelat io n fo r t una spat ia l distribution, while the Thunnus.sp swimming layer as widely known is in about 80 — 250m depth with seawater temperature between 15 — 23 °C. The noble character of ARGO Float data is as in-situ data recorded directly by the sensors, transmitted to the satellite, transmitted to the ground station and ready to be used by researcher all over the world.
The important of the paper is that first effort ever to elaborate and discuss a the possible real impact of global warming or climate change in term of sea surface temperature changes to endemic and vulnerable marine species in a tropical country such as Indonesia. As an example such as the spatial variations of benthic fishery resources, which is so far is very limited up to this day. Two important characters of benthic fishery, is firstly that they are sensitive to environmental changes due to their limited movement or sessile ness; secondly is the close relationship of benthic organisms to its bottom texture and c haracter. In other perspective, these two characters can be used to monitor both the impact and dynamic responses of the benthic community due to environmental changes, such as seawater pollution, global changes, climate changes such as seawater temperatur e anomalies, sea level rise, etc. The group of benthic fishery and regarded as vulnerable species such as flat-fish (Psettodidae), mollusca: Loligo.sp, Sephia.sp and Octopus which is believed as the most vulnerable coastal/ shallow fisheries resources which would be such important database for the adaptation strategy due to climate change, especially to seawater anomaly and for the benthic and coastal fishery management in the future.
2. METODOLOGY
In-situ data of 1997 — 2009 was a part of Fish Stock Assessment Expedition by RV. Baruna Jaya IV (BPPT) Length Over All : 60.4m; 1200GT, June — August 1997 off the North of Papua, south Java and west Sumatra Indian ocean and some other Indonesian seas had been collected. Both horizontal (surface water) and vertical temperature data was measured using CTD with 0.01 degree Celsius accuracy. GPS coordinate recorded every 6 minute interval. Design of survey track was `U' parallel grid track ranged from 120 - 240 mile off the North of Papua 60 interval between the main-leg, with total length of 3375 mile survey track (Johannesson and Mitson (1982) and MacLennan and Simo nd s (1992) in Nugro ho e t . a l (1996). Fie ld C TD dat a were processed using `Kriging' method using Er-Mapper software (licensed user). Analysis of horizontal temperature data approached with a multi-layer spatial analysis method hab been developed earlier (Harto ko, et all. 2000a, 2000b, Hartoko and M Helmi, 2004).
TRITON (Tr ia ngle Tr a ns-Ocea n buoy Net wor k) was a series of oceanographic buoy built and set on the ocean by JAMSTEC (J a pa n
a gency for Ma r ine-Ea r th Science a nd Technology), used to measure
marine meteorological and ocean surface parameters in order to monitor ENSO phenomena (El Nino-Southern Oscilla tion). Parameters measured b y T R I T O N a r e w i n d sp e e d , a ir t e mp e r a t u r e , h u m id it y, r a in precipitation, short wave solar radiation, sea surface tempe rature, current and water salinity. Specialy for sea water temperature were also buoy using Conductivity, Temperature and Depth (CTD) thermometer sensor of MicroCAT, SBE37-IM attached underwater at the depth of 1
meteorological data transfered into the data processing and stored
internally. Deep water data were transmited from each sensors in the data processors with magnetic induction method by a telegrapgic wire in the water. Water temperature data that transmitted by ARGOS were stored in ASCII data package that later downloaded and processed with Windows data used in the study are : (1) Actual Thunnus.sp catch specifieid to the east and west season from PT. PSB Benoa, Bali in Indian ocean, year 2007; (2) Sea surface and 80m, 100m, 150 m and 200 m temperature of Ar go F loa t
data in Indian ocean cover ege a rea antara 8°— 18° S and 100° — 118°
E. (A) Argo Float Data, was processed using Hartoko procedure (Hartoko,
A .2010a ,). Software used in the study are : ER.Mapper 6.4 to built
horizontal sub-surface seawater temperature layer with Kriging method (spatial interpolation method). WinRar and Ocea n Da ta View (ODV) 4.1.3 Software to exctract seawater temperature data of Ar go F loa t.
(a). Data downloaded from Argo Data Center (GODAE Webserver); (b). Data Extraction, using WinR ar so ft ware; Ext ract ed dat a t hen o pened, read and displayed using ODV (Ocea n Da ta View) software and then saved in a ".txt" file format; and finally opened using Microsoft Excel softwa r e in a table format. Followed by Kr iging steps in ER Mapper softwa r e in order to convert from points (coordinates) into a spatial layer data. (B). Actual Thunnus.sp catch data. The actual Thunnus.sp catch data was compilled from Log-book of each Tuna fishing vessels from PT. PSB Benoa, Bali and splitted into two season, that is the east season (April -November) and west season (December - March) in a tabel format in a Microsoft Excel, then saved into a .txt format file for the input proces s in the Kriging of Er-Mapper softwa r e. Fishing gear used is Deepsea Tuna of Semarang, central Java. Measurement of research variables such seawater depth using a Garmin echo-sounder. Salinity was measured in-
situ using HORIBA Water Qualit y Checker. Samples of bottom substrate collected using 5 kg Grab and samples of demersal shrimp using a local
fisherman bottom net on board of local fisherman boat 15- GT during the study completed with a GPS station coordinates recorded simultaneously (latitude and longitude). About 22 stations of field data and samples were collected. First step in building a digital layer for the ecosystem model was transferring 'geodetic/ position data (degree; minute; second / D° M' S" ) of latitude and longitude data into a single-numerical value with a formula of (Hartoko and Helmi,2004).
3. RESULT AND DISCUSSION
Hartoko (2000a. 2000b.2004) had analyze and revealed the fate or occurrence of up welling zone in adjacent of Halmahera islands based on the analysis of both multi-layer horizontal and vertical temperature profile as indicated on Fig 1 and Fig 2. Where the water mass with temperature of 27 °C from depth of 80 — 100m from the North Papua flows vertically onto the surface layer at the up-welling zone at corridor between Halmahera island and West Papua peninsula (Hartoko,2000a; 2007). The most relevant data was offered by the study of Kuroda et.al (1995) 'for the occurrence of North Guinea Coastal Under Current (NGCUC), but its effect to the development process of up welling at north Papua waters adjacent of Halmahera islands was not known yet since. As performed on the SST 1997 was clearly indicated the occurrence of high sea water temperature which was later recognized as Hot Event (HE) by Kawamura et al (2008), where in that special condition of HE regularly generates the sharp gradient of daytime vertical temperature profile in the near-surface layer (i.e. warm layer). Another supporting information as recorded SST from December 1996 to June 1997 indicates the flow of hot water from the west of Peru flows along the equator to the north off Papua (west end Pacific) on global SST released by TOPEX Poseidon Jet Propulsion Lab (NASA,1997). This hot water mass contribute to 1°C SST increase/ anomaly.
In line to the above case Gordon (2005) confirmed that large scale of Indonesian Through Flow (ITF) was the flow of Pacific water along the equator westward into the Indian ocean via the Indonesian seas, with primary ITF portals flow westward along the north coast of Papua. Especially passes through Halmahera — Papua corridor later known as South Pacific inflow or South Pacific thermocline where it first up well into the surface layer before spreading southward within the surface Ekman layer, as revealed above. Analysis on in-situ sea water temperature derived from TRITON buoy data at La Nina event 2002 :
the
average daily SST at east monsoon (July — November 2002) was 29.75°C, with temperature range from 28.3 - 31.3 T.Furthermore. with a multi-layer special analysis method had revealed and it was clearly detected that HE not only on the SST but also as well as its subsurface layers at the depth of 50m. 100m, I 50m, flowing along the coast, with high sea water temperature range from 29 — 30.5 °C during
east monsoon 2002 as in Fig 3 and during the west and east monsoon 2007 as in Fig 4. Average sea surface temperature in 2007 was : 29.83°C indicates higher SST than both SST of 1997 and 2002 (Fig.5). Average daily SST of west monsoon 2007 (December 2006, January and February 2007) was 29.69°C as in Fig 6 and 7. Where daily SST of 2007 east monsoon (July — September 2007) were about 0.08 - 0.5°C higher than same season of 2002 (TRITON Buoy data).
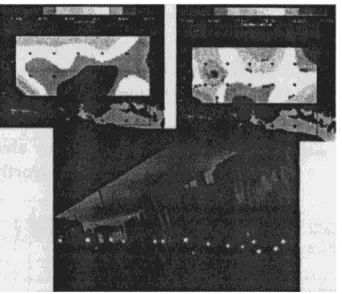
Figure 1. Sea surface temperature and sub-surface temperature at depth of 80m, east-onsoon 1997 (EI-Nino event). Field measurement. BARUNA JAYA IV Expedition. (Arrow always point
to North).
Figure 2. Hot sea water flows and SST anomaly on Global SST released by TOPEX Poseidon Jet Propulsion Lab (NASA,1997).
Figure 4. Sea surface temperature at West-monsoon (above) and East-monsoon 2007 (below). Triton Buoy data, sub- surface temperature at depth 50m,100m and 150m, East-monsoon 2007. Triton Buoy
Data (Arrow always point to North.)
Several tuna belongs to the Family of Scombridae are Thunnus a la lunga
(Albacore), Thunnus a lba cor es (Yellowfin tuna), Thunnus rnacoyii
(Southtern Bluefin tuna), Thunnus obesus (Big eye tuna) and Thunnus tongkol
(Longtail tuna). Unlike with other fish species that has a whitish flesh meat color, the group of Thunnus.sp has a reddish flesh meat color, this is since tuna flesh meat has more myoglobine content. Tuna as widely known as a fast swimming fish and a highly migratory species. Hayes and Laevastu, 1970; Marpaung (2001) explained that big-eye tuna can be found in both tropical and sub-tropical waters such as in Atlantic, Indian and Pacific ocean. These species enjoy very much in seawater temperature range of 13" — 29° C, and
optimum seawater temperature between 17 ° - 22 " C. Their vertical distribution may vary due to a seaso na l changes and dept h o f
t h e r mo c li n e l a ye r . The y belongs to a poikilother mic or known as a
ther eto-confor mer group of fish. High hook-rate (HR) of big-eye tuna in
Indonesia was found in Banda and Arafura sea, north Sulawesi. north Papua, Mollucas and Tomini bay with 0.66; 0.58; 0.56; 0. 41 respectively. Highest HR was found in south Java Indian ocean (0.95), fo llowed by south BaliNusatenggara (0.83) and west Sumatera (0.63). Wyrtki (1961) suggest that south Java and Nusa Tenggara (Sumbawa - Timor) known as the up-welling zone. With occurrence of up-welling will increase the depth of the thermocline layer up to about 50m depth approaching to the surface water. Furthermore, he suggests that the HR of big-eye tuna (Thunnus obesus) is bigger than those of Thunnus a lba ca r es.
Spatial horizontal sub-surface in-situ data of both tuna catch and ARGO Float data in Indian ocean were processed from 216 coordinates and focused into four main seawater temperature layer depth, that are 80m, 100m, 150m and 200m dept h. Sub -surface in-sit u seawater temperature at those depth was assumed as the more a ssociated with tuna horizontal spatial distribut ion, although each horizontal sub -surface seawater temperature has its own detail differences in each depth as shown in Fig 8. During December — March high tuna catch move to the west part of south Java Indian ocean at around 15.5° S and 115.5 ° E a nd so me in aro u nd 14 ° S a nd 114 ° E. T he we st ward mo ve ment o f tuna cat ch was assumed due to t he effect o f So u th
Equa tor ia l Cur rent Nontji (2002) in south of Java Indian ocean, which
Horizontal seawater may not vary significantly in some Indonesian seas, especially those surface isother ma l zone on the surface water was generally parallel with the earth latitude, where area in the same altitude w ill ha ve a similar su n lig ht radiat io n. Harto ko, et a l. (2000a); Hartoko,A. (2007); Hartoko,A. (2009) and result of this study (as in Fig 8) revealed that vertical seawater distribution in Indonesia was basically can be classified into three main seawater layer, that are the warm
homogenous la yer near to the surface layer up to 80m to 100m with
seawater temperature about 28 °C; the thermocline (discontinuity la yer)
in the middle column of water where seawater temperature decrease extremely from 20 °C to 10 °C in the depth range of 200 m — 300m; and
t he co o l d e e p l a ye r be lo w 3 00 m d e p t h, u su a lly w it h se a w a t er temperature below 10 °C and seawater temperature decrease gently less
than 5 °C in depth below 1000m or deeper. Important finding from this is
that there was the increase of the thermocline layer depth happened during the west season as shown in Fig 8. Wyrtky (1961 and 2005) explained that short term thermocline depth vertical variation was itirected by the sea surface water movement, tide and water current, in a depth from 120 m up to 140m in area approaching the south equatorial current. As well as sub-surface seawater temperature changes as the flied of Indian Ocean Dipole (IOD) modes and the role of Rossby waves (Suryachandra Rao A.et.al. 2001).
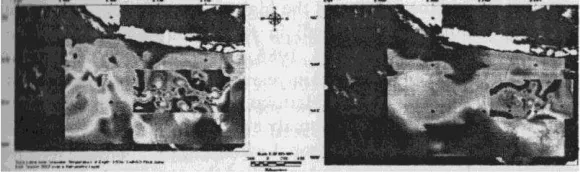
Figure 8. Overlay of Thunnus.sp actual catch on seawater temperature in depth of 150m during east season 2007 (left) and during west
season 2007 (right)
Semarang coastal water and its adjacent area in a long time before 1981 was wide ly k no wn as a good sh rimp fisher y zo ne, unt il it decreased sharply after 1985. The phenomenal shrimp fishery with its over production before 1981 was due to the use of bottom trawl, which cause a massive damage to the benthic community, until it is totally banned in 1981 by a Presidential Decree (Keppres 81). There are three main shrimp species with its high price known before 1981 period are tiger shrimp (P ena eus
monodon), white shrimp (P ena eus mer guiensis) and Metapenaeid.
In this study, only two species of shrimp were found during the field sampling, that is white shrimp (P ena eus mer guiensis) and Metapenaeid. The spatial distribution of the total shrimp, Penaeid, Metapenaeid, dominant silt substrate and salinity of the seawater as shown in Fig 9 as in Hartoko and P. Wibowo (in press, 2011)
Climate change - Variability of 30 years Sea Surface Temperature of the Java sea. The important of sea surface temperature (SST) is the role of SST as the interface from the atmospheric to the oceanographic environment. Based on three coordinate (represent the west, central and east region) 30 years data recorded from 1971 - 2000 the range of SST in Java sea is 27,48 °C - 29,66 °C. There were two cycles of low (February
and August) and high (May and November) SST in avearage during 30 years period 1971 -2000. During the periode before 1980, the anomaly of SST was in general below normal, or cooler than its average value. The important evidence had been discovered that after 1980 indicates an SST anomaly above normal, or above its average. This means that the SST of the Java sea was tends to increase after 1980. The highest SST anomaly during periode of 1971 - 1980 is 0,72 °C happened in August 1973 and lowest -1,47 °C in January
1976. While during the periode of 1981 — 1990 the highest SST anomaly is 1,39 °C (almost double than befor 1980 period) in March
1983 and lowest is -1,02 °C in November 1982. In the periode of
1990 — 2000 lowest is -1,0 °C in June 1994, and the highest
deviation is 1.82 °C in July 1998. A positive SST anomali in Java
sea (more warm) were significant in year of : 1973, 1983, 1985, 1988 and 1998. A negatif SST anomaly (cooler) had happened in year of : 1974, 1976. 1982. 1994 and 1997 (Widada.S.et al. 2007a: Hartoko.A and W Sulistya. 2010a). Based on the SST variability and anomaly analysis as above for 30 years periode (1971 — 2000), beside a seasonal variability (regular) as well as interannual (irregular variability) had revealled the consistant increase of 0,7 °C for 30 years. This
persistant seawater temperature increase was assumed as the effect of global o c ea n p he no me na k no w n a s globa l wa rming. Based on small scale fishery resources point of view, SST ano maly o f 0.5
°C (positive and negative) is still t o le ra ble , wh ic h is a ct ua ll y
happened until 1980 (Fig 10 and 11). SST anomaly up to 2.0 °C and
could be more in the future is regarded would be harmfull for small scale fishery resources.
T h a t i s r e l a t e d t o t h e t emperat uare tolera nce a nd survival of microbial. planktonic. larvae, and fish biomass. and the extreme SST anomaly which had happened since 1980 — 2000 ( Ha rto ko , A da n W. Su list ya (2010b). Swarinoto and
Kart iningsih Y (2007), in the periode of 1971 — 2000 the event of El Nino had happened in year
of : 1972, 1974, 1982. 1986. 1992. 1994 and 1997. While the La Nina years had happened in : 1973. 1975, 1988, 1995, 1998 and 1999. This findings suggest that a positive SST anomaly (more warm) in Java sea wus in general coincide with the event of La Nina periode, in : 1973, 1995 and 1998. While a negative (cooler), surprisingly coincide with El Nino periode, in year of : 1974, 1982, 1986, 1994 and 1997. Based on a more global ocean phenomea such as Dipole Mode Index (DMI) data in the periode of 1971 — 2000, indicates that a positive DMI had happened in year of : 1972, 1974, 1977, 1982, 1986, 1991, 1994, 1997 and 1999. Negative DMI periode in year of : 1971, 1975, 1983, 1984, 1989, 1992. 1995, 1996 and 1998. SST anomaly of the Java sea shows a positive deviation (more warm) that coincide with the negative DMI had happened in year of : 1973, 1995 and 1998. While a negative SST anomaly (cooler) was coincide with a positive DM1 event in year of : 1972, 1982, 1994 and 1997. Based on the SST variability and anomaly analysis as above for 30 years periode (1971 — 2000), beside a seasonal variability (regular) as well as interannual (irregular variability) had revealled the consistant increase with 0,7 °C for 30 years. During the winter periode in
Asia, a warm seawater inflow from South China sea towards Java sea. The effect of this water mass spread over to the strait of Makassar also in the north of Lombok island in February. On other perspective there is also a seawater input flows into strati of Makasar from Pacific ocean which is called
Indonesia Through Flow (Susanto, D and J Marra, 2005). During the east
monsoon a cooler seawater mass flows from the north of Australia ark; Indian Ocean into the Java sea, espescially during Agustus. This cool seawater mass flows into Java sea through Lombok and Bali strait and spread over to the north in Karimata strait. The phenomena was also reflected with the surface water current during the west and east monsoon (Wyrtky, 1961 and 2005Susanto D and J Marra, (2005) postulated that interannual variation of SST in Indonesia was also affected by ENSO. This was reflected in the periodic cycles of SST in the Java sea, beside a seasonal, but also yearly and 8 years variation. But up to this date there were less interaction Dipole Mode
phenomena originated from Indian Ocean to the El Nino/La Nina from SST variation in Pacific ocean (Hartoko,A dan W.Sulistya. 2010b; Sulistya W., A.Hartoko, S.B.Prayitno. 2007a).
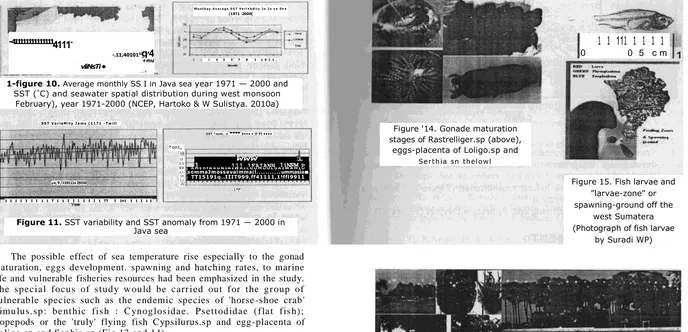
The possible effect of sea temperature rise especially to the gonad maturation, eggs development. spawning and hatching rates, to marine life and vulnerable fisheries resources had been emphasized in the study. The spec ia l focus of s tud y w ou ld be carr i ed out for t he gr oup of vulnerable species such as the endemic species of 'horse -shoe crab' L imu lus.sp : be nt hic fis h : C ynog los ida e. Psett od ida e ( fla t fis h); Copepods or the 'truly' flying fish Cypsilurus.sp and egg -placenta of Loligo.sp and Sephia.sp (Fig 13 and 14).
Figure 13. Endemic species Limulus.sp, benthic fish and Mollusc, Copepods and flying-fish Cypsilurus.sp, small pelagic fish
Rastrelliger.sp and Sardinella.sp
Figure 16. Coastal habitat rehabilitation and seed production of Pandanus.sp, and Calophyllum inophyllum other than mangrove
79
re
4
y4( 9 /119111x 29310
1 1 I I I I I 1 1 T 1 1 I I I I I I 1 TT I I•1 I 1 I 1 1
Figure 11. SST variability and SST anomaly from 1971 — 2000 in Java sea
Figure '14. Gonade maturation stages of Rastrelliger.sp (above),
eggs-placenta of Loligo.sp and
S e r t h i a s n t h e l o w l
--4111111111111114111
--.11,4010111g,4
+mu vliNsTi •
. . . - 1
1-figure 10. Average monthly SS I in Java sea year 1971 — 2000 and SST (°C) and seawater spatial distribution during west monsoon
February), year 1971-2000 (NCEP, Hartoko & W Sulistya. 2010a)
S S T V a r i a M i t y J a m s ( 1 1 7 1 - T w i l l
* on to
10
0,S
0
AS
19
1.1
-7.0
1 1
11
1 1 1 1 1
0 0.5 c m
Figure 15. Fish larvae and "larvae-zone" or spawning-ground off the
west Sumatera (Photograph of fish larvae
by Suradi WP) M o n t h a y A v er a g e S S T V• r l • b di t y I n J o v • S • •
(1971 -2000(
2 3 4 S E 7 8 3 1 0 1 1 ,
S S T *nom.. n •••• S••• • If PI ••••
____ WWW :1.
1 _ , 111.1FAIANN liNFM P.
A M E h r A 4 U N I A I W A I L U O M O O L U A I W A M I O
s o mmaJ m oss e vai mmai l . . . ummasia■ TT15191q..IIIT999,ff41111,1!ffl9911
T•I•
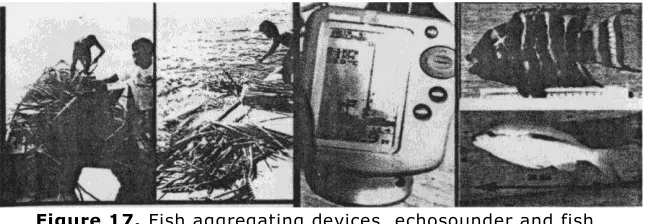
Figure 17. Fish aggregating devices, echosounder and fish
Coastal vegetation and habitat rehabilitation (Figure 16) and as a nursery ground development
3. Fish Aggregat ing, Sheltering and Protection Devices (Figure 17)
ACKNOWLEDGEMENT
The authors would like very much to thanks to the Commander, Mr
Joko H art oyo, Mr Duto Nugro ho and a ll crew s o f R V.B AR UN A
JAYA IV of BPPT. Mr.Pramono Wibowo who had developing the `rumpon' or Fish Agregating unit at K.arirnunjawa Islands. to Dr Suradi WP for the fish larvae photograph. Hartoko,A ; NR Nganro; W.Nugroho: B.Hasyim (2000b). Dynamic Mapping on
Specific Characters of Small Pelagic Fish Ecosystem Arround Kangean Islands. Majalah Ilmu Kelautan.No.18. Tahun v. September 2000. ISSN 0853-7291.
Hartoko,A dan M.Helmi (2004). Development of Multilayer Ecosystem
Parameters Model . J our na l of Coa sta l Devel opment. Vol.7 ,No.3,J une
I lartoko,A (2009a). Oceanographic Characters and Plankton Resources of
Indonesia. Undip Press. ISBN : 978-979-704-835-8
I lortoko.A, (2009b). Ocean Observation on SST Variability and Sub-Surface Spatial Analysis off The North Papua (West End Pacific), the Fate of El_N ino 1997 & 2007 and La N ina 2002 : Fie ld Measurement.
TRITON Buoy and MODIS Satellite Data. J . of Coa sta l Development.
1SSN.1410-5217. Vo113. No.1 October 2009.. pp 30 - 37
Hartoko,A (2010a). Spatial Distribution of Thunnus.sp, Vertical and Horizontal Sub-surface Multilayer Temperature Profiles of in-situ ARGO Float
Data in Indian Ocean. J . of Coa sta l Development. ISSN.1410 -5217.
Vol. 14 No. 1 pp: 1- 14
I Iartoko,A dan W.Sulistya (2010b). Meteorologi dan Sifat Lautan Indonesia.
Published by BMKG_ ISBN : 978-979-1241-25-0
Hartoko and P.Wibowo (in press, 2011). Multi Layer Spatial Analysis for Demersal Shrimp Fishery and SST Warming in the Semarang Coastal
Waters. J . of Coa sta l Development. ISSN.1410 -5217. Vol. No.
Kawamura,H; H.Qin; K.Ando (2008). In-situ Sea Surface Temperature Variations and Near Surface Thermal Structure in the Tropical Hot Event of the IndoPacific Warm Pool. Journal of Oceanography,Vol.64.pp 847 -857.
Kuroda Y; K.Ando; H Mitsudera: D Hartoyo:A.Alkatiri; Y Kashino, K. Yoneyama and K. Muneyama (1995). Oceanic Structure in the Western Tropical Pacific Observed During TOCS Cruises. Proc. International Workshop on the Throughflow Studies in and Around Indonesia Waters. BPPT Jakarta Indonesia.pp 105 - 121.
Laevastu, H and Hayes, (1981). Fisheries Oceanography and Ecology. Fishing News Book Ltd England.199pp.
Marpaung, F.H (2001). Analisis Sebaran Hook Rate Tuna Mata Besar (Thunnus
obesuss) di Perairan Indonesia, Termasuk Zona Ekonomi Eksklusif
Indonesia (ZEEI) Pada Bulan Juli-November 1999. 1PB Bogor (Skripsi
S1).55 Hal
Nontji, A. (2002). Laut Nusantara . Penerbit Djambatan. Jakarta.
Nugroho.D; Petit,D; Cotel P and Luong N (1996). Pelagic Fish Schoals in the Java Sea. Java Sea Pelagic Fishery Assessment Project. The Pelfish Communication Given to the Fourth Asian Fisheries Forum, 16 -20 October 1995. Beijing, ORSTOM and EEC.
Qu Tandong, Du Yan, J Strachan, G Gary and J Slingo (2005). Sea Surface
Temperature and Its Variability in the Indonesian Region. Oceanography vol.18.No 4 Dec
Swarinoto Y and Kartiningsih Y, 2007. Kondisis Suhu Muka Laut Teluk Jakarta Dalam Tahun Normal, El Nino, La Nina (Stu di Kasus Tahun
1996, 1997 dan 1998). Buletin Meteor ologi da n Geofisika . Vol 3 No 4.
Sur ya cha ndr a Rao A.. S.K.Behera, Y.Masumoto and T_Yamagat.
(2001). Interannual variability in the subsurface Indian Ocean with a
special e mp h a s i s o n t h e In d i a n O c ea n D i p o l e . J . D e ep S ea R es ea r c h - IL 4 9 , 1 5 4 9 1572
S u l i s t y a W . , A . H a r t o k o . S . B . P r a y i t n o ( 2 0 0 7 a ) . T h e C h a r a c t e r i s t i c s a n d V a r i a b i l i t y o f S ea S u r f a c e T e mp er a t u r e i n J a v a S ea . J o t ' Re mo t e Se n s i n g a n d Ea r t h Scien ce.
S u s a nt o , D a n d J M ar ra , (2 0 0 5 ) . E ff ect of t h e 9 7 / 9 8 E l N i n o o n C h l o r op h yl l - a V a r i a b i l i t y A l o n g t h e S o u t h e r n C o a s t o f J a v a a n d S u m a t r a . O c e a n o g r a p h y. vo l 1 8 n o . 4
W y r t k i , K . ( 1 9 6 1 ) . P h y s i c a l O c e a n o g r a p h y o f t h e S o u t h e a s t A s i a n W a t e r s . S ci en t i f i c R es u l t o f M a r i n e In v es t i g a t i o n s o f t h e S o u t h C h i n a S ea a n d t h e G u l f o f T h a i l a n d . 1 9 5 9 - 1 9 6 1 . N a g a R e p o r t . V o l . 2 . T h e U n i v e r s i t y o f C a l i f o r n i a . S cr i p p s In s t i t u t i o n o f O c ea n o g r a p h y . L a J o l l a , C a l i f o r n i a . p p . 6 2 -19 5 . W y r t k i , K ( 2 0 0 5 ) . D i s c o v e r y t h e I n d o n e s i a n T h r o u g h f l o w .
O c e a n o g r a p h y . v o l . 1 8 . n o .4 )