Population Structures observed by
Small-areas in Indonesia
Yasuko Hayase, Dr.
JICA Expert
Population Structure
There are various types of population structure such as age and sex status, marital status, literacy and educational status, employment status,
religion status and etc., recorded as the results of a population census, which shows static aspects of a characteristics of a population in a small areas or in a country.
Age and sex structure constitutes most basic and fundamental structure among various types of population structure.
3
Population size of Kecamatan in
D.I.Yogyakarta
Among 75 Kecamatan
1. Kecamatan with the largest population:
DEPOK: 158,264
2. Kecamatan with the smallest population:
PAKUALAMAN: 10,593
3. Median population size: 35,165
4
1
1
1
1.
.
.Sex composition of the population
.
1.1 Uses of sex classification
The sex classification is very important and useful
in population and gender issues as well as in many types of planning, both public and private.
Educational status, labor force status, health status and etc. require separate population data for males and females for the planning.
The balance of the sexes affects social and economic
5
1.2 Sex ratio
An important indicator to summarize the sex composition of a population is sex ratio.
Sex ratio = (M / F) x 100
where: M=the number of males F= the number of females
The ratio more than 100 means an excess of males
over females,
The ratio less than 100: means an excess of females
over males.
The sex ratio of a “closed” population, which is not
affected by the migratory movement of the population, is usually very close to 100 on the whole.
The sex ratio at birth:approximately 105.
: an excess of males over females by 5%.
Because of higher mortality rates among males than among females in general, this excess of males at birth is reduced gradually with advance in age.
7
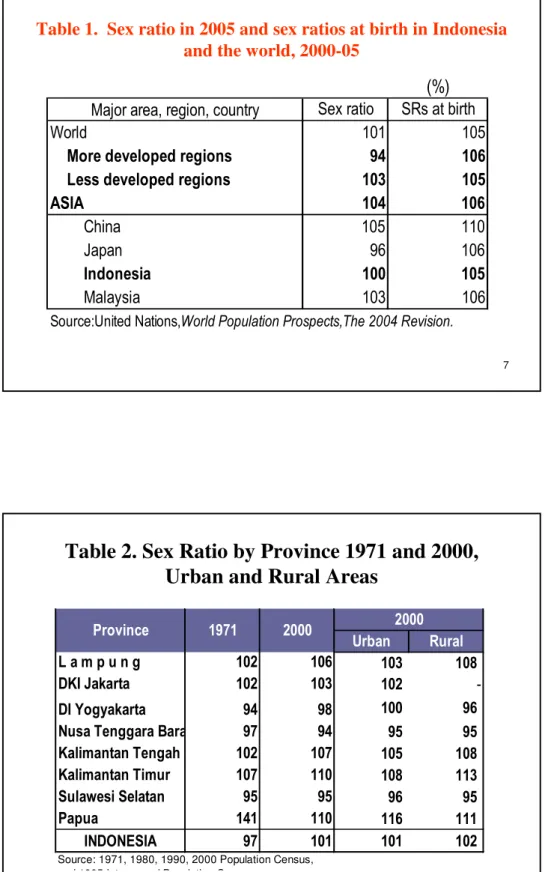
Table 1. Sex ratio in 2005 and sex ratios at birth in Indonesia and the world, 2000-05
(%)
Major area, region, country Sex ratio SRs at birth
World 101 105
More developed regions 94 106
Less developed regions 103 105
ASIA 104 106
China 105 110
Japan 96 106
Indonesia 100 105
Malaysia 103 106
Source:United Nations,World Population Prospects,The 2004 Revision.
8
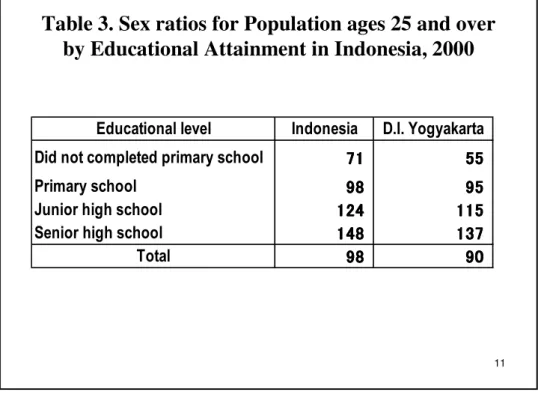
Table 2. Sex Ratio by Province 1971 and 2000, Urban and Rural Areas
Urban Rural
L a m p u n g 102 106 103 108
DKI Jakarta 102 103 102
-DI Yogyakarta 94 98 100 96
Nusa Tenggara Barat 97 94 95 95
Kalimantan Tengah 102 107 105 108
Kalimantan Timur 107 110 108 113
Sulawesi Selatan 95 95 96 95
Papua 141 110 116 111
INDONESIA 97 101 101 102
Source: 1971, 1980, 1990, 2000 Population Census, and 1995 Intercensal Population Census.
2000
1971 2000
9
1.3 Sex ratio by Province in Indonesia
Provinces with high sex ratios (=> 105) in 1971
Riau, Jambi, Kalimantan Timur, Sulawesi Tengah and Papua
Provinces with low sex ratios (=< 95) in 1971
Sumatora Barat, Jawa Tengah, Jawa Timur, Sulawesi Selatan and Sulawesi Tenggara
Provinces with high sex ratios (=> 105) in 2000
Lampung, Kalimantan Barat, Kalimantan Tengah, Kalimantan Timur, Sulawesi Utara, Sulawesi Tengah, Maluku Utara and Papua
Provinces with low sex ratios (=< 95) in 2000
Nusa Tenggara Barat and Sulawesi Selatan
1.4 Sex ratio by Kecamatan in D.I.Yogyakarta, 2000
Among 75 Kecamatans
1. Kecamatans with high sex ratios (=> 105) :
DEPOK(112), MLATI and WIROBRAJAN
2. Kecamatans with median sex ratios(97)
:WONOSARI and other 6 kecamatans
3. Kecamatans with low sex ratios (=< 95) :GONDOMANAN(86) and other 19 kecamatans
11
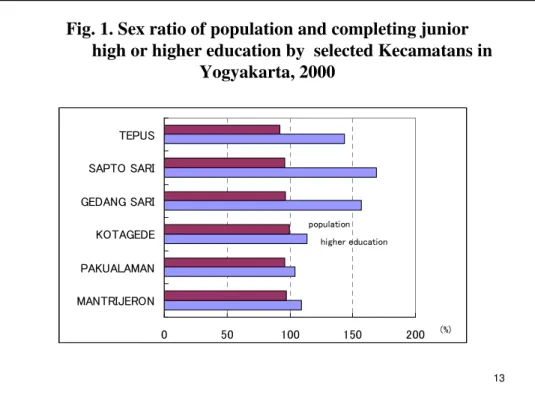
Table 3. Sex ratios for Population ages 25 and over by Educational Attainment in Indonesia, 2000
Educational level Indonesia D.I. Yogyakarta Did not completed primary school 71717171 55555555 Primary school 98989898 95959595 Junior high school 124124124124 115115115115 Senior high school 148148148148 137137137137 Total 98989898 90909090
12
Table 4. Sex ratios of various indicators by
Kecamatans in D.I. Yogyakarta, 2000
Total Total Total Total Population PopulationPopulation Population Compleing Compleing Compleing Compleing junior high junior highjunior high junior high or higher or higher or higher or higher education educationeducation education Working WorkingWorking Working population population population
population Un-paidUn-paidUn-paidUn-paidworkerworkerworkerworker MANTRIJERON MANTRIJERONMANTRIJERON MANTRIJERON 97979797 109109109109 131131131131 26262626 93.893.893.893.8 PAKUALAMAN PAKUALAMAN PAKUALAMAN PAKUALAMAN 96969696 104104104104 121121121121 26262626 92.592.592.592.5 KOTAGEDE KOTAGEDE KOTAGEDE KOTAGEDE 100100100100 113113113113 133133133133 28282828 91.891.891.891.8 GEDANG SARI GEDANG SARI GEDANG SARI GEDANG SARI 97979797 157157157157 94949494 25252525 13.213.213.213.2 SAPTO SARI SAPTO SARI SAPTO SARI SAPTO SARI 96969696 169169169169 90909090 23232323 9.39.39.39.3 TEPUS TEPUS TEPUS TEPUS 92929292 144144144144 88888888 31313131 5.65.65.65.6 Kecamatan Kecamatan Kecamatan Kecamatan Sex SexSex
Sex ratio Mratio Mratio Mratio M////FFFF****100 100 100 100
% of industry % of industry % of industry % of industry and andand
and servicesservicesservicesservices to total to total to total to total workers workers workers workers
13
Fig. 1. Sex ratio of population and completing junior high or higher education by selected Kecamatans in
Yogyakarta, 2000 0 50 100 150 200 MANTRIJERON PAKUALAMAN KOTAGEDE GEDANG SARI SAPTO SARI TEPUS (%) population higher education
Fig. 2. Sex ratio of population and working population by selected Kecamatans in Yogyakarta, 2000
0 50 100 150 MANTRIJERON PAKUALAMAN KOTAGEDE GEDANG SARI SAPTO SARI TEPUS (%) population working population
15
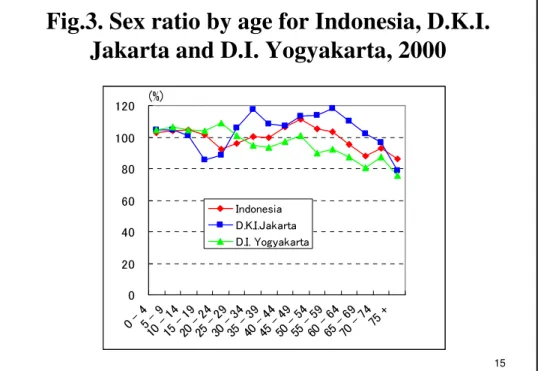
Fig.3. Sex ratio by age for Indonesia, D.K.I.
Jakarta and D.I. Yogyakarta, 2000
0 20 40 60 80 100 120 0 - 4 5 - 9 10 - 14 15 - 19 20 - 24 25 - 29 30 - 34 35 - 39 40 - 44 45 - 49 50 - 54 55 - 59 60 - 64 65 - 69 70 - 74 75 + Indonesia D.K.I.Jakarta D.I. Yogyakarta (%) 16
2.
Age composition of the population
Fig. 4. Age Composition in the Asian countries, 2005
0% 20% 40% 60% 80% 100% Indonesia China Japan India 0 - 14 15 - 64 65 +
17
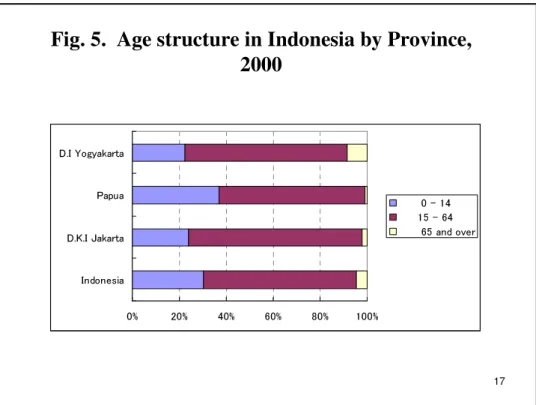
Fig. 5. Age structure in Indonesia by Province, 2000 0% 20% 40% 60% 80% 100% Indonesia D.K.I Jakarta Papua D.I Yogyakarta 0 - 14 15 - 64 65 and over
2.2 Child –woman Ratio
Child –woman ratio= P0 – 4 / F15 – 49x 100 where P0 – 4 : population at ages 0 – 4
F15 – 49: females at ages 15 – 49
Child–woman ratio is useful as an indicator of a
certain aspect of the age structure in connection with fertility potential. It is an alternate indicator for the fertility in the country where vital statistics is not available.
19
Table 5. Child Woman Ratio and Total
Fertility Rate, 2000
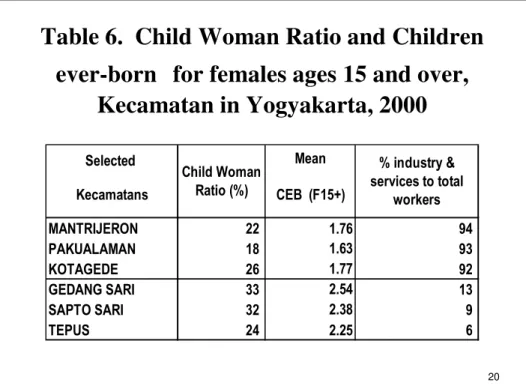
C WR (% ) C WR (% ) C WR (% ) C WR (% ) TFRTFRTFRTFR I n do n e si a I n do n e si a I n do n e si a I n do n e si a 3 63 63 63 6 2 .5 92 .5 92 .5 92 .5 9 D.K .I J a ka r t a D.K .I J a ka r t a D.K .I J a ka r t a D.K .I J a ka r t a 2 62 62 62 6 2 .0 02 .0 02 .0 02 .0 0 Pa pu a Pa pu a Pa pu a Pa pu a 4 74 74 74 7 2 .9 62 .9 62 .9 62 .9 6 D.I Yo gy a ka r t a D.I Yo gy a ka r t a D.I Yo gy a ka r t a D.I Yo gy a ka r t a 2 62 62 62 6 2 .0 02 .0 02 .0 02 .0 0 20Table 6. Child Woman Ratio and Children
ever-born
for females ages 15 and over,
Kecamatan in Yogyakarta, 2000
Selected Mean Kecamatans CEB (F15+) MANTRIJERON 22 1.76 94 PAKUALAMAN 18 1.63 93 KOTAGEDE 26 1.77 92 GEDANG SARI 33 2.54 13 SAPTO SARI 32 2.38 9 TEPUS 24 2.25 6 Child Woman Ratio (%) % industry & services to total workers21
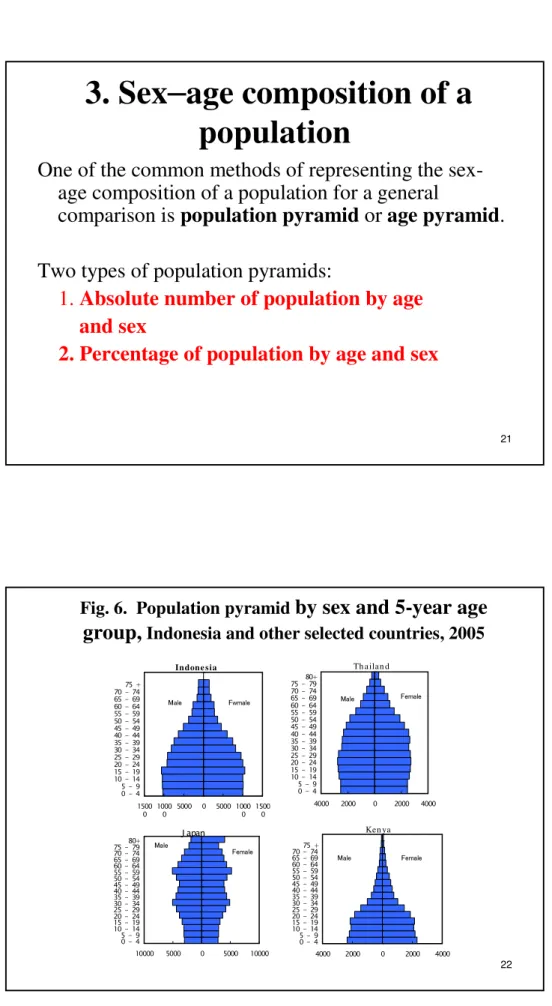
3. Sex
–age composition of a
population
One of the common methods of representing the sex-age composition of a population for a general
comparison is population pyramid or age pyramid. Two types of population pyramids:
1. Absolute number of population by age
and sex
2. Percentage of population by age and sex
Fig. 6. Population pyramid by sex and 5-year age
group,Indonesia and other selected countries, 2005
Indone sia 1500 0 1000 0 5000 0 5000 1000 0 1500 0 0 - 4 5 - 9 10 - 14 15 - 19 20 - 24 25 - 29 30 - 34 35 - 39 40 - 44 45 - 49 50 - 54 55 - 59 60 - 64 65 - 69 70 - 74 75 + Male Fwmale Th a ila n d 4000 2000 0 2000 4000 0 - 4 5 - 9 10 - 14 15 - 19 20 - 24 25 - 29 30 - 34 35 - 39 40 - 44 45 - 49 50 - 54 55 - 59 60 - 64 65 - 69 70 - 74 75 - 79 80+ Male Female J apan 10000 5000 0 5000 10000 0 - 4 5 - 9 10 - 14 15 - 19 20 - 24 25 - 29 30 - 34 35 - 39 40 - 44 45 - 49 50 - 54 55 - 59 60 - 64 65 - 69 70 - 74 75 - 79 80+ Male Female Ken ya 4000 2000 0 2000 4000 0 - 4 5 - 9 10 - 14 15 - 19 20 - 24 25 - 29 30 - 34 35 - 39 40 - 44 45 - 49 50 - 54 55 - 59 60 - 64 65 - 69 70 - 74 75 + Male Female
23
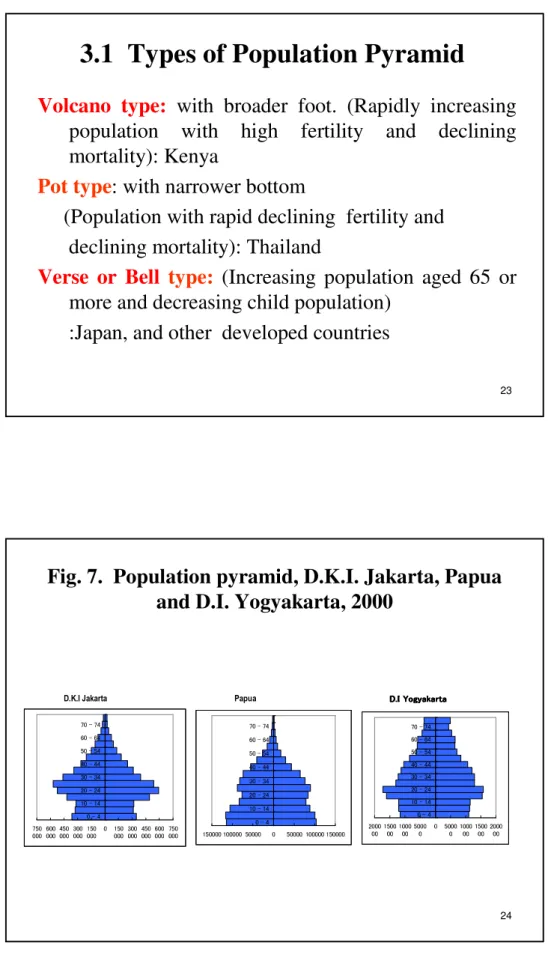
3.1 Types of Population Pyramid
Volcano type: with broader foot. (Rapidly increasing
population with high fertility and declining mortality): Kenya
Pot type: with narrower bottom
(Population with rapid declining fertility and declining mortality): Thailand
Verse or Bell type: (Increasing population aged 65 or
more and decreasing child population) :Japan, and other developed countries
24
Fig. 7. Population pyramid, D.K.I. Jakarta, Papua and D.I. Yogyakarta, 2000
D.K.I Jakarta Papua D.I YogyakartaD.I YogyakartaD.I YogyakartaD.I Yogyakarta
750 000600000450000300000150000 0 150000300000450000600000750000 0 - 4 10 - 14 20 - 24 30 - 34 40 - 44 50 - 54 60 - 64 70 - 74 150000 100000 50000 0 50000 100000 150000 0 - 4 10 - 14 20 - 24 30 - 34 40 - 44 50 - 54 60 - 64 70 - 74 2000 00 150000100000 50000 0 50000 100000 150000 200000 0 - 4 10 - 14 20 - 24 30 - 34 40 - 44 50 - 54 60 - 64 70 - 74
25
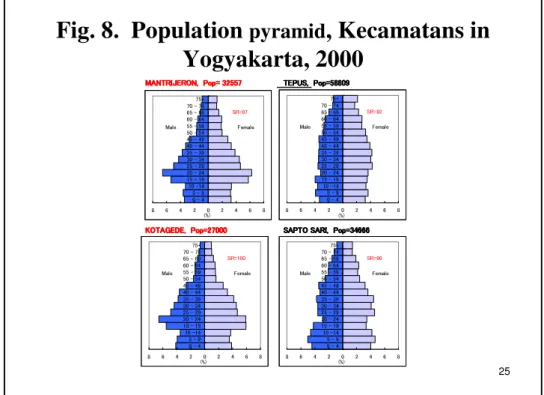
Fig. 8. Population
pyramid, Kecamatans in
Yogyakarta, 2000
MANTRIJERON, Pop= 32557 MANTRIJERON, Pop= 32557 MANTRIJERON, Pop= 32557
MANTRIJERON, Pop= 32557 TEPUS, Pop=58809 TEPUS, Pop=58809 TEPUS, Pop=58809 TEPUS, Pop=58809
KOTAGEDE, Pop=27000 KOTAGEDE, Pop=27000 KOTAGEDE, Pop=27000
KOTAGEDE, Pop=27000 SAPTO SARI, Pop=34666 SAPTO SARI, Pop=34666 SAPTO SARI, Pop=34666 SAPTO SARI, Pop=34666
8 6 4 2 0 2 4 6 8 0 - 4 5 - 9 10 -14 15 - 19 20 - 24 25 - 29 30 - 34 35 - 39 40 - 44 45 - 49 50 - 54 55 - 59 60 - 64 65 - 69 70 - 7475+ Male Female (%) SR=97 8 6 4 2 0 2 4 6 8 0 - 4 5 - 9 10 -14 15 - 19 20 - 24 25 - 29 30 - 34 35 - 39 40 - 44 45 - 49 50 - 54 55 - 59 60 - 64 65 - 69 70 - 7475+ Male Female (%) SR=92 8 6 4 2 0 2 4 6 8 0 - 4 5 - 9 10 -14 15 - 19 20 - 24 25 - 29 30 - 34 35 - 39 40 - 44 45 - 49 50 - 54 55 - 59 60 - 64 65 - 69 70 - 7475+ Male Female (%) SR=100 8 6 4 2 0 2 4 6 8 0 - 4 5 - 9 10 -14 15 - 19 20 - 24 25 - 29 30 - 34 35 - 39 40 - 44 45 - 49 50 - 54 55 - 59 60 - 64 65 - 69 70 - 7475+ Male Female (%) SR=96
Conclusion
The features and uses of age and sex structure which constitutes most basic structure are illustrated here mainly based on kecamatans in D.I.Yogyakarta.
We can also utilize other types of population structure such as marital status, literacy and educational status observed in small areas for the local planning in both public and private sectors.