Switching Phenomenon in Six-Phase Transmission System
H. Ahmad
1, M. I. Jambak
2, K. Y. Lau
3, M. K. N. Mohd Sarmin
4, S. S. Ahmed
5, M. A. B. Sidik
6Abstract– Converting a three-phase transmission line into a six-phase one is one of the feasible approaches to increase the power transfer capability of existing three phase double circuit transmission networks. However, this will impact the existing tower insulation. One of the main concerns is switching overvoltages that occur in transmission lines due to the opening and closing of circuit breakers. This paper aims to investigate into the switching phenomenon that would occur in a six-phase transmission system. Till now such an investigation using a laboratory replica of a practical transmission network is yet to be reported. In this work one of the transmission lines belonging to the Malaysian national utility i.e., Tenaga Nasional Berhad’s (TNB) has been investigated as a six phase line through simulations as well as an experimental prototype. It is the 113.1 km long 132 kV three-phase double circuit transmission line between Gua Musang and Kuala Krai in Kelantan, Malaysia. A comparison between simulation and experimental results is also given. The work is expected to enhance the understanding of the changes in switching overvoltages due to conversion of a three phase transmission line into a six-phase line. Copyright © 2011 Praise Worthy Prize S.r.l. - All rights reserved.
Keywords:Switching Phenomenon, Six-Phase Transmission, High Phase Order Transmission Line, Power Delivery
I.
Introduction
Increased demand for electrical power has necessitated an increase in the power delivery capability of the existing transmission system. There are several approaches that can be used to increase the amount of power transmitted through an existing transmission line circuit [1]-[3]. However, the decision to upgrade existing transmission line is often constrained by the difficulties in acquiring new Rights-of-Way (ROW), the social and environmental concerns, and the high cost involved to acquire new lands. Such limitations have led to concept of increasing the number of phases in a transmission line system circuit known as multiphase system or high phase order (HPO). In other words, it is the technique of converting an existing three phase transmission line to a six phase transmission line (SPTL), which is also known as high phase order transmission line (HPOTL).
Although HPOTL has been proposed for several decades [4]-[18], this concept is uncommon because electric utilities tend to be conservative in their approach towards unproven technologies. However, the increasing difficulty in obtaining transmission ROW and the encouraging fact that six-phase transmission line can carry more electric power compared to three-phase transmission line for the same operating voltage has led to a renewed interest in HPOTL.
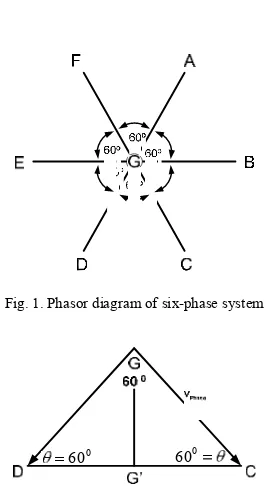
A six-phase transmission system is defined as a system that has six voltages spaced by 600 in time [6], [13]. The phasor diagram of phase-to-phase voltages and phase-to-ground voltages are shown in Figure 1 and Figure 2 respectively.
Fig. 1. Phasor diagram of six-phase system
0
60 600
Fig. 2. Phasor diagram of adjacent phase-phase voltages in six-phase system
can be used to form three-to-six-phase and six-to-three-phase conversion transformers [19]-[22].
Though six phase conversion of a three phase line will not involve change of ROW, it will have effect on the existing tower insulation. One of the main insulation concerns is switching over-voltages [10], [12], [13], [15], [21] that occur in transmission lines due to the opening and closing of circuit breakers. The most frequent causes of switching over-voltages are faults or ground fault clearing, line energization, load interruption, interruption of inductive current, and switching of capacitors. It appears that till now the switching overvoltages likely to result from three to six phase conversion of a practical line have not yet been investigated using both simulation and experimental replicas. Although the professional software being used for simulations have already matured enough with respect to traditional three phase system their applicability for the unconventional six phase system requires further exploration. This necessitates a comparison between simulation and experimental models. Moreover, an experimental model is always helpful in understanding the practical aspects in designing and implementing a new technology like the six phase line.
In this paper one of the double circuit three phase transmission lines in the network of the Malaysia national utility i.e., Tenaga Nasional Berhad’s (TNB) has been studied to determine switching overvoltages considering its six phase conversion through developing a simulation model as well as a laboratory replica termed Scaled-Down Power Transmission Line Model (SDPTLM). The line is a 132 kV three-phase double circuit transmission line between Gua Musang and Kuala Krai in Kota Bahru region, Kelantan, Malaysia with a total length of 113.1 km. The simulation and experimental results have been compared to gain an insight into the severity of switching phenomena and probable impact upon insulation in a six-phase transmission system.
II.
Description of the Line
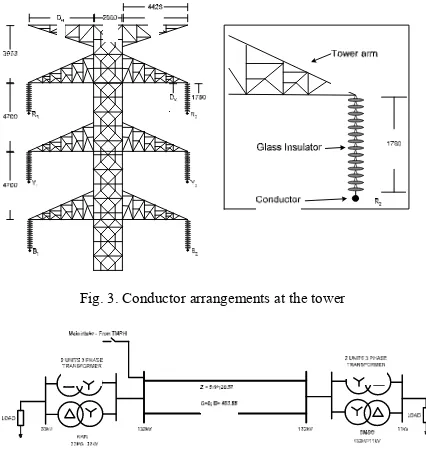
The 132 kV double circuit line runs from the Kuala Krai (KKRI) Substation to the Gua Musang (GMSG), Kelantan region in Malaysia. The total length is approximately 113.1km. The total number of towers is 294. The minimum, average and the maximum actual span lengths are 130 m (Tower No. 105), 384 m (Tower No. 242) and 850 m (Tower No. 251) respectively depending on the land profile. The T23 series tower family is used where it is a self-supportive lattice tower. The towers are divided into six categories as shown in Table I. Figure 3 shows conductor arrangement and clearance distance of the existing line at a typical tower.
The conductor for phase line used in the transmission line is Aluminium Conductor Steel Reinforced (ACSR) 300 mm2 known as “Batang”. The earth wire used is ACSR 60 mm2 named as “Skunk”. Two earth wires are used per tower, one on each side.
TABLE I
TOWER TYPES AND DEVIATION ANGLE (SUMMARIZED FROM MATERIAL
SCHEDULE-TNB CONTRACT NO.242/92)
No Tower Type Angle Deviation
1 Suspension Tower 0o – 2o
2 Section Tower (Tension) 2o – 10o
3 Medium Tower (Tension) 10o – 30o
4 Heavy Tower (Tension) 30o – 60o
5 Right Tower (Tension) 60o – 90o
6 Terminal Tower (Tension) 0o – 10o
There are two transformers at each of the two substations KKRI and GMSG. The capacity of each transformer is 15 MVA. Figure 4 shows the transformers located at KKRI and GMSG substations and the line in the three phase mode of operation.
Fig. 3. Conductor arrangements at the tower
Fig. 4. Conductor arrangements at the tower
II.1. Digital Modelling and Simulation of Six-Phase Transmission System
The system for the simulation studies is the existing three-phase double circuit line from KKRI to GMSG considerered to be converted into a six-phase line. In this study KKRI was considered as the sending-end substation while GMSG was assumed to be the receiving-end substation.
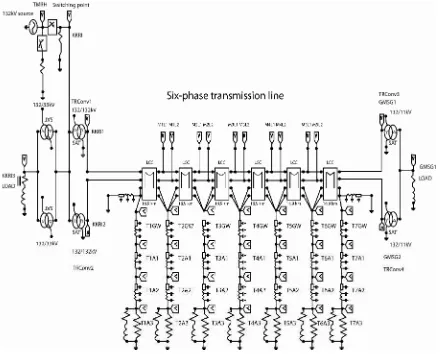
In the modelling of the six-phase system by means of ATPDraw, the basic modelling design was based on Figures 5 for the phase conversion. Figure 6 shows the general simulation component arrangement for the six-phase system with the line being represented by 6 segments each corresponding to 18.85 km. All the components were modelled using appropriate dialog boxes of the ATP/EMTP software taking into account their frequency dependence and influences upon surge propagation characteristics.
The system model was subjected to steady state operation with 132 kV supply of 50 Hz frequency followed by the application of switching i.e., energization and de-enerzization operations. Transient voltage signatures were recorded simultaneously at various points of observation along the lines.
(a)
(b)
Figs. 5. KKRI to GMSG line in six phase mode (a) transformer conversion arrangement and (b) phasor diagram
II.1.1. Six-Phase Steady State Simulation
Figure 6 shows the simulation circuit of the six-phase line using ATP/EMTP software. However, the switches are not needed to simulate steady state. The incoming 132kV supply coming from Tanah Merah substation (TMRH) is represented by three-phase source located at the top of left side. No circuit breaker was modelled in this simulation. Two units identical in terms of parameter 132/132kV “ -Y” and 132/132kV “ -Y180o” were added to the KKRI substation as three to six phase conversion transformers. The same method was used at GMSG substation, 132/11kV “Y- ” and 132/11kV “Y180o- ” is installed as converter from six-phase to three-phase. There are four categories of voltage in this simulation – phase-to-ground spaced by 60o, phase-to-phase spaced by 60o, phase spaced by 120o, and phase-to-phase spaced by 180o. The voltage was monitored at three locations – sending-end (KKRI substation), middle of line, and receiving-end substation (GMSG substation).
II.1.2. Six-Phase Switching Energization Simulation
Switching energization of the six-phase system transmission lines was performed by closing the circuit
breaker at the incoming line of the high phase transformer as shown in Figure 6. For the three-phase switching energization at CB-1 (i.e., intake from Tanah Merah) the closing time of circuit breaker was set at 0.03333 second, 0.0361 second and 0.0388 second for phase “R”, phase “Y”, phase “B” respectively in the corresponding dialog box. For the subsequent opening operation the time was set at 10 seconds for all phases in the same dialog box. In this case both circuit 1 (phase A, C, and E) and circuit 2 (phase B, D, and F) of the transmission line were simultaneously energized via TRConv-1 and TRConv-2. V-probe KKRI1 and KKRI2 were aimed to measure and capture voltage waveforms at sending-end circuit 1 busbar and sending-end circuit 2 busbar. V-probe at M2L2, M3L1, GMSG1 and GMSG2 were used to measure voltage at the middle point and the receiving-end respectively.
II.1.3. Six-Phase Switching Energization Simulation
De-energization operation was aimed to investigate the six-phase system transient response when the supply was suddenly tripped off. All the components and arrangement were the same as with the energization simulation in Figure 6. The already closed condition of the line was set by specifying the CB1 closing time at -10 seconds for all the phases in the corresponding dialog box. The de-enerzization operation of the three phase supply was then simulated at the same circuit breaker by setting the opening time at 0.03333 second, 0.0361 second and 0.0388 second for the phase “R”, phase “Y”, phase “B” respectively in the same dialog box In this case, both circuit 1 (phase A, C, and E) and circuit 2 (phase B, D, and F) of the transmission line were de-energized at the same time with the aid of TRConv-1 and TRConv-2. V-probes were used to measure and capture the voltage waveform at the same points as in the switching energization simulation mentioned in Sec.2.1.2.
II.2. Experimental Setup
An experimental prototype for the considered line has been developed in line with the environment of a real life line and termed ‘Scaled-Down Power Transmission Line Model’ (SDPTLM). The experimental exercises were mainly focused on switching transient overvoltage study.
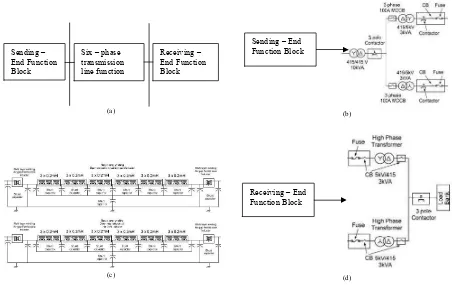
The SDPTLM for the considered three phase double circuit transmission line has some form of versatile and user friendly features. The versatility is that the SDPTLM can be converted to a six-phase system. It consists of seven major components – transformer, towers, inductors, switching unit, protection unit, artificial earth and insulator. Figures 7 show the diagram of the proposed SDPTLM structure.
It can be seen in the left side of Figures 7 that the source from TNB to the SDPTLM is connected via the coupling transformer rated 415V/415V, 10kVA and then connected to a three pole/three phase mode contactor. This first contactor was proposed for remote switching operation at the incoming line of the SDPTLM. Two-unit MCCB 100A was used for select-mode switch for the high phase transformer. The second contactor was a three pole/single phase mode proposed for remote switching operation of each of the phase line, while combination of MCB and fuse was used for over current protection of the line.
(a) (b)
(c) (d)
Figs. 7. Structure of SDPTLM: (a) block diagram, (b) model of the sending end substation, (c) model of the transmission line, (d) model of the receiving end substation
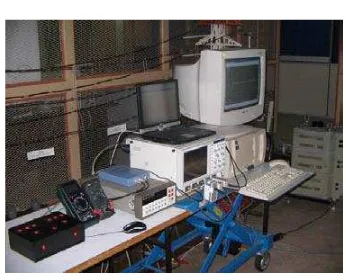
The single line diagram of the experimental arrangement for the steady state and switching transient is shown in Figure 8. The three phase supply from TNB was connected to the variable transformer (Variac). The variable transformer was used as adjustable voltage controller for the incoming three phase bus-bar. The measurement points chosen were the sending-end, middle of the line and the receiving-end point. Figures 9,10 and 11 respectively shows a typical wiring diagram of the measurement set-up, the pictorial view of the measuring equipment and the pictorial view of the
developed SDPTLM tower. Fig. 8. Single line diagram of the experimental setup
Receiving – End Function Block
Sending – End Function Block Sending –
End Function Block
Six – phase transmission line function
Fig. 9. Typical wiring diagram of the measurement set-up
Fig. 10. Pictorial view of measuring equipments
II.2.1. Six-Phase Steady State Experimental Procedures
The essential steps and procedures for steady state operation are given in this section. The experiment was intended to observe:
a. The magnitude of ground and phase-to-phase voltage under steady state condition.
b. The difference between the sending-end bus-bar, middle point of the line, and the receiving-end bus-bar voltages.
Procedures:
i) Set-up the SDPTLM and the measuring devices. All the MCCB are in close position.
ii) Set all DSO and PicoScope Time/Division setting at 5ms.
iii) Set all DSO and PicoScope Trigger menu setting at
“Auto”.
iv) Set-up the measuring device to measure the phase-to-ground voltage. Connect the input of HV probe to the measurement point.
v) Make sure the control switch relay driver still in off position.
vi) Make sure the variac is set at the minimum position, then turn-on the variac.
vii) Turn the variac slowly until the voltage at the high voltage side of sending-end busbar reaches 4.082 kV (phase-to-ground) corresponding to 132 / 3 kV in the actual system.
viii) Switch on the control switch relay driver.
ix) Measure and record all the voltage oscillogram at each phase and each locations.
x) Measure the phase-to-phase voltage.
Fig. 11. Pictorial view of the developed SDPTLM tower
II.2.2. Six-Phase Switching Operation Experimental Procedures
This section describes the operation of the six-phase SDPTLM under switching-on (energization) and switching-off (de-energization) conditions. This experiment was intended to observe:
a. The peak magnitude of the phase-to-ground and the phase-to-phase voltage under switching condition. b. The differences between the sending-end bus-bar,
middle point of the line, and the receiving-end bus-bar peak voltage.
The experimental arrangement was similar to the steady state (as described in Sec. 2.2.1). The only difference was in the use of the control switch driver (to simulate switching operation). Therefore, step (iii) of Section 2.2.1 was replaced to become as follows: Set all DSO and PicoScope Trigger menu setting at “Normal”, and slope voltage window 4.5kV. Meanwhile, step (viii) of Section 2.2.1 was replaced as follows: Actuate the control switch relay driver “on-off-on-off” continuously for 50 times.
For the switching mode test, 50 sets of both energization and de-energization operations were carried out as described in the procedure (viii). These tests were conducted in order to obtain the highest peak magnitude of the transient overvoltage due to closing circuit breakers corresponding to a main voltage of 4 kV.
III.
Results and Discussion
III.1. Steady State Condition
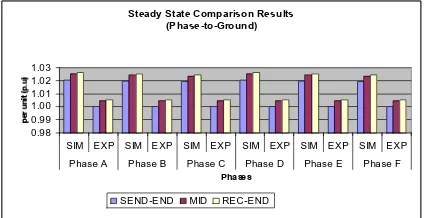
Steady state simulation and experimental results on peak voltage magnitudes at the sending end, middle and the receiving end of the proposed six phase line are shown in Figures 12 to 15 respectively for phase-to-ground and phase-to-phase (adjacent phases spaced by 60o, phase-to-phase spaced by 120o and 180o) voltages. It
was found that the mismatch between the experimental results and simulation results was in the range of only 1% to 2%. These mismatches were mainly due to the difficulty of finding and using in the experimental Scaled-Down Power Transmission Line Model (SDPTLM) the inductors and capacitors of same values as used in the simulation. Both simulation and experimental results showed that the voltage followed a rising trend starting from sending end towards the receiving end. This is mainly due to the Ferranti effect that is experienced when a line is lightly loaded i.e., the load at the receiving-end being is very small compared to the line capacity.Furthermore, the phase to phase voltage increased in general with the phase spacing i.e. about 2.05 p.u. for 180o , 1.78 p.u. for 120o and 1.03 p.u. for 60o.
III.2. Switching Transients
Figures 16 to 21 show the histograms comparing simulation and experimental results for peak voltage occurring at the sending end, middle and the receiving end of the proposed six phase line due to simultaneous energization of both phase group conductors (i.e. phase A, C, E in one group and phase B, D, F in the other group). Similarly Figures 22 to 27 show the histograms comparing simulation and experimental results for simultaneous de-energization of both phase groups. Both simulation and experimental values were in close agreement and also showed that resulting energization as well as de-energization voltage followed the same trend as the steady state one i.e. increase from sending end towards the receiving end and increase with phase spacing. In general the phase-to-phase voltage transients for energization ranged from around 2.0 p.u. to 4.5 p.u. while the same for de-energization ranged from around 2.5 p.u. to 7.3 p.u. Also noteworthy is that the positive and negative peaks were almost close to each other excepting for some of the 180o spaced phases during de-energization operation when negative peaks were less than their positive counterparts. Tables II and III respectively shows the maximum p.u. values of the switching voltages obtained through simulations and experiments.
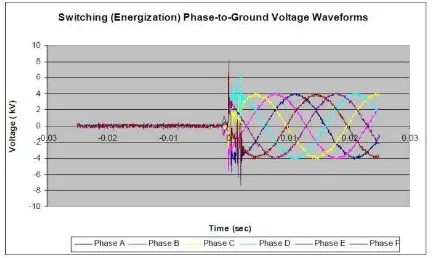
Figures 28 to 31 show as representative cases the waveforms captured through the simulation and the experimental models for energization and de-energization of the line respectively. It is noteworthy that the actual kV values obtained in the simulation waveform corresponding to the case in Figure 30 are actually 2.75 times the plotted values.
Fig. 12. Steady state comparison for phase-to-ground peak voltage
Fig. 13. Steady state comparison for peak voltage phase-to-phase spaced 60o
Fig. 14. Steady state comparison for peak voltage phase-to-phase spaced 120o
Fig. 15. Steady state comparison for peak voltage phase-to-phase spaced 180o Phase A Phase B Phase C Phase D Phase E Phase F
Phases
SIM EXP SIM EXP SIM EXP SIM EXP SIM EXP SIM EXP Phase AB Phase BC Phase CD Phase DE Phase EF Phase FA
Phases
SIM EXP SIM EXP SIM EXP SIM EXP SIM EXP SIM EXP Phase AC Phase CE Phase EA Phase BD Phase DF Phase FB
Phases
SIM EXP SIM EXP SIM EXP Phase AD Phase BE Phase CF
Fig. 16. Switching energization comparison for phase-to-ground positive peak voltage
Fig. 17. Switching energization comparison for phase-to-ground negative peak voltage
Fig. 18. Switching energization comparison for phase-to-phase spaced 60o positive peak voltage
Fig. 19. Switching energization comparison for phase-to-phase spaced 120o positive peak voltage
Fig. 20. Switching energization comparison for phase-to-phase spaced 180o positive peak voltage
Fig. 21. Switching energization comparison for phase-to-phase spaced 180o negative peak voltage
Fig. 22. Switching de-energization comparison for phase-to-ground positive peak voltage
Fig. 23. Switching de-energization comparison for phase-to-ground negative peak voltage
SIM EXP SIM EXP SIM EXP SIM EXP SIM EXP SIM EXP Phase A Phase B Phase C Phase D Phase E Phase F
Phases
SIM EXP SIM EXP SIM EXP SIM EXP SIM EXP SIM EXP Phase A Phase B Phase C Phase D Phase E Phase F
Phases SEND-END MID REC-END
Switching Energization Comparison Results (Phase-to-Phase Spaced 60o: Positive Polarity)
0
SIM EXP SIM EXP SIM EXP SIM EXP SIM EXP SIM EXP Phase AB Phase BC Phase CD Phase DE Phase EF Phase FA
Phases SEND-END MID REC-END
Switching Energization Comparison Results (Phase-to-Phase Spaced 120o: Positive Polarity)
0
SIM EXP SIM EXP SIM EXP SIM EXP SIM EXP SIM EXP
AC CE EA BD DF FB
Phases SEND-END MID REC-END
Switching Energization Comparison Results (Phase-to-Phase Spaced 180o: Positive Polarity)
0
SIM EXP SIM EXP SIM EXP Phase AD Phase BE Phase CF
Phases SEND-END MID REC-END
Switching Energization Comparison Results (Phase-to-Phase Spaced 180o: Negative Polarity)
0
SIM EXP SIM EXP SIM EXP Phase AD Phase BE Phase CF
Phases
SIM EXP SIM EXP SIM EXP SIM EXP SIM EXP SIM EXP Phase A Phase B Phase C Phase D Phase E Phase F
Phases
SIM EXP SIM EXP SIM EXP SIM EXP SIM EXP SIM EXP Phase A Phase B Phase C Phase D Phase E Phase F
Fig. 24. Switching de-energization comparison for phase-to-phase spaced 60o positive peak voltage
Fig. 25. Switching de-energization comparison for phase-to-phase spaced 120o positive peak voltage
Fig. 26. Switching de-energization comparison for phase-to-phase spaced 180o positive peak voltage
Fig. 27. Switching de-energization comparison for phase-to-phase spaced 180o negative peak voltage
Fig. 28. Energization phase-to-ground voltage waveform at the sending-end-point captured in the simulation
Fig. 29. Eenergiziation phase-to-ground voltage waveforms at the sending-end-point captured in the experiment
TABLE II
SUMMARY OFMAXIMUM SWITCHING PEAKMAGNITUDE INP.U. (SIMULATION)
Type of Swithcing
Location Voltage Category
P-G P-P P-P P-P
(60o) (120o) (180o)
Send-End 1.98 2.37 2.48 3.95
Energization Middle 2.12 2.53 2.57 4.25
Rec-End 2.23 2.65 2.66 4.46
Send-End 3.63 3.08 5.84 6.21
De-energization Middle 3.93 3.23 6.2 6.77
Rec-End 4.07 3.49 6.54 7.22
TABLE III
SUMMARYOFMAXIMUMSWITCHING PEAK MAGNITUDE INP.U.
(EXPERIMENTAL)
Type of Swithcing
Location Voltage Category
P-G P-P P-P P-P
(60o) (120o) (180o)
Send-End 2.02 2.42 2.53 4.04
Energization Middle 2.17 2.59 2.63 4.34
Rec-End 2.28 2.7 2.72 4.56
Send-End 3.71 3.15 5.97 6.34
De-energization Middle 4.02 3.3 6.33 6.91
Rec-End 4.15 3.56 6.67 7.37
Switching De-energization Comparison Results (Phase-to-Phase Spaced 60o: Positive Polarity)
0.00 0.50 1.00 1.50 2.00 2.50 3.00 3.50 4.00
SIM EXP SIM EXP SIM EXP SIM EXP SIM EXP SIM EXP Phase AB Phase BC Phase CD Phase DE Phase EF Phase FA
Phases SEND-END MID REC-END
Switching De-energization Comparison Results (Phase-to-Phase Spaced 120o: Positive Polarity)
0 1 2 3 4 5 6 7 8
SIM EXP SIM EXP SIM EXP SIM EXP SIM EXP SIM EXP
AC CE EA BD DF FB
Phases SEND-END MID REC-END
Switching De-energization Comparison Results (Phase-to-Phase Spaced 180o: Positive Polarity)
0 1 2 3 4 5 6 7 8
SIM EXP SIM EXP SIM EXP Phase AD Phase BE Phase CF
Phases SEND-END MID REC-END
Switching De-energization Comparison Results (Phase-to-Phase Spaced 180o: Negative Polarity)
0 1 2 3 4 5 6 7 8
SIM EXP SIM EXP SIM EXP Phase AD Phase BE Phase CF
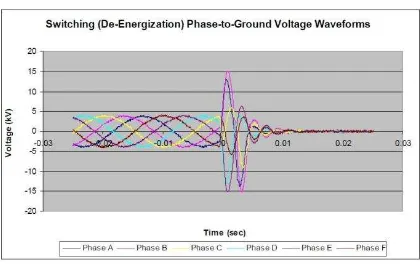
Fig. 30. De-energisation phase-to-ground voltage waveforms at the sending-end point captured in the simulation
Fig. 31. De-energiziation phase-to-ground voltage waveforms at the sending-end-point captured in the experiment
However, unlike the experimental waveform in Figure 31 the simulation waveform trend in Figure 30 for de-energization could not capture the sudden rises at the moment of opening the breakers. This is perhaps a limitation of the simulation software to model adequately the transient recovery voltage arising during opening a breaker in a six phase line.
IV.
Conclusion
The concept of six phase line is receiving renewed interest and still awaits a culmination point in the research effort before it is implemented commercially. In this work for the first time an experimental replica termed a scaled-down power transmission line model (SDPTLM) has been designed, implemented and tested considering six phase conversion of a practical three phase double circuit line in the Malaysian national grid as an example. Using data acquisition gadgets and microcomputer the steady state results and switching operation voltage transients were captured at different points of the line model under lightly loaded condition. The experimental results were compared with the ATP/EMTP software based simulation results. The main conclusions are as follows:
a) The results of the digital simulations and the scaled-down experimental model of the six-phase
transmission system were in general close to each other implying validity of the proposed experimental set-up. However, unlike the experimental waveform the simulation waveform trend in for de-energization could not capture the sudden rises at the moment of opening the breakers. This is perhaps a limitation of the simulation software to model adequately the transient recovery voltage arising during opening a breaker in a six phase line.
b) The concept of per unit value used in power system studies was implemented in the development of the SDPTLM.
c) The switching surge for six-phase system specially for de-energization was found higher compared to the permissible ranges of 1.0 pu to 3.0 pu for phase-to-ground surges and 2.0 to 4.0 pu for phase-to-phase surges in a three-phase system.
d) The energization as well as de-energization voltage in the lightly loaded six phase line followed the same trend as the steady state one i.e. increase from sending end towards the receiving end and increase with phase-to-phase voltage spacing i.e. 60o, 120o and 180o .
e) In general the phase-to-phase voltage transients for energization obtained in the six phase study ranged from around 2.0 p.u. to 4.5 p.u. while the same for de-energization ranged from around 2.5 p.u. to 7.3 p.u. f) Also noteworthy is that the positive and negative
peaks in switching surges were almost close to each other excepting for some of the 180o spaced phases during de-energization operation when negative peaks were less than their positive counterparts.
Acknowledgements
The authors would like to thank the Ministry of Science, Environment and Innovation, Malaysia for providing a financial grant (IRPA VOT 74103) to conduct the research. Also the Dean, Faculty of Electrical Engineering, Universiti Teknologi Malaysia is acknowledged for the permission to publish the results of the research.
References
[1] M. El-Marsafawy, “Application of Series-capacitor and Shunt-reactor Compensation to an Existing Practical Transmission Line,” in IEE Proceedings-C, vol. 138, no. 4, 1991, pp. 330-336. [2] D. A. Woodford and M. Z. Tarnawecky, “Compensation of Long
Distance AC Transmission Lines by Shunt Connected Reactance Controllers,” IEEE Transaction Power Apparatus and System, vol. PAS-94, pp. 655-664, 1975.
[3] J. S. Grant and J. R. Stewart, “High Phase Order Ready for Application,”IEEE Transaction Power Apparatus and System, vol. PAS-101, pp. 1757-1767, 1982.
[4] L. O. Barthold and H. C. Barnes, “High Phase Order Power Transmission,”ELECTRA, no.24, pp. 139-153, 1973.
[5] S. S. Venkata, W. C. Guyker, and J. Kondragunta, ”EPPC – A Computer Program for Six Phase Transmission Line Design,” IEEE Transaction on Power Apparatus and System, vol. PAS-101, no. 7, pp. 1859-1869, 1982.
of the 1990 IEEE Southern Tier Technical Conference, 1990, pp. 31-36.
[7] B. B. Navin, S. S. Venkata, W. C. Guyker, and W. H. Booth,
“Six-Phase (Multi-Phase) Power Transmission Systems: Fault Analysis.”IEEE Transaction on Power Apparatus and Systems, vol. PAS-96, no.3, pp. 758-767, 1977.
[8] J. R. Stewart and D. D. Wilson, “High Phase Order Transmission- Feasibility Analysis. Part I- Steady State Consideration,” IEEE Transaction on Power Apparatus and Systems, vol. PAS-97, no. 6, pp. 2300-2307, 1978.
[9] S. N. Tiwari and L. P. Singh, “Mathematical Modelling and Analysis of Multi Phase Systems,”IEEE Transaction on Power Apparatus and Systems, vol. PAS-101, no.6, pp. 1784-1792, 1982. [10] D. D. Wilson and J. R. Stewart, “Switching Surges Characteristics of Six-Phase Transmission Lines,”IEEE Transaction on Power Apparatus and Systems, vol. PAS-103, no. 11, pp. 3393-3401, T. Brown, “Insulation Coordination, Environmental and System Analysis of Existing Double Circuit Line Reconfigured to Six-Phase Operation,”IEEE Transaction on Power Delivery, vol. 7, no. 3, pp. 1628-1633, 1992.
[13] R. V. Rebabpragada, M. T. Brown, T. F. Dozario, and J. R. Stewart, “Design Modification and Layout of Utility Substation for Six-Phase Transmission,” IEEE Transaction on Power Delivery, vol. 8, no. 1, pp. 24-30, 1993.
[14] S. Shahnawaz Ahmed and Mohammad Tawrit, “Analysis of the Faults Involving Adjacent Conductor of a Six-Phase Transmission Line Together with a Modeling of the Phase Conversion Transformer,” Electric Power System Research, (Switzerland), Vol. 27, No. 2, pp. 99-105, 1993.
[15] Y. H. Song, A. T. Johns and R. K. Aggarwal, “Digital Simulation of Fault Transient on Six-Phase Transmission System,” in Proceeding of 2nd International Conference on
Advances in Power System Control, Operation and Management, 1993, pp. 385-388.
[16] A. K. Mishra and A. Chandrasekaran, “Power Transfer Capability of Six-Phase Power System Under Fault Conditions,” in
Proceedings of the 26th Southeastern Symposium on System Theory, 1994, pp. 32-36.
[17] R. Billinton, S. O. Faried, and M. Fotuhi-Firuzabad, “Composite System Reliability Evaluation Incorporating a Six-Phase Transmission Line,” in IEE Proceedings of Generation, Transmission, Distribution, vol. 150, no. 4, 2003, pp. 413-419. [18] X. Chen, “Three-Phase/Six-Phase Conversion Autotransformer,”
IEEE Transaction on Power Delivery, vol. 18., no. 4, pp. 1554-1561, 2003.
[19] J. R. Stewart, L. J. Oppel, G. C. Thomann, T. F. Dorazio, and R. V. Rebbapragada, “Transformer Winding Selection Associated with Reconfiguration of Existing Double Circuit Line to Six-Phase Operation,”IEEE Transaction on Power Delivery, vol. 7, no. 2, pp. 979-985, 1992.
[20] L. P. Singh, Advanced Power Systems Analysis and Dynamics, 5th
edition. New Delhi, India: New Age International, 2007. [21] CIGRE Working Group 13-02, “Switching Overvoltages in EHV
and UHV System with Special Reference to Closing and Re-closing Transmission Lines,”Electra, vol. 30, pp. 70-122, 1973. [22] J. C. Das, Power System Analysis: Short-Circuit Load Flow and
Harmonics. New York: Marcel Dekker, 2002.
Authors
’
information
1,2,3,4,5Institute of High Voltage and High Current, Faculty of Electrical
Engineering, Universiti Teknologi Malaysia, Malaysia, Tel/Fax: +607 5535825/ 5578150
E-mail: [email protected]
2,3Department of Electrical Engineering,
Faculty of Engineering, Sriwijaya University,
Ogan Ilir, South Sumatera, Indonesia.
6Department of EEE,
Bangladesh University of Engineering and Technology.
Hussein Ahmad was born in Mersing, Johor, Malaysia. He obtained his B.Sc (Hons) and M.Sc in Electrical Enginering from the University of Strathclyde, Scotland in 1977 and 1981, respectively, and subsequently obtained his PhD degree in High Voltage Engineering from the University of Manchester (formerly UMIST) in 1986. Currently he is a Professor in the Faculty of Electrical Engineering, and the Director, Institute of High Voltage and High Current (IVAT), Universiti Teknologi Malaysia. His research interests include lightning protection, grounding system, low voltage protection and insulation performance.
Muhammad Abu Bakar Sidik was born in Palembang, South Sumatera, Indonesia. He received B.Eng (1996) in Electrical Engineering from Sriwijaya University, Indonesia in 1996 and M.Eng (2003) and Ph.D (2008) in High Voltage Engineering from Universiti Teknologi Malaysia (UTM), Malaysia. He is listed as lecturer at Sriwijaya University and researcher/lecturer in Institute of High Voltage and High Current (IVAT) in Faculty of Electrical Engineering, Universiti Teknologi Malaysia, UTM Skudai, Johor Darul Takzim, Malaysia. Dr. Sidik is a member of the Institute of Electrical and Electronics Engineers.
Muhammad Irfan Jambak was born in Palembang, Indonesia. He obtained his Sarjana Teknik (equal with B.Sc) in Electrical Engineering from Sriwijaya University in 1996. From 1995 to 1998, he worked at PT. Lapi Elpatsindo with his last position as Engineering Manager. After that, he obtained his M.Eng and PhD in Electrical Engineering at Universiti Teknologi Malaysia.
Kwan Yiew Lau was born in Miri, Sarawak, Malaysia. He received his B.Eng (First Class Hons) in Electrical Engineering from Universiti Teknologi Malaysia in 2007. Currently, he is a Tutor in the Faculty of Electrical Engineering, Universiti Teknologi Malaysia, and is pursuing his M.Eng in Electrical Power Engineering at the same university.
M. K. N. Mohd Sarmin was born in Batu Pahat, Johore, Malaysia. Prior to securing a job at MMHE Prt Ltd as an electrical engineer, he obtained his Bachelor in Electrical Engineering(Hons) at the Universiti Teknologi Malaysia. His final year project was on the simulation of a six-phase system under transient condition.