1 23
Environmental Earth Sciences
ISSN 1866-6280
Environ Earth Sci
DOI 10.1007/s12665-012-1599-x
Wet season hydrochemistry of Bribin Cave
in Gunung Sewu Karst, Indonesia
1 23
O R I G I N A L A R T I C L E
Wet season hydrochemistry of Bribin Cave in Gunung Sewu
Karst, Indonesia
Tjahyo Nugroho Adji
Received: 17 March 2011 / Accepted: 2 February 2012
ÓSpringer-Verlag 2012
Abstract This research was conducted on the Bribin River, the most important underground river in the Gunung Sewu Karst, Gunung Kidul, Java, Indonesia. The main purpose of this study was to define the wet-season hydro-chemistry of this river. This research also focuses on identifying the relationship between hydrochemical parameters to provide better aquifer characterization. Water-level monitoring and discharge measurements were conducted over a 1-year period to define the discharge hydrograph. Furthermore, baseflow-separation analysis is conducted to determine the diffuse-flow percentage throughout the year. Water sampling for hydrogeochemical analysis is taken every month in the wet season and every 2 hours for two selected flood events. To describe the hydrogeochemical processes, a bivariate plot analysis of certain hydrochemical parameters is conducted. The results show that the diffuse-flow percentage significantly controls the river hydrochemistry. The domination of diffuse flow occurs during non-flooding and flood recession periods, which are typified by a high value of calcium and bicar-bonate and low CO2gas content in water. Conversely, the
hydrochemistry of flood events is characterized by the domination of conduit flow and CO2gas with low calcium
and bicarbonate content. According to the wet-season hydrochemistry, it seems that the small- and medium-sized fractures in the Bribin aquifer still provide storage for the diffuse and fissure flows, although the conduit fracture is already developed.
Keywords Hydrochemistry Bribin Cave Gunung Sewu KarstIndonesia
Introduction
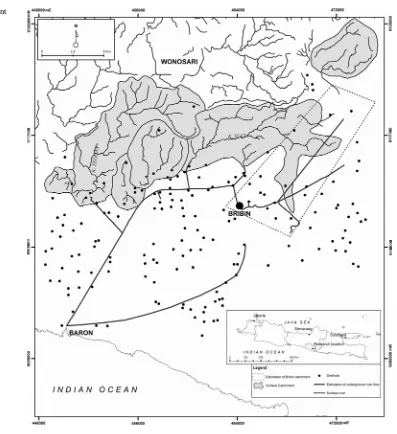
The Gunung Sewu Karst area was initially described by Danes (1910) and Lehmann (1936). The area is located within the central part of the island of Java, Indonesia. In Javanese traditional language, ‘‘Gunung’’ means mount or hill, while ‘‘Sewu’’ means thousand; thus, Gunung Sewu means the area with a thousand hills. This karst area is characterized by the development of positive formations of blunt conical hills (kegelkarst). Kegelkarst, according to Sweeting (1972), are categorized as tropical karst forma-tions. Several other geomorphologists affirm Lehmann’s opinion (Flathe and Pfeiffer 1965; Balazs 1968, 1971; Verstappen 1969; Waltham et al. 1983). Balazs (1968) verifies that the number of hills in Gunung Sewu amounted to approximately 40,000, with a density of approximately 30 hills/km2. Recent studies related to this karst region have been published by Haryono and Day (2004), Ahmad et al.(2005), and Urushibara-Yoshino and Yoshino (1997). The major underground river system in this region is the Bribin-Baron system, which has an outlet discharge of up to 8,000 l/s (MacDonalds and Partners1984). This system is the most important river in the Gunung Sewu Karst (Fig.1). In terms of water resources, the number of people who depend on this water supply system is over 200,000. The Bribin River catchment area was first defined by Fakultas Kehutanan (1993) as being bounded on the upstream (north) side by a massive old-volcanic mountain and by the ancient Ponjong-Polje in the west (Srijono and Aldilla 2006), while the southern and eastern boundaries have not yet been defined. This paper discusses the results T. N. Adji (&)
Department of Environmental Geography,
Gadjah Mada University, Jogjakarta 55281, Indonesia e-mail: [email protected]
Environ Earth Sci
of a quantitative evaluation of wet-season hydrogeochem-istry in Bribin Cave, with the primary focus on a better understanding of karst aquifer characteristics within this area.
Climate and hydrogeological situation
The most recent research related to rainfall condition in Gunung Sewu was conducted by Brunsch et al. (2011), who note that there are spatial and temporal difference in rainfall condition. The spatial variation depends on the proximity to the sea and the elevation, whereas the tem-poral variation is regulated by climate circumstances. Long-term rainfall declines slightly, whereas there is a clear decrease in precipitation from 2002 to 2009. The rainfall intensity rises from December to February and then decreases in most of the other months. Even propensities
toward an extended dry predict period could be perceived. In addition, the El Nin˜o and La Nin˜a events have influences on the rainfall distinction in the dry period with years of either extremely low or high rainfall rates. Some studies on global climate conditions in Gunung Sewu were also conducted by Verstappen (1997) and Urushibara-Yoshino and Yoshino (1997). Studies related to climate in the Quaternary period in the vicinity of the study (Java Island) were performed by Urushibara-Yoshino (1995), Verstap-pen (1975,1994), Dam (1994), Morley (1982), and Budel (1975). Meanwhile, information on climate conditions in the Bribin River catchment can be found in publications by Adji and Nurjani (1999), Suryanta (2001), MacDonalds and Partners (1984), BMG (2000, in Sutikno and Tan-udirjo, 2006), and Fakultas Kehutanan (1993). These studies show that the monthly average temperature in the Bribin River catchment area ranged from 22 to 28°C.
Meanwhile, the annual rainfall in Gunung Sewu ranges Fig. 1 Bribin River catchment
and Bribin-Baron system (MacDonalds and Partners
from 2,000 to 2,500 mm/year from the data obtained at 12 rain-gauge stations in the period of 1947–2000. The research brief by Adji (2010) indicates that the air humidity in Bribin River catchment ranges between 60 and 90%, with a temperature varying between 24 and 28°C. Because,
the catchment is located in a tropical region, knowledge of climatic conditions, especially rainfall and temperature, is relevant to the water input component associated with the karst hydrogeochemistry.
Geologically, the study area is dominated by Miocene limestone of the Wonosari Formation, which consists of massive coral reef limestone in the south and bedded chalky limestone in the north (Balazs1968; van Bemmelen
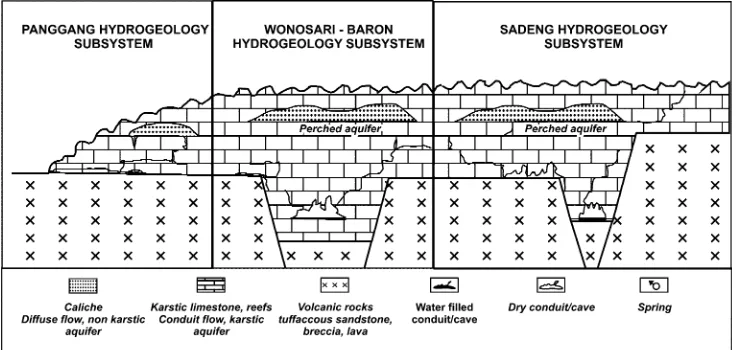
1970; Waltham et al.1983; Surono et al.1992). The results of an interpretation of a 1:50,000 scale aerial photo and a 1:1,000,000 scale ERS image by Kusumayudha (2005) show that the moment structure consisting of thick cracks, faults, and fractures in Gunung Sewu have a general structure direction from northwest to southeast and from northeast to southwest. The regional structure is then divided into blocks bounded by faults that also define the hydrogeological system since the creation of the low-level and high-level configuration (Kusumayudha, 2005). The catchment of Bribin River is included in the Wonosari-Baron Subsystems, which have a volcanic rock (bedrock) configuration as a graben with a northeast-southwest direction (Fig.2).
Bribin River was first described by MacDonalds and Partners (1984). This river begins at the surface of Pentung River and then disappears into the Sawahombo sinkholes. The river comes out in Luweng Jomblangan, emerges again in Gilap Cave, Luweng Jomblang Banyu, Luweng Jurangjero, and at last appears in Bribin Cave before coming out as a large resurgence at Baron Beach in the Indian Ocean. In the section between Luweng Jurang Jero and Bribin Cave, it leaks into the Ngreneng Cave, which also flows into Baron Beach. Adji (2011) notes that the
minimum discharge is approximately 1,600 l/s, while the maximum discharge is recorded at approximately 2,500 l/s.
Methods
Water-level data logger and discharge measurements were conducted for a 1-year period to obtain the discharge hydrograph throughout the year. The stage discharge rating curve used is based on research by Suryanta (2001). The diffuse-flow proportion (baseflow) was defined using the automated baseflow separation by digital filtering method (Eckhardt2005) based on a recession constant value in the hydrograph, which was then correlated to the value of base flow indices (BFI) within a karst aquifer. The following formula was used:
the recession constant and BFImax is the maximum
baseflow that can be measured or performed. To find the constant of the recession, we used the formula:
Qt¼Q0e
at
whereQtis the flow rate at timet,Q0is the initial discharge
in the recession segment, and is a constant. Furthermore,
e
-may be replaced by k, which is known as a recession constant, or depletion factor. This constant is often used as an indicator of the continuity of baseflow (Nathan and McMahon1990). Then, the value ofkis compared with the classification of the karst underground river recession by Worthington (1991, in Gillieson1996).
Water sampling was conducted once a month for a year to cover two seasons (wet and dry). In addition, detailed sampling was performed twice hourly during two flooding
events. Chemical analysis of the samples in the laboratory included the cations Ca2?
, Mg2? was used for the elements Ca2?
, Mg2? the spectrophotometric method was used for HCO3
-, and the flame photometry method was used for Na? and K?. Another analysis was the calculation of PCO2 (partial
pressure of carbon dioxide gas), which is assumed to have reached equilibrium with the water samples (Stumn and Morgan1981; Drever 1988; White1988). With the assis-tance of Wateq-4F software (Ball and Nordstrom 1991), thePCO2 in all samples was determined.
PCO2 ¼ HCO
wherePCO2 is the partial pressure of carbon dioxide gas in
water; [HCO3
-] is the activity of bicarbonate ions, [H? ] is hydrogen ion activity, K1 is the equilibrium constant
reaction solvent at 25°C, and KCO
2 is the equilibrium
constant of CO2in water at 25°C. To describe the
hydro-geochemical processes, a scatter-plot analysis with a small sample size (non-discrete parameters) was conducted that included the following: (1) discharge-major ion concen-tration, (2) specific conductivity-calcium and bicarbonate, (3) discharge-diffuse flow, (4) diffuse flow-log PCO2, (5)
diffuse flow-calcium and bicarbonate, and (6) sodium chloride. A chemograph analysis was also performed to interpret the relative contribution of different waters and was compared with three models of chemographs described in the literature (in Perrin2003).
Result of wet-season hydrochemistry of Bribin Cave
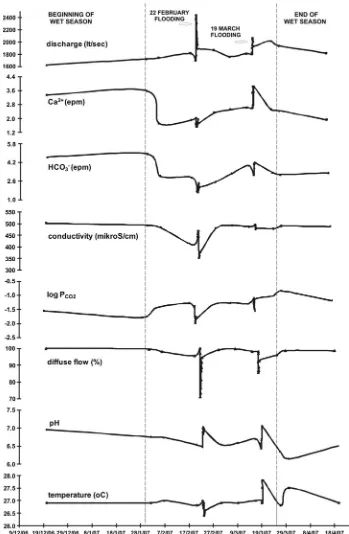
Figure3 shows the wet season hydrochemograph of the underground river in Bribin Cave, which is based on sampling measurements from May 2006 to April 2007.
This hydrochemograph shows that the dissolved con-stituents at the flood events vary and tend to decrease, as there are rainfall recharges through the conduit. Comparing between the beginning and end of the rainy season, the temperature and conductivity values are nearly identical, i.e., in the range of 27°C and 500lS/cm. This result proves
that the diffuse flow component has a dominant role at times when flooding does not occur. Differences are shown in calcium, bicarbonate, and pH values, which do not reach the initial conditions, allowing the dilution of the under-ground river to still proceed by the fissure flow component. However, this dilution does not affect the value of tem-perature and conductivity. Meanwhile, the bivariate plot between the diffuse flow percentage and discharge varia-tion has a negative relavaria-tionship, withR2=0.91 (Fig.4). It also appears that a slight deviation occurs at the beginning and end of the rainy season. These changes occur during
the dominance of the flow component due to the time lag of the fissure and diffusion to recharge the underground river as a result of different rain intensities throughout the wet season. Next, a bivariate plot between the diffuse flow and calcium or bicarbonate and between the diffuse flow and CO2partial pressure are presented in Figs.4and5.
According to Fig. 5, there is a grouping of sample posi-tions based on characteristic stages of flood events (flood peak and recession stages), and it is influenced by the time of the beginning or the end of the rainy season. This result may be caused by high variations in diffuse flow during flood events. In addition, bivariate plotting between diffuse flow and calcium or bicarbonate indicates that the dissolved constituent in water at the beginning of the rainy season consists of higher diffuse flow and calcium content than all other samples because of the rainwater dilution in the peak of the wet season. In contrast, the samples at the time of the flood peak have the lowest content in diffuse flow and dis-solved constituents. Another interesting phenomenon is that the samples in the flood recession of the 22 February flood event exhibit lower major dissolved constituent (Ca2?
and HCO3
-) contents than the 19 March flood event. This result indicates that the groundwater storage within the karst aquifer is recharged sufficiently by rainwater, thereby increasing the percentage of diffuse flow and the relatively more saturated fissure of carbonate minerals that have undergone a process of water–rock interaction. Conse-quently, the diffuse flow in the 19 March flood event (end of rainy season) increases. Next, Fig. 6 shows the relationship between CO2 partial pressure and diffuse
flow percentage.
According to Fig. 6, there is a positive correlation between CO2 partial pressure and the diffuse flow. In
detail, the flood peak in 22 February is characterized by a lower value of the log PCO2 and low diffuse flow content.
This condition differs greatly from the March 19 flood peak, which shows a greater log PCO2 and diffuse flow
percentage. These values are still higher when compared with the samples during the first flood recession of 22 February. In addition, the non-flooding conditions present higher diffuse flow content and logPCO2 values than at the
time of flooding. It can be summarized that the variation of logPCO2 is associated with the percentage of diffuse flow,
so that the process of interaction of water–gas–rock is more dominant than the water–rock interaction only.
Result of Bribin Cave hydrogeochemistry within flood events
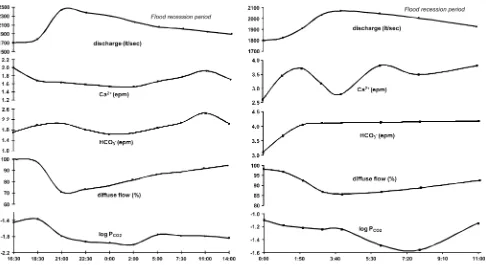
hydrogeochemical fluctuations within flood events. Here, samples are taken every 2 h. Next, the chemograph that describes the fluctuations of discharge, diffuse flow, dis-solved constituent, and the partial pressure of CO2in the
flood hydrograph is presented in Fig.7. In the left part of Fig.7, it seems that the diffuse-flow percentage decreases if the discharge increases at the 22 February 2007 flood event; in other words, the diffuse flow decreases with
increasing discharge to reach its peak discharge. Mean-while, the response of diffuse flow on the 19 March flood event exhibits a similar trend (Fig. 7, right). In summary, from the two flood occasions in Bribin Cave, it can be explained that the diffuse flow has a tendency to decrease with increasing discharge to the peak discharge and then gradually increases shortly after passing the peak discharge.
Fig. 3 Wet-season hydrochemograph of Bribin River
The relationship between discharge and diffuse flow at the two flood events in Bribin Cave is presented in Fig.8. It seems clear that there is a negative relationship between discharge and diffuse flow in both flood events, and even the value of R2 reaches a significant correlation (above 0.99). This decrease in percentage is a result of the replacement of diffuse flow from karst aquifers by conduit flow, which is directly recharged from rainfall through the conduit passage. In the period of decline in diffuse flow, the process of dilution by precipitation occurs along with the increase in the Bribin River discharge. Then, the high correlation between the discharge increase and the diffuse flow decrease, or vice versa, indicates that the karst-aquifer system is controlled by good conduit development.
Figure8 shows that there are different variation ten-dencies (PCO2 and discharge values) between flood
events for 22 February and 19 March. In the 22 February flood event, the PCO2 shows a downward trend at the
time to reach peak discharge and even continues for some time after the peak discharge. The decreasing PCO2
value indicates that the water is still affected by rem-nants of diffuse and fissure flow, which are driven by the
rainwater that comes afterward; thus, it has a tendency to gradually decrease. These results are in accordance with those described by Vesper and White (2004), Raeisi and Karami (1997), and Liu et al. (2004). At the beginning of the recession period, the PCO2 increases significantly,
although it does not reach the initial condition (before the flood event). This behavior may be caused by the mixing process between diffuse, fissure, and conduit flow. In addition, thePCO2 variation within the 19 March
flood event (end of wet season) exhibits a lower corre-lation with diffuse flow. The variation and correcorre-lation between diffuse flow and the PCO2 value at the two flood
events the possible domination of water–gas–rock inter-action within the flood events rather than only water– rock interaction, as in the dry season. However, the 22 February flood tends to show a stronger water–gas–rock interaction than the 19 March flood event, which indi-cates a shifting from the water–gas–rock interaction to the water–rock interaction. This tendency can be further confirmed by looking at the variations of Ca2?
, HCO3
-, and electrical conductivity values, and comparing the correlation between diffuse flow and PCO2.
Fig. 4 Bivariate plot between diffuse flow and discharge during wet season
Fig. 5 Bivariate plot between diffuse flow-calcium (left) and diffuse flow-bicarbonate (right)
The variation of electrical conductivity (EC), calcium, and bicarbonate in the two flood events (Fig.7) is similar to the model described in Perrin (2003). In his second flood-chemograph model, he explains that the content of dissolved constituents in water gradually rises when the discharge rises to its peak (rising limb), is followed by water influenced by dilution by the precipitation process, reaches its peak some time after the peak discharge (EC down), and then slowly falls back to the water chemistry condition before the flood event. If the fracture type in the Bribin River aquifer is dominated by a large conduit only, the rainwater will be rapid and will exhibit the same travel time with the discharge increasing. However, the Bribin River aquifer also contains fissure and diffuse storage in
medium and small fractures (high dissolved element con-tents) and is subsequently pushed by conduit water, which led to EC increasing first, followed by the domination of rainwater (EC decreases).
The calcium value in the 22 February flood event showed a decreasing trend with increasing discharge, while the bicarbonate shows similar trend as the EC value. Fur-thermore, the analysis of bivariate plots between diffuse flow and calcium or PCO2 have correlation (R
2
) values of approximately 0.5. This result indicates that both the water–gas–rock and water–rock interactions during the floods had a nearly balanced contribution (Fig.9). This result is in contrast to the negative correlation in the dry season (Adji2010). However, the correlation value within Fig. 7 Bribin cave hydrochemograph within the 22 February 2007 flood event (left) and within 19 March (right)
approximately 0.5 indicates that the diffuse flow and CO2
gas are not the only factors controlling water dissolved constituents at flood events. In addition, the 19 March flood event shows that increasing diffuse flow is associated with decreasing bicarbonate (R2=0.63), as shown in Fig.10. This result is different from what happened in the first flood
event, as this second flood event has already shown a stable diffuse and fissure flow in the river. In general, conduit flow may directly dilute river water, so there is no large time lag between the flood peak and decreasing bicarbonate or calcium content. Here, the effect of CO2gas at this flood
event still shows a substantial correlation (R2=0.36), Fig. 9 Bivariate plot between diffuse flow andPCO2 in Gua Bribin (left) and between diffuse flow and calcium (right) at the 22 February flood event
Fig. 10 Bivariate plot between diffuse flow andPCO2in Gua Bribin (left) and between diffuse flow and bicarbonate (right) at the 19 March flood event
although its role has been reduced compared with the first flood event (22 February), which is related to the decreasing intensity of rainfall (end of wet season).
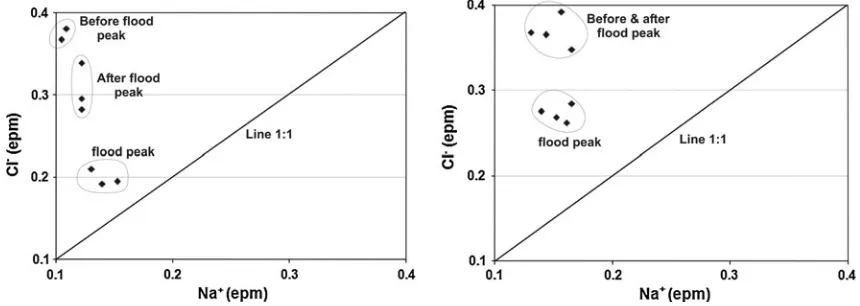
The variation of pH and temperature within the flood hydrograph is theoretically more dependent on the karst flow components that dominate at the time of measure-ment. Bivariate plot of Na?
and Cl
-at the two flood events are presented in Fig.11. This figure shows that the ratio of sodium-chloride ions at times of peak flood and shortly thereafter have a ratio close to the rainwater ratio (1:1), while the sample position farthest from the line ratio of 1:1 is during the period of recession prior to flood events. Furthermore, the position of the samples during the period of recession after the flood peak is located between the position of the pre-flood and the flood peak.
These results indicate that the increase in discharge or decrease in diffuse flow causes the ratio of sodium-chloride to approach the rainwater ratio (line 1:1). This pattern indicates the start of conduit flow domination through the process of dilution by precipitation within the underground river, whereas in periods of recession after peak flood, this ratio begins to slowly increase and move away from the 1:1 line. An interesting pattern is shown by the ratio of sodium-chloride ions in the 19 March flood, where the ratio at the peak flood is enough to deviate from the 1:1 line, while the ratio pre- and post-flood shows no significant difference. This result can be explained by the second flood event, which is already entering the end of the wet season; thus, the diffuse flow is largely dominated by dissolved minerals compared to the time of the first flood. Consequently, the ratio of sodium-chloride ions at the peak of the flood is greater than at the time of the first flood event, or if plotted in the graph, it is relatively positioned away from the 1:1 line ratio. Meanwhile, the ratio before and after flooding is not affected more by the flood events.
Conclusions
The wet season Bribin hydrochemistry is strongly influ-enced by the percentage of diffuse flow in water. During flood events, river water is dominated by conduit flow, which causes decreasing values of calcium and bicarbonate while the CO2 content increases. In this condition, the
correlation between diffuse flow and major dissolved ele-ments (calcium and bicarbonate) is low, which shows the process of water–gas–rock interaction. During the non-flood and non-flood recession periods, the domination of con-duit flow is replaced by diffuse flow, which causes the water–rock interaction to dominate. This stage is charac-terized by increasing calcium and bicarbonate in the water and decreasing CO2 content, and the hydrochemistry is
nearly identical to that found in the dry season, when the
diffuse flow is highly dominant. Lastly, the hydrochemo-graph during the flood and non-flood events shows that the small-medium size fracture in the Bribin aquifer still serves to store diffuse and fissure flows, although the conduit fracture is already developed, as indicated by its domi-nance during the flood events.
Acknowledgments The author wishes to fully express his profound gratitude to Professor Sudarmadji, Professor Suratman and Dr. Heru Hendrayana for their support from the beginning until the finalization of this research. In addition, sincere thanks and appreciation are due to Bagus Yulianto, Badi Hariadi, Lili Ismangil, Zaenuri Putro Utomo, Ari Purwanto, and Acintyacunyata Speleological Club (ASC) for their accompaniment during the equipment installation and fieldwork. Thanks also to Dr. Eko Haryono, who assisted this project financially, and reviewer Prof. Julia Ellis Burnet, who provided valuable input for the improvement of this manuscript.
References
Adji TN (2010) Variasi spasial-temporal hidrogeokimia dan sifat aliran untuk karakterisasi sistem karst dinamis di sungai bawah tanah Bribin, Kabupaten Gunung Kidul, DIY. Disertasi, Fakultas Geografi, Universitas Gadjah Mada, Yogyakarta. (unpublished) Adji TN (2011) Upper catchment of Bribin underground river hydrogeochemistry (Gunung Sewu Karst, Gunung Kidul, Java, Indonesia). Proceeding of Asian Trans-Disclipinary Karst Conference, Yogyakarta
Adji TN, Nurjani E (1999) Optimasi airtanah karst sebagai pemasok air domestik pada kawasan kritis air di Gunung Kidul. Laporan Penelitian, Fakultas Geografi, Universitas Gadjah Mada, Yogyakarta. (unpublished)
Ahmad ML, Haryono E, Suprojo SW (2005) Geomorfologi karst mayor antara Telaga Sanglen dan Kamal, Kabupaten Gunung Kidul, DIY, Gunung Sewu-Indonesian Cave and Karst Journal 1(1) Balazs D (1968) Karst regions in Indonesia: Karszt-Es
Barlangkuta-tas, vol V. Budapest, Globus Nyomda, p 61
Balazs D (1971) Intensity of the tropical karst development based on cases of Indonesia, Karszt-Es Barlangkutatas, vol VI. Globus nyomda, Budapest, p 67
Ball JW, Nordstrom DK (1991) User’s manual for WATEQ4F with revised thermodynamic database and test cases for calculating speciation of major, trace, and redox elements in natural water. USGS open fil rept. 91–183.http://www.h2o.usgs.gov/software/
Brunsch A, Adji TN, Stoffel D, Ikhwan M, Oberle P, Nestmann F (2011) Hydrological assessment of a karst area in Southern Java with respect to climate phenomena, Proceeding of Asian Trans-Disciplinary Karst Conference, Yogyakarta
Budel JK (1975) The ice age in the tropics. Universitas 1:183–192 Dam MAC (1994) The late quaternary evolution of the Bandung
Basin, West-Java, Indonesia. Department Of Quaternary Geol-ogy, Faculty Of Earth Science, Vrije Universiteit, De Belelaan 1085, Amsterdam, p 252
Danes JV (1910) Die karstphanomene in goenoeng sewoe auf Java, Tjdschrift van het kon. Ned Aardrijksk Gen Tweede Serie Deel XXVII:247–260
Drever JI (1988) The geochemistry of natural water, 2nd edn. Prentice Hall, Englewood Cliffs
Eckhardt K (2005) How to construct recursive digital filters for baseflow separation. Hydrol Process 19:507–515
Kidul DIY. Fakultas Kehutanan, Universitas Gadjah Mada, Yogyakarta (Unpublished)
Flathe H, Pfeiffer D (1965) Grundzuge der morphologie, geology und hydrogeologie im Karstgebiet Gunung Sewu (Java, Indonesien). Geologisches Jahrbuch 83:533–562
Gillieson D (1996) Caves: processes, development, and management. Blackwell, Oxford
Kusumayudha SB (2005) Hidrogeologi karst dan geometri fraktal di daerah Gunungsewu. Adicita Karya Nusa, Jogjakarta Lehmann H (1936) Morfologiche studien auf Java, Gohr, Abh, 3,
Stutgart
Liu Z, Groves C, Yuan D, Meiman J, Jiang D, He S, Li Q (2004) Hydrochemical variation during flood pulses in the south-west peak cluster karst: impacts of CaCO3-H2O-CO2 interactions.
Hydrol Process 18:2423–2437
MacDonalds, Partners (1984) Greater Yogyakarta: groundwater resources study. vol 3C: cave survey. Directorate General of Water Resources Development Project (P2AT), Yogyakarta Morley J (1982) Palaeoecological interpretation Of a 10,000 year
pollen record from Danau Padang, Central Sumatra, Indonesia. J Biogeogr 9:151–190
Nathan RJ, McMahon TA (1990) Evaluation of automated techniques for baseflow and recession analysis. Water Resour Res 26(7):1465–1473
Perrin J (2003) A conceptual model of flow and transport in a karst aquifer based on spatial and temporal variation of natural tracers, PhD thesis, Centre D’Hydrogeologie, University de Neuchatel Raeisi R, Karami G (1997) Hydrochemographs of Berghan karst
spring as indicators of aquifer characteristics. J Cave Karst Stud 59(3):112–118
Srijono, Aldilla N (2006) Geogenesis Polje-Purba Ponjong Kabupaten Gunungkidul, Daerah Istimewa Yogyakarta. Gunung Sewu-Indonesian Cave Karst J. 2(1)
Stumn W, Morgan JJ (1981) Aquatic Chemistry, 2nd edn. Wiley, New York
Surono, Toha B, Sudarno I, Wiryosujono S (1992) Geologi lembar Surakarta-Giritontro, Jawa. Pusat Penelitian dan Pengembangan Geologi, Bandung
Suryanta G (2001) Kajian karakteristik hidrograf satuan daerah karst Gunung Kidul (studi kasus: DTA Sungai Bawahtanah Bribin, Kabupaten Gunung Kidul, Propinsi DIY), Skripsi Sarjana, Fakultas Geografi, UGM, Yogyakarta. (Unpublished)
Sutikno, Tanudirjo D (2006) Kajian geoarkeologi kawasan gunung-sewu sebagai dasar pengembangan model pelestarian lingkungan karst, Laporan Hasil Penelitian Hibah Penelitian Pasca Sarjana-HPTP, Universitas Gadjah Mada, Yogyakarta. (Unpublished) Sweeting MM (1972) Karst landforms. Macmillan, London Urushibara-Yoshino K (1995) Environmental change in the karst
areas on the island of Java. J Fac Lett Komazawa Univ 53:85–97 Urushibara-Yoshino K, Yoshino M (1997) Palaeoenvironmental change in Java Islands and its surrounding areas. J Quat Sci 12(5):435–442
van Bemmelen RW (1970) The geology of Indonesia: general geology of Indonesia and adjacent archipelagoes. Government Printing Office, The Haque
Haryono E, Day M (2004) Landform differentiation within the Gunung Kidul kegel karst, Java, Indonesia. J Cave Karst Stud 66(2):62–69
Verstappen HT (1969) The state of karst research in Indonesia. In: Stelcl O (ed) Problems of the Karst Research. Ceskoslovenska Akademia Sciencias, Brno, pp 139–148
Verstappen HT (1975) on palaeoclimates and landform development In Malesia. Mod Quat Res SE Asia 1:3–35
Verstappen HT (1994) Climatic change and geomorphology in S and Se Asia. Proceedings, Colloquim Royal Academy of Overseas Sciences, Brussels, 1992. Geo-Eco-Trop 16:101–147
Verstappen HT (1997) The effect of climatic change on southeast Asian geomorphology. J Quaternary Sci 12:413–418
Vesper DJ, White WB (2004) Storm pulse chemograf of saturation index and carbondioxide pressure:implication for shifting recharge sources during storm events in the karst aquifer at Fort Campbell, Kentucky/Tenessee, USA. Hydrogeol J 12:135–143 Waltham AC, Smart PL, Friederich H, Eavis AJ, Atkinson TC (1983)
The caves of Gunung Sewu. Java: Cave Sci 10(2):55–96 White WB (1988) Geomorphology and hydrology of karst terrain.