Author(s) 20 . -N -N Attri ution 4.0 i ense.
Spatial Analysis of the River Line and Land Cover Changes in
the Kampar River stuary: he In uence of the ono idal ore
Phenomenon
Aprizon Putra *,1,2, Ulung Jantama Wisha 1, Gunardi Kusumah 1,3
1 Research Institute for Coastal Resources and Vulnerability, Ministry of Marine Affairs and
Fisheries, Padang 25245, Indonesia
2 Department of Geography, Padang State University, Padang 25171, Indonesia 3 Coordinating Ministry for Maritime Affairs, DKI Jakarta 10340, Indonesia
*)Corresponding Author (e-mail: [email protected])
Received: 28 October 2017 / Accepted: 08 December 2017 / Published: 22 December 2017
Abstract.The Kampar River estuary is well known for a tidal-bore phenomenon called
¶%RQRZDYHV·7KHHPHUJHQFHRI%RQRZDYHVKDVDVLJQLÀFDQWLQÁXHQFHRQWKHHVWXDU\
system of Kampar River. Scoured materials, resulting from the hydraulic jump of the tidal bore, are carried into the middle of the river. These materials are then deposited when the velocity of the river decreases as a result of the collision of the tidal current
IURPWKHVHDDQGWKHULYHUÁRZ7KHDLPRIWKLVZDVWRGHWHUPLQHWKHDUHDRIHURVLRQDQG
sedimentation with respect to the river line and perform land-cover change analysis for the area around the Kampar River estuary for the years of 1990, 2007, 2010 and 2016.
7KHPHWKRGHPSOR\HGZDVWKHVXSHUYLVHGPD[LPXPOLNHOLKRRG60/FODVVLÀFDWLRQV
which uses an overlay technique to yield alternate information on the river line and land-cover changes in the form of time-series data. The largest erosion occurred during
²IRUZKLFKWKHDYHUDJHFKDQJHUHDFKHGKD\HDU7KHVPDOOHVWHURVLRQ RFFXUUHGGXULQJ²ZKHQWKHFKDQJHUHDFKHGKD\HDU7KHODUJHVWODQG FRYHUFKDQJHZDVIRXQGGXULQJ²ZKLFKRFFXUUHGLQWKHODQGIRUDJULFXOWXUH
plantations (11.57 ha/year), building/settlement (48.11 ha/year) and scrubland (30.88 ha/year). The other types of land cover, such as bare land and sediment deposition, varied every single year. The changes to the river line are caused by land-cover changes, and the Bono waves that lead to erosion and sedimentation that is not stable in the middle of the river and downstream.
Keywords: spatial analysis, land cover, Bono, Landsat imagery, Kampar River estuary.
Abstrak. Muara sungai Kampar terkenal dengan fenomena Tidal Bore yang disebut ¶*HORPEDQJ%RQR·.HPXQFXODQJHORPEDQJ%RQRLQLPHPEHULNDQSHQJDUXK\DQJVLJQLÀNDQ
terhadap dinamika sistem muara di sungai Kampar. Material sedimen yang teraduk karena lompatan hidrolik dari tidal bore terbawa hingga ke bagian tengah sungai. Material tersebut terendapkan ketika kecepatan arus menurun sebagai akibat dari pertemuan dua arus yaitu arus dari laut dan aliran sungai. Tujuan dari penelitian ini adalah untuk mengetahui wilayah erosi dan sedimentasi dengan menggunakan pendekatan analisis perubahan garis sungai dan tutupan lahan disekitar muara sungai Kampar untuk periode 1990, 2007, 2010, dan 2016. Metode yang
GLJXQDNDQDGDODKSHQGHNDWDQNODVLÀNDVLVXSHUYLVHGPD[LPXPOLNHOLKRRG60/PHQJJXQDNDQ
teknik overlay untuk menghasilkan informasi alternatif garis sungai dan perubahan tutupan
ODKDQEHUXSDGDWDWLPHVVHULHV(URVLWHUEHVDUWHUMDGLSDGDWDKXQ²GHQJDQUDWDUDWD SHUXEDKDQPHQFDSDLKDWDKXQ(URVLWHUNHFLOWHUMDGLSDGDWDKXQ²GHQJDQUDWD
rata perubahan mencapai 0.41 ha/tahun. Perubahan tutupan lahan terbesar ditemukan pada tahun 1990 – 2016 yang terjadi pada lahan pertanian/perkebunan (11.57 ha/tahun), bangunan/ pemukiman (48.11 ha/tahun), dan semak belukar (30.88 ha/tahun). Lahan lainnya meliputi lahan terbuka, pemukiman, dan endapan sedimen yang bervariasi setiap tahunnya. Perubahan garis sungai disebabkan oleh perubahan tutupan lahan dan gelombang Bono yang memicu terjadinya erosi dan sedimentasi yang tidak stabil di bagian tengah dan hilir sungai.
1. Introduction
Riau Province has four big rivers, for which the sources are in the Bukit Barisan or Barisan Mountains. They stretch along Sumatra Island and disembogue on the east coast of Sumatra. They are the Rokan River, Siak River, Kampar River and Indragiri River. There is lot of
SRWHQWLDOWRGHYHORSRQHRIWKHPIRUWKHEHQHÀW
of water-resource management and research interests (DBWR of Pelalawan Regency, 2010). In the upstream area of Kampar River, there is a hydroelectric dam, namely Koto Panjang. The construction of the dam is part of the framework of water storage used to enhance the production of electrical energy (114 MW). However, the limited water discharge due to the Koto Panjang hydroelectric dam has triggered
DGHFUHDVHLQWKHGLVFKDUJHRIZDWHUWKDWÁRZV
into the estuary. This condition inhibits the generation of tidal waves, which are locally called ‘Bono waves’. This has much potential
WRDWWUDFWWRXULVWVZKRDUHLQWHUHVWHGLQVXUÀQJ
on Kampar River. The weaker the propagation of the Bono waves, the more sedimentation occurs upstream.
In the estuary, the velocity of the wave propagation is higher than the speed of the river
ÁRZIURPXSVWUHDP,WLQGXFHVWKHWLGDOERUH
generation. It triggers the hydraulic jump of the tidal bore due to the difference in pressure. Bono waves move upstream to Tanjung Pungai, which is about 60 km from the estuary (Rahmawan et al., 2017). According to Edison
et al. (2009) the high concentration of sediment transported in the downstream is caused by the amount of sand sediment carried by the Bono waves. Sediment in the upstream will be
FDUULHGE\WKHZDWHUÁRZ,WLVWKHQGHSRVLWHG
According to Setiady (2010), the increase of erosion and additional sedimentation can lead to the retreat or advance of the river line. Erosion can occur naturally through the scouring of the Bono waves.
The existence of Bono waves is highly controlled by the sustainability of the forest along the river. Bono waves have a pattern that is formed because the waves bounce off the banks of the river. The impact of Bono waves is the erosion that occurs on the banks
of the river and sedimentation in some parts of the body of the river. Conditions get worse if the forest/shrubland, which acts as a natural protector of the edge, is damaged (Rozali et al., 2016). According to Cenci et al. (2017), who quantitatively assessed changes in the river estuary or shorelines, selected ‘relatively’ unstable streams in space and time; i.e. river networks that are analysed to reduce errors in
LQWHUSUHWDWLRQ VXFK DV IRU WKH ULYHU ÁRZ OLQH
stable-vegetation line and unstable-vegetation line. It is assumed that the changes to the
VHOHFWHG VWUHDP ÁRZ DUH D UHSUHVHQWDWLRQ RI
the relevant changes to the body of the river.
,QPRVWFDVHVFHUWDLQVWUHDPÁRZVGHSHQGRQ
several factors, such as the location of the river, sources and the preferences of the researcher.
The management of rivers with complex problems requires holistic, integral and coordinative management. Natural resources in the form of forests, soil and water have an important role in human survival, so their utilization needs to be managed optimally and sustainably (Harjadi, 2010). It is important to monitor the change of both geomorphology and land use in the estuary, which is geomorphologically more dynamic. The river
ÁRZDQGFRDVWZDYHVLQWHUDFWZLWKHDFKRWKHU
which makes geomorphological shifts occur faster. Moreover, land-use changes in the estuary can also affect the processes; one study
ÀQGVWKDWODQGXVHFKDQJHVKDYHDUHODWLRQVKLS
with erosion (Leh et al., 2013). There are many studies that have attempted to monitor the impact of existing river streams and waves (e.g. Darwish et al., 2016), but this is limited in Indonesia. Furthermore, Bono waves have destructive effects on natural resources, such
DV WKH IUHTXHQW RFFXUUHQFH RI HURVLRQ ÁRRGV
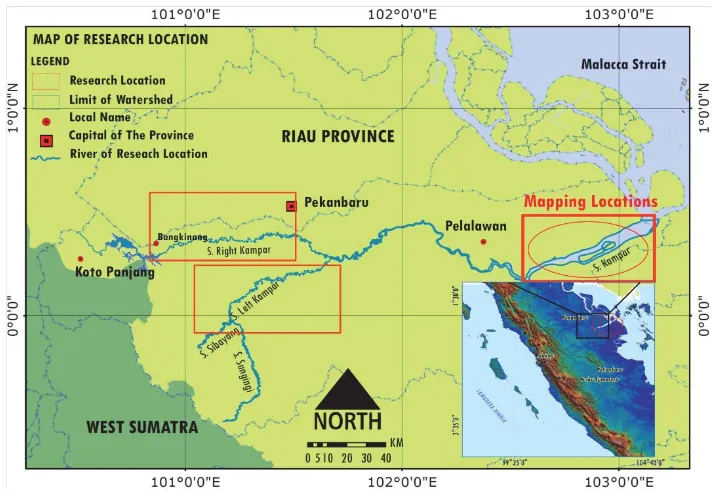
Figure 1. Map of Research Location.
This article aims to determine the area of erosion and sedimentation using an approach of analysing the river-line and land-cover changes around the Kampar River estuary. Spatial analysis of datasets sourced from Landsat imagery for the years of 1990, 2007, 2010 and 2016 was used to investigate changes in the
ULYHUÁRZWRGHWHUPLQHHURVLRQVHGLPHQWDWLRQ
and land-cover changes in the Kampar River estuary, which is located between the sub-districts of Teluk Meranti and Kuala Kampar in Pelalawan Regency, Riau Province.
2. Research Method
2.1 Description of research location
Administratively, Kampar River is located between the Teluk Meranti and Kuala Kampar sub-districts in Pelalawan Regency,
5LDX3URYLQFHDWWKHFRRUGLQDWHVRI·µ² ·µ1 DQG ·µ²·µ( 7KH
total area of the mapped location is 344.479 ha (Figure 1). The Kampar River estuary is part of the alluvial estuary and has a trumpet (convergent) form, which is a prerequisite for the existence of a tidal bore. The tidal amplitude is around 2.1 to 4.5 m and it propagates for 229 km (Mubarak et al., 2017).
Kampar River stretches from west to east through two administrative regions, West Sumatra and Riau Province. Starting from Bukit Barisan, Lima Puluh Kota Regency, Pasaman and Sawahlunto City in West
6XPDWUD 3URYLQFH LW ÁRZV LQWR WKH HVWXDU\
through several administrative regions of Riau Province, such as Indragiri Hulu, Indragiri Hilir, Kampar, Kuantan Singing, Pelalawan and Siak regencies, and Pekanbaru City, arriving in the Malacca Strait with a length reaching 400 km (ARD NRCT, 2013).
Based on the data from DBWR Pelalawan Regency (2010), Kampar River has a total area of 24.548 km2 which is then divided into two rivers; i.e. Right Kampar River and Left Kampar River (Figure 1). The two rivers then
XQLWHLQ/DQJJDPDQGÁRZDVDVLQJOHVWUHDPWR
the Malacca Strait. The Right and Left Kampar
5LYHUVÁRZIURPWZRGLIIHUHQWVRXUFHV5LJKW .DPSDU5LYHUIRUH[DPSOHÁRZVGRZQKLOOIURP
the Gunung Gadang spring in West Sumatra
3URYLQFH 7KH ÀUVW VWUHDP JRHV WR WKH QRUWK DQGWKHQÁRZVHDVWWKURXJKWKH%DWX%DVXUHN
and meets the Kapur Nan Gadang River before joining the Mahat tributary. The base slope of the river reaches 0.0008. This is different from the Left Kampar River, which is sourced from Mount Ngalautinggi and Paninjau Elok. Left Kampar River is split into two branches; i.e. the Sibayang and Singingi rivers. Sibayang River
ÁRZVVHSDUDWHO\EHIRUHUHFRQQHFWLQJZLWKWKH 6LQJLQJLDQG%LELRULYHUV7KHZDWHUÁRZUDWH
is about 600 m3/s upstream and downstream
LWLVGRZQWR²P3/s. Finally, the Right
Kampar River and Left Kampar River reunite in Langgam.
2.2. Research data and mapping techniques
The mapping of the river line and land-cover changes was done using a deep and comprehensive analysis of natural resources and environmental aspects. The data used in this research was sourced from Landsat imagery,
DQGPXOWLVSHFWUDOLPDJHU\FODVVLÀFDWLRQQHHGHG
to be done using more than one method. As a result of using several methods for analysing the remote sensing data, errors will be experienced when detecting the objects (Putra et al., 2014). The appearance of every object could provide a spectral response that causes an error during
WKH LPDJHU\ FODVVLÀFDWLRQ 'LIIHUHQW UHVXOWV
will be experienced using high-resolution satellite imagery compared to the object-based
FODVVLÀFDWLRQPHWKRG.DOLUDMet al. (2017) state that the analysis of the river line and land
FRYHUFDQEHSHUIRUPHGPRUHVSHFLÀFDOO\DQG DFFXUDWHO\ ZLWK ÀHOG VXUYH\V XVLQJ *DUPLQ *360$36WRFROOHFWVSDWLDOGDWDLQWKHÀHOG
The horizontal-positioning deviations can be up to 5 min in the open river estuary region and forest cover with strong signal accuracy. In a worst-case scenario, it can be up to 10 min in areas with canopy cover and considerable build-up where satellite visibility is much affected. Standard procedures were adopted for the geomorphological mapping from multiple spatial data sources by employing visual or
GLJLWDOLQWHUSUHWDWLRQFODVVLÀFDWLRQWHFKQLTXHV
from the Landsat Thematic Mapper (TM) 5 in 1990, Enhanced Thematic Mapper Plus (+ETM) in 2007 and 2010, and Operational Land Imagery 8 (OLI) in 2016; 2) mapping the references in a comparative data analysis of the river-estuary conditions used to map “Army Map Service (PV), Corps Engineers, U.S Army” for 1955, sheet 779450, for Siak Sri Indrapura, Indonesia with a scale of 1:125.000; and 3) further data analysis with the geographic information system (GIS) using the overlay technique to obtain the information about the areas of erosion, sedimentation and land-cover changes in the Kampar River estuary. More details are shown in Figure 2, as follows:
2.3. River line changes analysis
Satellite imagery data was extracted to obtain the information on the river line by digitally employing a visual method. This method is quite precise, but it takes a long time to complete this processing step. However, because the study area is not very wide, the weakness of this method can be overcome. At the time of completing the visual interpretation, the position of the river line was recorded. Particularly, the possibility of a wetland
DSSDULWLRQFDXVHGE\WKHLQÁXHQFHRIULYHUUXQ
off was compared to the river contour line in the part of the land border (0 m) (Winarso et al., 2001).
Pierik et al. (2016) identify another method that can improve chronology, which is using case-study models of hydrodynamical processes and sedimentation balance indicating how fast tidal inlets can develop and silt up. Additionally, studies based on stratigraphy could improve the vertical time control of deposits, which lead to improving the time resolution and rate of deposition in tidal systems. These studies require knowledge of the initial paleogeographic and geomorphological conditions, which GIS output can provide for landscape that has changed considerably.
2.4. Applying supervised maximum
likelihood (SML) classi cations
60/FODVVLÀFDWLRQVDUHDVWDWLVWLFDOPHWKRG
based on measuring the distance between the
sample and the pixel coordinates (Suryantoro,
7KHDVVXPSWLRQEHKLQGWKLVFODVVLÀFDWLRQ
is that objects are homogeneous. In this
FODVVLÀFDWLRQ D SL[HO LV QRW GHVFULEHG DV D VSHFLÀFREMHFWEHFDXVHRILWV(XFOLGHDQGLVWDQFH
It is described based on the shape, size, and orientation of the sample in the feature space (ellipsoid) (Danoedoro, 2012).
60/ FODVVLÀFDWLRQV DVVXPH WKH VWDWLVWLFV
for each class in every band, which are normally distributed, and calculates the probability of a
JLYHQSL[HOEHORQJLQJWRDVSHFLÀFFODVVLÀFDWLRQ
(Susanti and Miardini, 2017). However, if a probability threshold is selected, all pixels will
EHFODVVLÀHG(DFKSL[HOLVDVVLJQHGWRWKHFODVV
that has the highest probability (maximum likelihood). If the highest probability is smaller
WKDQ WKH WKUHVKROG VSHFLÀHG WKH UHPDLQLQJ SL[HOV ZLOO EH XQFODVVLÀHG (QYLURQPHQW
for Visualizing Imageries (ENVI) software
LPSOHPHQWV WKH 60/ FODVVLÀFDWLRQV E\
calculating the discriminant functions for each pixel with Equation 1.
(1) agery and is assumed to be the same for all classes
ɕƴiɕ = determinant of the covariance matrix of the data in class
= inverse matrix
mi = mean vector (Richards, 1999)
2.5. Area calculation for land cover
For GIS, the land-cover changes were treated as a function of topography. Therefore, the calculation procedure entails a basic subtraction. As such, GIS can be applied to
DVVHVVWKHFKDQJHRIULYHUÁRZDQGODQGFRYHU
areas. After obtaining the values for the
land-FRYHUFODVVLÀFDWLRQUHVXOWVWKHHVWLPDWLRQDUHD
was then calculated. The area for a land-cover
FODVV FDQ EH GHWHUPLQHG XVLQJ D PRGLÀFDWLRQ
et al. (2016) describe the changes model, which calculates the grid cell of Landsat imagery by using the input parameters supplied that were substituted into the equations. Therefore, a
FRPSXWDWLRQDOJULGZLWKDÀQHVSDWLDOUHVROXWLRQ
will result in a longer simulation runtime; in
RWKHU ZRUGV WKH ÀQHU WKH JULGV UHTXLUHG WKH
shorter the computational time steps used. As such, the changes model is mainly restricted to either detailed studies of small geographical areas or studies of large geographical areas with a coarse spatial resolution. The calculation for land cover is shown in Equation 2.
(2)
where:
L = area (ha) ƴP = number of pixels
r = spatial resolution of Landsat 30 x 30 m 0.0001 = conversion into m2 for the inside area
(ha)
2.6. Rate-change analysis
The rate of river-line change determines the information required on the erosion, sedimentation and land cover by using an overlay technique for the Kampar River estuary. The spatial area can be determined by using the formula (Equation 3) given by Richards (1999).
(3)
where:
V = rate of change (%)
1 DUHDRIÀUVW\HDUKD
1 DUHDRI\HDUWR²QKD
3. Results and Discussion
3.1. River line changes (erosion and sedimentation)
The propagation of Bono waves causes erosion on the river bank around Muda Island. This condition can be seen from the satellite imagery. The present schedule of Bono waves is
NQRZQE\WKHORFDOFRPPXQLW\7KHULYHUÁRZ
line and vegetation are damaged due to river erosion, where the Bono waves pass through the mouth of the river. The most sediment is
carried by Bono waves that have a high energy. It is then deposited when the energy is reduced. As a result, physical changes in the river cannot be avoided. Several areas in the Kampar River estuary have sedimentary deposits due to estuarine sand, which initiates the formation of new islands, while some other locations experience severe erosion.
Muda Island is one of the small islands that grew because of the sedimentation process (Yulistyanto, 2009). Due to the unstable erosion and sedimentation events, the existence of the tidal bore needs to be considered; this is because the wider the river, the more the river-bed resistance is increased. This disrupts the propagation of Bono waves (Chanson, 2001). According to Wisha and Maslukah (2017), the elevation changes drastically during the propagation Bono waves, which triggers the mass transport of water that enters the river rapidly with the speed reaching 0.85 m/s. It is the one factor triggering the sedimentation and erosion events along the Kampar River. Landsat imagery analysis has been done to cover the years of 1990, 2007, 2010 and 2016.
5LYHUOLQHFKDQJHVDUHODWHULGHQWLÀHGIRUHDFK
year using the overlay technique to obtain much information regarding erosion and sedimentation in the Kampar River estuary.
)XUWKHUPRUH WKH SURFHVV RI ÀOWHULQJ RQ HDFK /DQGVDWLPDJHXVHVDKLJKSDVVÀOWHU*RVOHH $IWHUFRPSOHWLQJWKHÀOWHULQJSURFHVVWKH
imagery is sharpened with the aim to clarify the
DSSHDUDQFHRIULYHUÁRZSDWWHUQV
The appearance of erosion and sedimentation in the Kampar River estuary is
LGHQWLÀHGXVLQJWKHRYHUOD\WHFKQLTXHEDVHGRQ
river-line changes on the Landsat imagery. After comparing Landsat images from TM 5 in 1990, +ETM in 2007, 2010 and OLI 8 in 2010, it shows the river line shifts northward and southward along the centre section of the Kampar River estuary (Figure 3). The length of the river line in the research location reached 344.48 ha, including the digitization result for several small islands (Untut, Kepiting, Baru, Muda, Tigo, Sempit and Kapak). The river-line length changes are shown in Table 1, where the highest
2016, when it reached 21.33 km and the rate of change was 3.56 m/year. The lowest change
RFFXUUHGGXULQJ²ZKLFKZDVNP
and the rate of change reached 0.15 m/year. The river’s meanders changed dramatically
GXULQJ²,QHURVLRQRFFXUUHGLQ
the southern part of the river and sedimentation occurred the northern part of the Kampar River estuary that is formed near Muda Island. During 2007, there was a constriction of the
ULYHUÁRZDW0XGD,VODQG)URPXQWLO
erosion happened again in the southern part of the Kampar River estuary.
7KHFKDQJHVLQWKHULYHUÁRZWKDWKDSSHQHG
were triggered by the transportation of sediment that occurred during the Bono-wave events. The emergence of Bono waves in the river caused the river’s meanders to become wider in the northern part of the Kampar River in 1990. To determine whether an area experiences erosion, sedimentation or a balance, two streamline water digitizations of Landsat imagery from different years can be integrated. Based on the results of the digitization of Landsat imagery in the form of time-series data, the biggest erosion
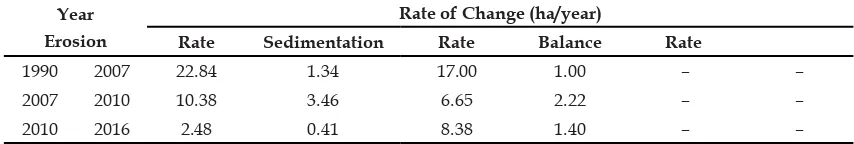
HYHQW RFFXUUHG GXULQJ ² ZKHUH WKH
erosion area reached 22.84 ha and the change rate was 1.34 ha/year. The smallest erosion
KDSSHQHGGXULQJ²ZKHUHWKHHURVLRQ
area reached 2.48 ha and the change rate was 0.41 ha/year. However, the biggest area of
VHGLPHQWDWLRQ LV IRXQG GXULQJ ²
where it reached 17.00 ha and the change rate was 2.22 ha/year, and the smallest area occurred
GXULQJ²ZKHUHLWUHDFKHGKDDQG
the change rate was 1.00 ha/year (Table 2 and Figure 4).
3.2. Land-cover changes
The land-cover conditions near the
ULYHU OLQH VHYHUHO\ LQÁXHQFH WKH HURVLRQ OHYHO
occurring. The area that is critical as a result of the erosion can be analysed visually and digitally using the GIS approach (Harjadi, 2009). Mapping the borderline with pixel-level accuracy can be achieved through sub-pixel
PDSSLQJ LQ ZKLFK ÀQHU UHVROXWLRQ GDWD LV
extracted from the original imagery, while at the same time the spatial location of the erosion and
sedimentation phenomena within the original pixels are obtained.
9DOMDUHYLþet al. (2014) analysed the quality of land cover with respect to the phenomena of erosion and sedimentation in the Kampar River estuary using pixel data from the Landsat imagery (overlay), the topographic map and the map of existing land cover. The method of sub-pixel mapping is a suitable solution for locations
WKDW FDQ EH DQDO\VHG VXIÀFLHQWO\ DFFXUDWHO\
This method has already been applied to some satellite recordings. Therefore, this may help to calculate qualitatively the extent of erosion and sedimentation, both for the sustainable planning and for short-term planning.
The changes to land cover in the cropped area reached 344.479 ha. It is dominated by
DJULFXOWXUDO ODQG SODQWDWLRQ ÀHOGV DQG
shrubland that is damaged by the overland function and the occurrence of Bono waves. The
GHÀQLWLRQ RI ODQG FRYHU DFFRUGLQJ WR %HUULRV
(2004), is the physical objects covering the surface of the land, which consists of natural vegetation, manmade buildings, bodies of water, rocks and sand surfaces, while the land
FRYHULVWKHODQGXWLOL]HGE\KXPDQVIRUVSHFLÀF
purposes.
Based on the research conducted by Anna
et al. (2010), the overland function taking place
LQWKHULYHUVWUHDPDUHDLVVLJQLÀFDQWO\LPSDFWHG
by its hydrological parameters. It causes the limited over of water resources, which seep into the ground. The Kampar River estuary is a part of the coastal region, where the development of settlements is not a major priority. However, it is concerned with utilizing the area for agriculture/plantations and aquaculture/ ponds. This is opposite to the existing conditions where the area of the Kampar River estuary has
EHHQGHFUHDVHGGXHWRWKHRSHQÀHOGVXWLOL]HG
for agriculture and plantations. This has also
EHHQ FDXVHG E\ WKH IRUHVWÀUH HYHQW LQ
Jaya (2013) reveals that either different land-cover types can be used for the same activity or similar land-cover types can be utilized for different types of area. Based on the spatial analysis of land-cover changes, the land cover
KDVFKDQJHGVLJQLÀFDQWO\IURPWRVHH
a le . he ate of i er- ine han es in the a par i er Estuary.
Location 1990 2007 Change (m) Rate (m/yr)
Kampar River estuary
·µ²·µ1 ·µ²·µ(
289.02 286.54 2.48 (0.15)
2007 2010 Change (m) Rate (m/yr)
286.54 282.76 3.78 (1.26)
2010 2016 Change (m) Rate (m/yr)
282.76 261.43 21.33 (3.56)
Figure 3. Map of Landsat Imagery Overlay Results (Analysing the Erosion and Sedimentation in the Kampar River Estuary).
a le 2. he ate of Erosion an Se i entation han es in the a par i er Estuary.
Year Erosion
Rate of Change (ha/year)
Rate Sedimentation Rate Balance Rate
1990 2007 22.84 1.34 17.00 1.00 ² ²
2007 2010 10.38 3.46 6.65 2.22 ² ²
2010 2016 2.48 0.41 8.38 1.40 ² ²
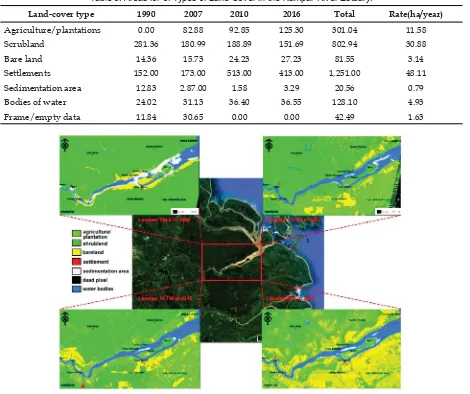
The maximum replenishment of the
ODQGFRYHU DUHD LV IRXQG GXULQJ ²
2016, when changes in the agricultural and plantation area reached 11.578 ha/year. The development of buildings and settlements changed by around 1,251 ha during those years at a rate of 48.11 ha/year. The area of scrubland changed to around 802.94 ha at a rate of 30.9 ha/year. Whereas, the other
W\SHV RI ODQG FRYHU VXFK DV RSHQ ÀHOGV
sedimentation areas and bodies of water,
KDYH QRW FKDQJHG VLJQLÀFDQWO\ ,W YDULHV
every single year.
In Teluk Meranti, the development of
VHWWOHPHQWV LQFUHDVHG GXULQJ ² ZKHQ
the area changed reached 100 ha. This indicates that the allocation of settlements along the river line is not a priority in the development of local settlements due to the effects of Bono waves. This
LVVXSSRUWHGE\WKHIRUHVWÀUHHYHQWLQ,W
Figure 4. Map of the Erosion and Sedimentation Areas in the Kampar River Estuary.
a le 3. Areas for of ypes of an o er in the a par i er Estuary.
Land-cover type 1990 2007 2010 2016 Total Rate(ha/year)
Agriculture/plantations 0.00 82.88 92.85 125.30 301.04 11.58
Scrubland 281.36 180.99 188.89 151.69 802.94 30.88
Bare land 14.36 15.73 24.23 27.23 81.55 3.14
Settlements 152.00 173.00 513.00 413.00 1,251.00 48.11
Sedimentation area 12.83 2.87.00 1.58 3.29 20.56 0.79
Bodies of water 24.02 31.13 36.40 36.55 128.10 4.93
Frame/empty data 11.84 30.65 0.00 0.00 42.49 1.63
4. Conclusion
Bono waves are destructive, and cause erosion and sedimentation in some areas of the Kampar River estuary. They have damaged the river line of the Kampar River estuary, where erosion and sedimentation occur in an unbalanced way, and create a buffer along the
ULYHUÁRZ7KHODUJHVWDPRXQWRIULYHUHURVLRQ RFFXUUHG GXULQJ ² DQG WKH VPDOOHVW DPRXQW KDSSHQHG ² +RZHYHU WKH
largest amount of sedimentation took place
GXULQJ ² DQG WKH VPDOOHVW DPRXQW WUDQVSLUHG GXULQJ ² 7KH RFFXUUHQFH
of erosion and sedimentation effected changes to land cover along the Kampar River estuary, where the largest land-cover
FKDQJHV RFFXUUHG GXULQJ ² ZKLFK
changed area of agricultural/plantation land. The smallest change happened to scrubland. Other land-cover types, such as bare land and settlements, varied each year. The settlements
were concentrated in Teluk Meranti, which is the sub-district centre, and this area rose from 513 ha in 2010 to 413 ha in 2016. This indicates that the allocation of settlements along the Kampar River estuary is not a major priority for development, and the Bono-waves phenomenon that occurs in the Kampar River estuary is the main factor causing less construction of community settlements to be allocated to the Kampar River estuary area.
Acknowledgements
Acknowledgements are given to the Head of LRSDKP Bungus Padang who has supported us during this research. We also express our gratitude to all those who have helped with the administration process, as well as those
ZKRKHOSHGXVLQWKHÀHOGHVSHFLDOO\VWXGHQWV
from the Marine Science Department of Riau University.
References
Agency for Research and Development (ARD) of Natural Resources Conservation Technology (NRCT). (2013). )RUHVWU\ 3URÀOH 3URYLQFH . (In Indonesian) Retrieved from http://
EDOLWHNNVGDRULGSURÀONHKXWDQDQSURYLQVL
Anna, A.N., Kaeksi, R.W and Astuti, W.A. (2010). The Analysis of Hydrological Characteristics Parameter as The Effect of Landuse Changing Using Landsat Imagery From 1997 to 2002 in Sukoharjo District. )RUXP*HRJUDÀ9RO1RSS²
Berrios, P.H. (2004). Spatial Analysis of The Differences Between Forest Land Use and Forest Cover Using GIS and RS. A case study in Telake Watershed, Pasir district, East Kalimantan.
MSc Thesis. The Netherlands: ITC.
Cenci, L., Disperati, L., Persichillo, M.G., Oliveira, E.R., Alves, F.L and Phillips, M. (2017). Integrating remote sensing and GIS techniques for monitoring and modeling shoreline evolution to support coastal risk management. J. GIScience & Remote Sensing. Vol 0, No. 0,
SS²
Chanson, H. (2001). Flow Field in A Tidal Bore: A physical Model. Proc. 29th IAHR Congress, Beijing, Theme E, Tsinghua University%HLMLQJSS²
Danoedoro, P. (2012). Introduction to Digital Remote Sensing. Yogyakarta: C.V Andi Offset. (In Indonesian)
Darwish, K., Smith, S. E., Torab, M., Monsef, H and Hussein, O. (2016). Geomorphological Changes along the Nile Delta Coastline between 1945 and 2015 Detected Using Satellite Remote Sensing and GIS. Journal of Coastal ResearchSS²
Department of Binamarga and Water Resources (DBWR) of Pelalawan Regency. (2010). Final Report DED Kampar River Retaining Cliff Teluk Meranti Village Pelalawan Regency, Riau. (In Indonesian)
Goslee, S.C. (2011). Analyzing Remote Sensing Data in R: The Landsat Package. J. Statistical
Software9RO1RSS²
Harjadi, B. (2009). Monitoring and Evaluation of Watershed With Remote Sensing and Geography Information System. )RUXP*HRJUDÀ9RO1RSS²
Harjadi, B. (2010). Land Cover Analysis in Grindulu Catchment Area Using Remote Sensing and Geographic Information System. )RUXP*HRJUDÀ9RO1RSS²
Jaya, L. M. G. (2013). Changes in Land Cover Analysis in The Gulf Coast Kendari Using High
5HVROXWLRQ6DWHOOLWH,PDJH3HULRG²)RUXP*HRJUDÀ9RO1RSS²
Kaliraj, S., Chandrasekar, N and Ramachandran, K.K. (2017). Mapping of coastal landforms and volumetric change analysis in the south west coast of Kanyakumari, South India using remote sensing and GIS techniques. The Egyptian Journal of Remote Sensing and Space Science,
9RO1RSS²
Leh, M., Bajwa, S and Chaubey, I. (2013). Impact of land use change on erosion risk: an integrated remote sensing, geographic information system and modeling methodology. Land
Degradation & Development9RO1RSS²
Mubarak, Sulaiman, A and Efriyeldi. (2017). Environmental Effect of Tidal Bore Propagation in Kampar River. MATEC Web of Conferences 103, 04015.
Pierik, H. J., Cohen, K. M and Stouthamer, E. (2016). A new GIS approach for reconstructing and mapping dynamic late Holocene coastal plain palaeogeography. J. Geomorphology, Vol. 270
6XSSOHPHQW&SS²
Putra, A.,Husrin, S and Ridwan, N.N.H (2014). Shoreline Changes Analysis in Bali`s Northeast Coast Using Remote Sensing Dataset (Case Study USAT Liberty Ship Site Location, Tulamben). Proceedings of the National Marine SeminarSS²
3XWUD $ +XVULQ 6 DQG .HOYLQ - ,GHQWLÀFDWLRQ RI &KDQJHV $UHD RI *UHHQEHOW LQ
Pangandaran Regency, West Java Using Landsat. J. Akuatika9RO1RSS²
Rahmawan, G.A., Wisha, U.J and Husrin, S. (2017). Bathymetry and tidal analysis in the estuary of Kampar: generating the propagation of tidal wave “Undular Bore Bono”. J. Ilmiah
Geomatika9RO1RSS²
Richards, J. A. (1999). Remote Sensing Digital Imagery Analysis, Berlin: Springer-Verlag.
Rozali, R., Mubarak, M and Irvina, N. (2016). Patterns of Distribution Total Suspended Solid (TSS) in River Estuary Kampar Pelalawan. Student Online Journal Faculty of Fisheries and
Marine Science Riau University9RO1RSS²
Seenath, A., Wilson, M and Miller, K. (2016). Hydrodynamic versus GIS modelling for coastal
ÁRRGYXOQHUDELOLW\DVVHVVPHQW:KLFKLVEHWWHUIRUJXLGLQJFRDVWDOPDQDJHPHQW"Ocean &
Coastal Management9RO6XSSOHPHQW&SS²
Setiady, D. (2010). Estimated Potential Reserves of Sea Sand which exists in Muara Kampar Waters of Riau islands. Buletin Sumber Daya Geologi9RO1RSS²
Suryantoro, A. (2003). The Easiness of Interpretation of SPOT XS Imagery and TM Landsat to Identify Object of The Cover of Urban Area. )RUXP*HRJUDÀ9RO1RSS²
Susanti, P. D. and Miardini, A. (2017). The impact of Land Use Change on Water Pollution Index of Kali Madiun Sub-watershed. )RUXP*HRJUDÀ9RO1RSS²
9DOMDUHYLþ$æLYNRYLþ'9DOMDUHYLþ'6WHYDQRYLþ9DQG*ROLMDQLQ-*,6$QDO\VLV
of Land Cover Changes on the Territory of the Prokuplje Municipality. 7KH6FLHQWLÀF:RUOG
Journal, Vol. 2014, Article ID 805072, 8 pages.
Coastal Study. Proceeding on 22nd Asian Conference on Remote Sensing, CRISP NUS and Asian Association on Remote Sensing, Singapura.
Wisha, U. J and Maslukah, L. (2017). Nutrient Condition of Kampar Big River Estuary: Distribution of N and P Concentrations Drifted by Tidal Bore “Bono”. Indonesian Journal of Marine Science.
9RO1RSS²
Yulistyanto, B. (2009). The Phenomenon of Bono Rising Wave in Kampar River Estuary. J.