Detection Financial Statement Fraud With Beneish Model : An
Empirical In Indonesia
Mutia Kusumasanthi
a, Kartika Hendra Titisari
b, Anita Wijayanti
b aStudent of Economic Faculty UNIBA Surakarta, KH Agus Salim Street 10, Surakarta, Indonesia
b
Lecturers of Economic Faculty UNIBA Surakarta, KH Agus Salim Street 10 Surakarta, Indonesia
e-mail : [email protected]
Abstract: This research aims to know the number of manufacturing companies that classified as manipulators, gray company, and non-manipulators which measure used Beneish analysis model. Used samples consisted of 64 annual financial reports of manufacturing companies that listed in Indonesia Stock Exchange from 2015 to 2016. The results of data analysis show there are 5 firms with percentage 7,81% classified as manipulators. Most dominant indicators are SGAI, DEPI, and AQI. Number of gray company category are 2 or 3,81% .Most commonly shown by GMI indicator. While the companies that classified as non-manipulators are 57 companies or 89,06%. The results of this research indicate that (1) still founds a companies that have potential to do financial statement fraud, even the number increased, as much as 5 companies or equal to 7,81% from samples companies. (2) as many as 2 companies or 3,13% of total samples companies classified as gray company. (3) there are 57 companies or 89,1% classified as non-manipulators. Investors and creditors are expected to be more cautious in deciding the company's capital and credit policies in the future. While for companies that have presented financial statements that are free from the element of manipulation should be rewarded. In the long run, companies can enjoy good market performance and in turn gain public trust.
Keywords : financial statement fraud; manipulator; gray company; non-manipulators; Beneish analysis.
1.
INTRODUCTION
Fraud of financial statement is one of fraud type that often occurs in firms scope. This cases as a consequence of regulation government’s change and strict business competition, so a company must increase or maintain their performance. The form of fraud in accounting is material misstatement due to deliberate omission or disclosure of certain items and asset’s unusual treatment. Based on ACFE’s survey results in Indonesia, fraud cases that most disadvantageous is corruption, while financial statement fraud placed in ranked last with cases number of cases 10. Although placed in ranked last, but the magnitude of lost is bigger, more than 10 billion rupiah.
A research about detection fraud with various method has been widely both in Indonesia and various countries, for
examples Lou and Wang (2009) using fraud triangle. The results are fraud has positive correlation with pressure, opportunities, and attitudes. Yucel (2012) using red flags method indicate that “pressure” indicator is “very effective”. Dalnial, et al. (2014) with financial ratios to public firms in Malaysia. The results are significant differences between firms with fraud indicated and those not, especially from leverage ratios. Hong and Park (2014) with pair of cost and revenues. The result shows that causal relations cost and revenues more effective to detect fraud. In government sectors,
Joseph,
et al. (2015)
on the part of Kakamega district, Kenya. The independent variable is the internal control. The result is a positive correlation between the control system with fraud prevention and detection. Wulandari, et al. (2017) in the financial department ofSragen Regency. Independent variables are used for internal control effectiveness, compensation appropriateness, rule enforcement, information asymmetry, and unethical behavior. The result of all independent variables simultaneously affected.
For the first time, Beneish (1999) found a model to detect fraud of financial statement firms. Used eight proxy is Day’s Sales in Receivable Index (DSRI), Gross Margin Index (GMI), Assets Quality Index (AQI), Sales Growth Index (SGI), Depreciation Index (DEPI), Sales General and Administrative Expenses Index (SGAI), Leverage Index (LEVI), and Total Accruals to Total Assets (TATA). Which the proxy may extent company manipulates. Beneish study was adopted by Hugh Grove (2008) in Wijayanti (2013). The result is Beneish model is an excellent analysis to detect fraud.
This paper will re-examine the fraud detection used Beneish analysis. This result will indicate the number and percentage firms which classified as manipulators, gray company, and non-manipulators. In addition, this study was conducted in manufacturing firms that listed on Indonesian Stock Exchange from 2015 and 2016. Beneish indicators only agree with manufacturing firms
(Aprilia, 2017)
.2.
METHODOLOGY
2.1. Research Design
The population is all annual financial statements of manufacturing companies listed on the Indonesian Stock Exchange from 2015-2016. The sample is selected by purposive sampling method. Criteria for sampling is the company has increased sales, increased profits, and consistently presents financial statements in the currency of rupiah (IDR) or dollar (US $). From 130 population obtained 64 manufacturing companies as a samples.
2.2. Variables and Analysis Method 2.2.1. Variables
The independent variables in this study are Beneish analysis measured by 8
indicators, ie Days' Sales In Receivables Index (DSRI), Gross Margin Index (GMI), Assets Quality Index (AQI), Sales Growth Index (SGI), Depreciation Index (DEPI ), General Sales and Administrative Expenses Index (SGAI), Leverage Index (LVGI), and Total Accrual To Total Assets Index (TATA). The dependent variable is fraud detection.
2.2.2. Analysis Method
2.2.2.1. Calculation of Index Ratio Company with 8 indicators
a. Days’ Sales in Receivables Index (DSRI)
b. Gross Margin Index (GMI)
c. Asset Quality Index (AQI)
d. Sales Growth Index (SGI)
e. Depreciation Index (DEPI)
f. Sales, General, and
Administrative Expenses Index
(SGAI)
g. Leverage Index (LEVI)
h. Total Accrual To Total Assets
ΔWorking Capital = Current Assets – Current liabilities
2.2.2.2. Comparison of Index Calculate with Parameter Index
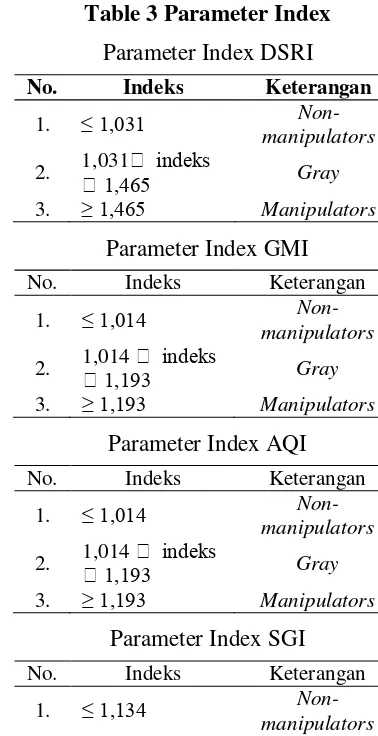
Parameter index of DSRI, GMI, AQI, SGI, and TATA are enclosed in Table 3. While the DEPI and LEVI indicators, if the index is over 1.0, are classified as manipulators. If less than 1.0 are classified as non-manipulators. As for the SGAI indicator, if the index count of less than 1.0 is classified as manipulators, and non-manipulators for more than 1.0.
Table 3 Parameter Index
Parameter Index DSRI
No. Indeks Keterangan
1. ≤ 1,031
Non-manipulators
2. 1,031 1,465 indeks Gray
3. ≥ 1,465 Manipulators
Parameter Index GMI No. Indeks Keterangan
1. ≤ 1,014
Non-manipulators
2. 1,014 1,193 indeks Gray
3. ≥ 1,193 Manipulators
Parameter Index AQI No. Indeks Keterangan
1. ≤ 1,014
Non-manipulators
2. 1,014 indeks
1,193 Gray
3. ≥ 1,193 Manipulators
Parameter Index SGI No. Indeks Keterangan
1. ≤ 1,134
Non-manipulators
2. 1,134 1,607 indeks Gray
3. ≥ 1,607 Manipulators
Parameter Index TATA No. Indeks Keterangan
1. ≤ 0,018
Non-manipulators
2. 0,018 0,031 indeks Gray
3. ≥ 0,031 Manipulators
2.2.2.3. Classification of Companies
If the company has over or equal five computation indexes corresponding to the index parameter that states the manipulators, then belong to the Manipulators. The same applies also to the classification of non-manipulators and gray companies. The result of classification of company in Appendix 2.
2.2.2.4. Calculation of percentage of manipulators, non-manipulators, and gray company
By means of the total class of each firm divided by the total sample company multiplied by 100%.
3.
EMPIRICAL
RESULTS
3.1. Results of Data Analysis
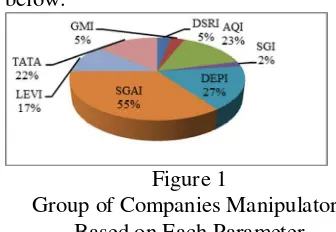
3.1.1. Group of Manipulaors Company Based Each Parameter Index
companies. Total companies classified as manipulators based on each index calculated are depicted in the figure below.
Figure 1
Group of Companies Manipulators Based on Each Parameter
3.1.2. Company Classification Results
Once calculated and compared with the index parameters of each indicator, overall it can be seen that there are 5 companies or 8% are classified as manipulators, 2 companies or 3% belong to gray company, and 57 or 89% of companies belonging to non-manipulators. The company classification results are clearly illustrated in the following figure.
Figure 2
Percentage of company manipulators, gray company, non-manipulators
3.2. Discussion
3.2.1. Manipulators Company
Based on data analysis using Beneish ratios can indicate there are 5 manufacturing company or 7.81% classified as manipulators. The company is INCI, AMIN, TRIS, KICI, and CEKA. It can be predicted that the five companies have the potential to present financial statements that are not in accordance with accounting standards. In the independent auditor's report, it can be seen that the auditor's opinion on INCI, AMIN, and TRIS companies is
fair but there is an emphasis on a matter. While the auditor's opinion on the KICI and CEKA companies declared unqualified.
From the total company manipulators shown by each indicator, it can be concluded that the possibility of the company manipulating its financial statements by minimizing the burden to strengthen earnings, minimizing depreciation and amortization expenses, increasing asset value to strengthen financial position, and materiality risk on cash. For investors and creditors who have invested in companies belonging to this class, should be more alert to risks that may arise in the future, such as the return on investment and the risk of default that affects the public.
3.2.2. Gray Company
Based on the results of data analysis, it is known that the manufacturing companies are classified gray company amounted to 2 companies or 3.13%, namely ARNA and MYOR.
Companies of this category can’t be called as manipulators nor non-manipulators, as they don’t significantly meet the two categories. Although it does not meet the category of manipulators, it is possible that the company of this category has the potential to make efforts related to the manipulation of financial statements, although not significant and contains no materiality. For investors and creditors should be more careful in deciding investment and credit policies against companies that fall under this category, because it does not rule out the company will manipulate in the future.
3.2.3. Non-Manipulators Company
or manipulation, so that stakeholders can increase trust. Therefore, companies of this category should get rewards for their commitment to safeguard the interests and beliefs of users of financial statements.
4.
CONCLUSION AND
SUGGESTION
This study aims to determine the number of manufacturing companies classified as manipulators, gray companies, and non-manipulators as measured by Beneish model analysis. This study uses a sample of 64 annual financial statements of manufacturing companies in 2015 and 2016 listed on the Indonesia Stock Exchange. The result of data analysis shows there are 5 manufacturing companies or 7.81% enter into the category of manipulators. Gray company category amounted to 2 companies or 3.13%. While manufacturing companies belonging to non-manipulators companies amounted to 57 companies or 89.06%. The results of this study indicate that (1) still found companies that have the potential to manipulate the financial statements, even the number increased by 5 companies or 8%. (2) as many as 2 companies or 3.13% of the total sample companies classified as gray company. (3) there are 57 companies or years from the period 2012-2016, but in 2015 the average sales of companies decreased, so it can’t be included in the sample. In addition, there are no supporting variables to indicate the extent to which companies cheated. For further research is suggested to do research on similar industries that are not listed on the Stock Exchange, such as SMEs. Expected to extend the study period of more than 2 years in order to know the consistency of the category of companies whether classified as manipulators, gray company, or non-manipulators. In addition, in order to add
support variables other than 8 Beneish variables to be considered, so that can be obtained better results.
5.
REFERENCES
Aprilia. (2017). Analisa Pengaruh Fraud Pentagon terhadap Kecurangan Laporan Keuangan Menggunakan Beneish Model pada Perusahaan yang Menerapkan ACGS. Jurnal Akuntansi Riset Vol. 6 No. 1 2017 pp 96-126 , 106-108.
Beneish, M. D. (1999). The Detections of Earnings Manipulation.
Dalnial, H., A. K., Sanusi, Z. M., & Syafiza, K. (2014). Accountability in financial reporting : detecting fraudulent firms.
Procedia-Social and Behaviourial Science 145 61-69 .
Efitasari, H. C. (2013). Pendeteksian Kecurangan Laporan Keuangan dengan Beneish Ratio Index pada Perusahaan Manufaktur yang Listing di BEI pada tahun 2010-2011. Skripsi , 6.
Hong, J. Y., & Park, S. W. (2014). Fraud Firms and the Matching Principle : Evidence in Korea. Gadjah Mada International Journal of Business Vol. 16 No. 2 .
Joseph, O. N., Albert, O., & Bharuhanga, J. (2015). Effect of Internal Contol on Fraud Detection and Prevention in District Treasuries of Kakamega Country. International Journal of Business and Management Invention Vol. 4 Issue 1 .
Kartikahadi, H., & dkk. (2012). Akuntansi Keuangan berdasarkan SAK berbasis IFRS. Jakarta: Salemba Empat.
Kieso, D. E., & dkk. (2007). Intermediate Accounting Edisi 12 Jilid 1. Jakarta: Erlangga.
Management Science and Business Research Vol. 4 Issue 10 .
Lou, Y. I., & Wang, M. L. (2009). Faktor Resiko Fraud dengan Fraud Triangle .
Journal Business and Economic
Research Vol. 7 No. 2 .
Priantara, D. (2013). "Fraud Editing and Investigation" Edisi Asli. Jakarta: Mitra Wacana Media.
Sadeli, M. (2002). Dasar-Dasar Akuntansi.
Jakarta: Bumi Aksara.
Sanusi, Z. M., Mohammed, N., Omar, N., & Mohd Nassir, M. D. (2015). Effects of Internal Controls, Fraud Motives abd Experience in Assesing Likelihood of Fraud Risk. Journal of Economics, Business and Management Vol. 3 No. 2 .
Tuanakotta, T. M. (2012). Akuntansi Forensik dan Audit Investigatif.
Jakarta: Salemba Empat.
Tuanakotta, T. M. (2013). Mendeteksi
Manipulasi Laporan Keuangan.
Jakarta: Salemba Empat.
Wijayanti, A. (2013). Pengembangan Sistm Informasi Akuntansi. Surakarta: Fairuz Media.
Wulandari, A. F., Wijayanti, A., & Chomsatu, Y. (2017). Persepsi Pegawai Bagian Keuangan Dinas Kabupaten Sragen terhadap faktor penyebab fraud di sektor pemerintahan. Seminar Nasional IENACO .
Yucel, E. (2012). Effectiveness of Red Flags in Detecting Fraudlent Financial Reporting . Journal of Accounting and Finance .
Yudhanti, N. C., & Suyandhari, E. (2016). Faktor-Faktor yang Mempengaruhi Indikasi Fraud dengan Fraud Diamond. Jurnal Ekonomi dan Bisnis .
APPENDIX
Appendix 1
Result of Calcuation Index
No. Emiten DSRI GMI AQI SGI DEPI SGAI LEVI TATA
24. SIPD 0,981 0,479 0,868 1,149 0,796 0,713 0,824 -0,033 25. ALDO 0,952 1,139 1,147 1,238 0,875 1,023 0,958 0,045 26. FASW 1,380 0,392 0,328 1,184 1,118 0,750 0,988 -0,051 27. KDSI 0,950 0,944 1,082 1,164 0,937 0,854 0,933 0,039 28. SPMA 0,589 0,963 0,900 1,192 0,952 0,870 0,763 0,130 29. AMIN 0,647 1,052 1,838 1,656 0,906 0,850 0,880 0,240 30. KRAH 0,877 0,932 1,224 1,104 1,428 0,893 1,050 -0,181 31. BRAM* 1,182 0,828 1,061 1,060 0,982 0,963 0,890 -0,005 32. GJTL 1,237 0,863 0,883 1,051 0,965 1,024 0,993 -0,033 33. NIPS 0,955 1,076 0,932 1,052 3,000 1,005 0,867 0,103 34. SMSM 1,182 0,956 1,024 1,027 0,950 1,028 0,852 0,029 35. INDR* 1,272 0,967 1,251 1,014 1,003 0,850 1,024 -0,028 36. PBRX* 1,003 0,947 0,861 1,152 0,882 1,029 1,111 0,069 37. RICY 1,046 1,150 1,316 1,099 0,928 1,008 1,021 -0,046 38. SRIL* 1,339 1,003 2,132 1,093 1,023 0,907 1,006 -0,003 39. TRIS 0,995 1,131 1,978 1,049 1,045 0,981 1,103 -0,073 40. JECC 0,925 0,649 1,150 1,225 0,818 1,246 0,965 -0,015 41. KBLI 0,936 0,564 1,902 1,056 0,210 1,146 0,870 0,034 42. KBLM 0,655 0,970 0,244 1,020 0,915 0,863 0,911 0,015 43. SCCO 0,781 0,641 1,105 1,059 0,975 1,241 1,046 -0,168 44. CINT 0,883 1,132 1,184 1,039 0,864 1,065 1,032 -0,047 45. KICI 1,749 1,114 1,299 1,083 0,990 0,973 1,202 0,001 46. ADES 0,918 0,979 0,678 1,325 1,086 0,994 1,004 0,004 47. TCID 0,686 0,974 1,075 1,092 0,934 1,039 1,043 -0,065 48. UNVR 1,041 0,999 0,751 1,098 0,959 1,000 1,037 -0,066 49. DVLA 1,043 0,940 0,700 1,111 1,233 0,963 1,008 -0,020 50. INAF 1,061 0,987 1,855 1,033 0,986 1,054 0,951 0,127 51. KAEF 1,069 0,986 0,805 1,196 1,156 1,009 1,265 -0,008 52. KLBF 0,974 0,981 0,975 1,083 1,011 0,996 0,901 0,030 53. TSPC 0,923 0,999 1,035 1,117 1,042 1,032 0,956 0,020 54. HMSP 1,261 0,978 0,941 1,072 0,966 0,947 1,018 -0,080 55. AISA 1,111 0,824 0,312 1,089 1,016 1,136 0,959 0,228 56. CEKA 1,440 0,811 9,368 1,181 0,931 0,947 0,663 0,079 57. DLTA 0,949 0,907 1,493 1,054 0,967 0,980 0,852 -0,032 58. ICBP 1,072 0,962 0,945 1,086 1,138 0,955 0,940 -0,015 59. INDF 1,041 0,926 1,285 1,042 1,104 1,031 0,877 -0,133 60. MLBI 1,141 0,915 0,708 1,210 0,889 0,938 1,006 -0,100 61. MYOR 1,046 1,061 2,411 1,238 0,922 0,894 0,950 0,020 62. ROTI 0,972 1,030 1,643 1,160 0,855 1,071 0,902 0,011 63. STTP 1,209 1,001 0,928 1,033 1,010 1,096 1,054 0,081 64. ULTJ 0,968 0,903 0,976 1,066 0,897 0,991 0,843 -0,019
Notes : (*) a company that provided their financial statements in Dollar (US $)
Appendix 2 Classified of Company
No. Emiten DSRI GMI AQI SGI DEPI SGAI LEVI TATA HASIL
1. SMBR M N N N M N M N N
2. SMCB N G M N N M M N N
3. AMFG N G N N M M M N N
4. ARNA G G G G N M N G G
5. KIAS N G G N N M M N N
7. ALKA N N N G M M N N N
8. JKSW N M N M N M N N N
9. JPRS G M N N N N M N N
10. KRAS N N N N N N N M N
11. BUDI N N G N N N N N N
12. EKAD N N N N M M N N N
13. INCI G G N G M M M M M
14. TPIA M N N G N M N N N
15. AKPI N N N N N N N N N
16. APLI N N N G M M N N N
17. BRNA G M M N N M N N N
18. IGAR N N N G N N N N N
19. TALF N G N G M M N N N
20. YPAS G G N N N N M N N
21. CPIN N N N G N M N N N
22. JPFA N N N N M N N M N
23. MAIN N N M N N N N N N
24. SIPD N N N G N M N N N
25. ALDO N G G G N N N M N
26. FASW G N N G M M N N N
27. KDSI N N G G N M N M N
28. SPMA N N N G N M N M N
29. AMIN N G M M N M N M M
30. KRAH N N G N M M N N N
31. BRAM G N G N N M N N N
32. GJTL G N N N N N N N N
33. NIPS N G N N M N N M N
34. SMSM G N N N N N N G N
35. INDR G N G N N M N N N
36. PBRX N N N G N N M M N
37. RICY G G M N N N N N N
38. SRIL G N M N N M N N N
39. TRIS N G M N M M M N M
40. JECC N N G G N N N N N
41. KBLI N N M N N N N M N
42. KBLM N N N N N M N N N
43. SCCO N N G N N N N N N
44. CINT N G G N N N N N N
45. KICI M G M N N M M N M
46. ADES N N N G M M N N N
47. TCID N N G N N N N N N
48. UNVR G N N N N N N N N
49. DVLA G N N N M M N N N
50. INAF G N M N N N N M N
51. KAEF G N N G M N M N N
52. KLBF N N N N N M N G N
53. TSPC N N N N N N N G N
54. HMSP G N N N N M N N N
55. AISA G N N N N N N M N
56. CEKA G N M G N M N M M
57. DLTA N N M N N M N N N
58. ICBP G N N N M M N N N
60. MLBI G N N G N M N N N
61. MYOR G G M G N M N G G
62. ROTI N G M G N N N N N
63. STTP G N N N N N M M N
64. ULTJ N N N N N M N N N