CHAPTER III
RESEARCH METHOD
This chapter covers Research method that consists of research type, Research
Method that consist of research type, research design, place of the study,
population and sample of the study, research instruments, research instruments
validity, research instrument reliability, index difficulty, data collection
procedures, data analysis procedure.
A. Research Type
The type of research is quasi experiment. Quasi-experiment study designs
are similar to randomized experimental design in that they involve manipulation
of an independent variable but differ in that subjects are not randomly assigned to
treatment groups because. The quasi-experimental be aware of the threats to both
internal and external validity and consider those factors in their interpretation.
Although true experimental are preferred, quasi-experimental design are
considered worthwhile because they permit researchers to reach reasonable
conclusions even through control is not possible.1
Therefore, the writer used quasi experiment because it was not based on
random assignment of subjects to experiment and control groups. There were two
groups in this model. They are experiment group and control group. The groups
were given pre-test and post-test. Pretest was given to know pre-ability before
1
giving of the treatment and posttest was given to measure the students’ score after
given treatment.
B. Research design
The design of this study was experimental design. Experimental design is a
plan for an experiment that specifies what independent variables will be applied,
the number of levels of each, how subjects are assigned to groups, and the
dependent variable.2 The writer used the experimental design because the writer
wanted to measure the effectiveness of using word wall in teaching vocabulary.
C. Place and Time of the study
This study conducted in MTs Muslimat NU Palangka Raya, Pilau street
number 41 on the eight grade students, second semester. This study took
time consumed about 2 months starting from April until May 2016.
D. Population and sample of the study 1. Population
A population is defined as all members of any well-defined class of people,
events, or objects.3 The population of this research was eighth grade students at
MTs Muslimat NU Palangka Raya. There are three classes and the numbers of
students are:
2
Donal Ary, Introduction to Research in Education (Eight edition), United State: Wadsworth (engange learning), 2010,p. 641.
3
Table 3.1 Population
NO CLASSES NUMBER OF STUDENT
1 VIII-a 39
2 VIII-b 40
3 VIII-c 39
Total 118
2. Sample
A sample is a portion of a population.4 The writer took two classes to be the
sample. The first class was experiment group that used word wall. The second
class was control group that was not used word wall. In addition, the writer used
cluster sampling because the unit chosen is not an individual but a group of
individuals who are naturally together or grouped by the school5. The writer used
cluster sampling for it. According to the teacher , the class VIII-a and class VIII-c
have represented average English achievement of whole the population. So, it
helped the writer to choose that class as sample of the study. The number of
sample can be seen as follow:
4
Ibid, p.148
5
Table 3.2 Number of Sample
NO Group Class of student Number of student
1 E VIII C 39
2 C VIII A 39
Total 78
E : Experiment Group
C : Control
Table 3.3
Design of pre-test and post-test
Group Pre-test Treatment Post-test
Experiment Group T X Y
Control Group T - Y
T :Pretest Result
X : Treatment Result
Y : Post Test Result
E. Research Instruments 1. Research Instruments
To get the data, the writer used this instrument in this study. Here, the writer
a. Test
A test is a set of stimuli presented to an individual in order to elicit
responses on the basis of which a numerical score can be assigned.6 To get
the data, the writer does the test; it consists of pre test and post test. The
function of pre test is to know how many students’ vocabulary before they
uses word wall. And the function of post test will be to know how many
students’ vocabulary that has already had after they uses word wall as
media.
According to Thurnbury Multiple choice tests are a popular way of
testing in that they are easy to score and they are easy to design. Moreover
, the multiple choice format can be used with isolated words, words in a
sentence context, or words in whole text.
The writer makes test of multiple-choice item, because the multiple
choice item is generally recognized as the most widely applicable and useful
type of objective test. It can more effectively measure many of the simple
learning outcomes measured by the short-item or completion.7So, the writer
used test of multiple choices item that consist of 100 items. The items were
test to try-out which to know the instrument valid or no. Then some
questions which are valid used in pre-test and post-test.
6
Ibid, p. 201.
7
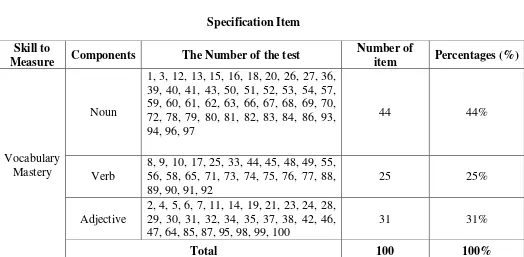
The tables of specification item of the test and specification item
are below:
Table 3.4
Specification Items Of The Test
Table 3.5 Specification Item Skill to
Measure Components The Number of the test
Number of
item Percentages (%)
Vocabulary Mastery
Noun
1, 3, 12, 13, 15, 16, 18, 20, 26, 27, 36, 39, 40, 41, 43, 50, 51, 52, 53, 54, 57, 59, 60, 61, 62, 63, 66, 67, 68, 69, 70, 72, 78, 79, 80, 81, 82, 83, 84, 86, 93, 94, 96, 97
44 44%
Verb
8, 9, 10, 17, 25, 33, 44, 45, 48, 49, 55, 56, 58, 65, 71, 73, 74, 75, 76, 77, 88, 89, 90, 91, 92
25 25%
Adjective
2, 4, 5, 6, 7, 11, 14, 19, 21, 23, 24, 28, 29, 30, 31, 32, 34, 35, 37, 38, 42, 46, 47, 64, 85, 87, 95, 98, 99, 100
31 31%
Total 100 100%
No Vocabulay
Mastery Specification item test Noun Verb Adjective
1 Complete sentence 23 6 11
2 Definition 6 3 5
3 Antonym - 5 5
4 Synonym 2 1 3
5 Picture 13 11 6
Total 44 26 30
2. Research Instruments Try Out
The writer gave test of try out to eight grade students at MTs Muslimat Nu
Palangka Raya (VIII-B). It was conducted on Saturday, March 16th, 2016, at
12.05 – 01.20 am in VIII-B room with the number of student were 40 students.
To get the data of try out, the writer used some procedures as follows:
a. The writer made and prepared test of try out.
b. The writer gave test of try out to the students
c. The writer asked the students to do test of try out.
d. The writer collected the student’s answer.
e. The writer calculated and gave score to the students’ answer.
f. The writer analyzed the result of try out to know valid of test try out.
g. If the results were valid, it meant that the test items as the instrument of this
study is suitable to be give.
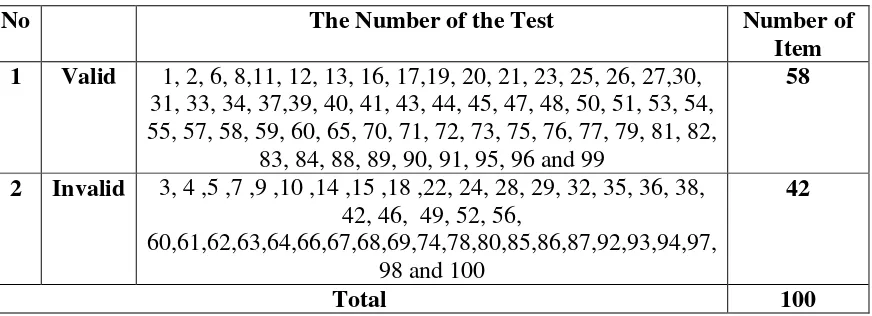
Table 3.6 The Result of Try Out
No The Number of the Test Number of
Item 1 Valid 1, 2, 6, 8,11, 12, 13, 16, 17,19, 20, 21, 23, 25, 26, 27,30,
31, 33, 34, 37,39, 40, 41, 43, 44, 45, 47, 48, 50, 51, 53, 54, 55, 57, 58, 59, 60, 65, 70, 71, 72, 73, 75, 76, 77, 79, 81, 82,
83, 84, 88, 89, 90, 91, 95, 96 and 99
58
2 Invalid 3, 4 ,5 ,7 ,9 ,10 ,14 ,15 ,18 ,22, 24, 28, 29, 32, 35, 36, 38, 42, 46, 49, 52, 56,
60,61,62,63,64,66,67,68,69,74,78,80,85,86,87,92,93,94,97, 98 and 100
42
Total 100
Based on the table above, the questions valid are 58 and the questions
invalid are 42.
Validity of a test is the extent to which the test measures what is
intended to measure. An instrument was considered to be a good one if it
meets some requirement. One of them is validity.
Every test, whether it is a short, informal classroom test or a public
examination, should be a valid a constructor could make it. The test must
aim to provided a true measure of a particular skill which it is intend to
measure, to the extent that is measure external knowledge and other skills at
the same time, and it would not be a valid test. Validity on this study is
distinguish into some kinds as followed:
a. Face Validity
This type of validity, in fact is often refer to as face validity: If a test item
looks right to other testers, teachers, moderators, and tastes.8 The test used
by the writer is suitable to others and at the same level that is Senior High
School level.
b. Content Validity
This kind of validity depends on a careful analysis of the language being
tested and of the particular course objectives. The test should be so
constructed as to contain a representative sample of the course, the
relationship between the test items and the course objectives always
being apparent. 9 In making the test, the writer tried to match each of the
test items with the syllabus that used by MTs Muslimat NU Palangka
8
J.B.Heaton, Language Testing,(Published Test, May: 1989), p. 153.
9
Raya. The writer made the test content (question) related with material
was teach to the students.
c. Construct Validity
If a test has construct validity, it is capable of measuring certain specific
characteristics in accordance with a theory of language behavior and
learning.10 Type of test was vocabulary test, and the form of test was
multiple choices. In this study, the test was written test to measure the
students’ vocabulary knowledge.
To measure the validity of the instrument, the writer used the formulation of
product moment by Pearson follows:11
rxy =
𝑁 𝑋𝑌 − 𝑋 𝑌
𝑁. 𝑋2− 𝑋 ² 𝑁. 𝑌2− 𝑌 ²
Where:
rxy : Numeral of index correlation ‘r’ product moment
N : Total of sample
∑XY : Amount of the product between X score and Y score
∑X : Amount of the x score
∑Y : Amount of the y score
10
Ibid, p. 154.
11
To know the validity level of the instrument, the result of the test was
interpreted to the criteria below:12
0,80 - 1000 = very high validity
0,60 - 0,799 = high validity
0,40 - 0,599 = fair validity
0,20 - 0,399 = poor validity
0,00 - 0,199 = very poor validity
4. Research Instruments Reliability
Reliability also means the consistency with which a test measures the same
thing all the time. Reliability of a test refers to its consistency with which it yields
the same rank for an individual taking the test several times.13 The reliability of
the whole test can be estimated by using the formula:
𝑟11 =
𝑁
𝑁 −1 1−
𝑚 𝑁 − 𝑚
𝑁𝑥2
Where:
N = the number of items in the text
M = the mean score on the test for all the testes
12
Ibid, p. 76.
13
X = the standard deviation of all testes’ scores14 .
5. Index difficulty
The index of difficulty (or the facility value) of an item simply shows how
easy or difficulty the particular item proved in the test. The index of difficulty
(F.V) is generally expressed as the fraction (or percentage) of the students who
answered the item correctly. It is calculated by using the formula:
F. V =R N
R is represents the number of correct answer and N is the number of
students taking the test.15
F. Data Collection Procedure
To get the data, the writer used some procedures as follows:
1. The writer chose the place of the study.
2. The writer determined two groups, the first group was experiment group and
the second group was control group.
3. The writer gave pre test to both classes (experiment group and control group).
4. The writer checked the result of pre test.
5. The writer gave treatment (teaching) to the experiment group using cartoon
movie and the writer taught the control group without cartoon movie.
6. The writer gave post test to both classes.
14
J. B. Heaton, Writing English Language Tests, Longman, 1975, p. 157.
15
7. The writer checked the result of post test.
8. The writer gave score to students’ answer (pre test and post test).
G. Data Analysis Procedure
To analyze the data that has been collected; the writer used some procedures
in this study:
1. The writer gave test to the students of the eight grades students at MTs
Muslimat Nu Palangka Raya.
2. The writer collected the data of the students’ test result.
3. The writer gave score the students’ test result by using the formula:
Score = 𝐵
𝑁 × 100
16
Where:
B : Frequency of the correct answer
N : Number of test items
4. The writer tabulated the data into the distribution of frequency of score table,
then looking for the mean, median, modus, standard deviation, and standard
error of experiment group and control group.
Formula of mean, median and modus: 17
a. Mean
𝑀𝑥= 𝑓𝑥
𝑁
16
Anas Sudijono, Pengantar Evaluasi Pendidikan, Jakarta: Rajagrafindo
17
Where:
Mx : Mean
Fx : Total result product between each score with frequency
N : Number of case
b. Median
𝑀𝑑𝑛=𝑢 −
1 2
𝑁 − 𝑓𝑘𝑎
𝑓𝑖 ×𝑖
Where:
Mdn : Median
N : Number of case
Fkb : Cumulative frequency located in under interval contain median
Fi : Authentic frequency (frequency of score contain median)
i : Interval class
c. Modus
𝑀𝑜= 𝑢 − 𝑓𝑏
𝑓𝑎+𝑓𝑏×𝑖
Where:
Fa : frequency located in above interval contain modus
Fb : frequency located in under interval contain modus
i : Interval class
Formula of standard deviation and standard error: 18
d. Standard Deviation
𝑆𝐷= 𝑓𝑥²
𝑁
Where:
SD : Standard Deviation
i : Interval
N : Number of students
e. Standard Error
𝑆𝑒𝑚= 𝑠𝑑
𝑛−1
Where:
Sem : Standard Error
Sd : Standard Deviation
18
N : Number of students
5. The writer calculated normality and homogeneity.
a. Normality
It was used to know the normality of the data that is going to
be analyzed whether both groups have normal distribution or not. Chi
square was used here:19
2 = ( fo−fh )2 fh
Where:
𝟐 = Chi square
fo = frequency from observation
fh = expected frequency
Calculation result of 𝟐was compared with x table by 5% degree
of significance. If 𝟐 was lower than x table, so the distribution list was
normal.
b. Homogeneity
It was used to know whether experimental group and control
group, that are decided, come from population that has relatively same
variant or not. The formula is:20
F = Bigger Variant
Smaller Variant
19
Sudjana, Metode Statistika, Bandung: Tarsito, 1996, p. 273.
20
Where:
F : Frequence
The hypotheses in homogeneity:
Fvalue ≤ Ftable, means both of variants are homogeneity.
Fvalue > Ftable, both of variants are homogeneity.
If calculation result of F was lower than F table by 5% degree
of significance so Ho was accepted, it meant both groups have same
variant.
6. The writer calculated the data by using t-test to examine the hypothesis of the
study. To examine the hypothesis, the writer used t-test formula as follows: 21
𝑡𝑜= 𝑀1− 𝑀2
𝑆𝐸𝑚1− 𝑚2
Where:
M1-M2 : The difference of two mean.
SEm1-m2 : The standard error of difference between two mean.
To know the hypothesis was accepted or rejected using the criterion:
If t-test ≥ ttable, it meant Ha was accepted and Ho was rejected.
If t-test ≤ ttable, it meant Ha was rejected and Ho was accepted.
7. The writer interpreted the result of t-test. The writer accounted degree of
freedom (df) with the formula as follows: 22
𝑑𝑓= (𝑁1 +𝑁2−2)
Where:
21
Anas Sugiono, Pengantar Statistik Pendidikan, Jakarta: Rajawali Press, 1978, p. 372
22
df : Degree of freedom
N1 : Number of subject group 1
N2 : Number of subject group 2
2 : Number of variable
8. The writer discussed and concluded the result of data analysis.
Figure 3.1 Steps of collecting, data analysis procedure and testing hypothesis
Vocabulary Class
Experiment Class Control Class
Pre-Test Scoring Pre-Test
Treatment Taught by Word Wall
Treatment Used Teaching
Post- Test Scoring Post- Test
Measuring Normality, Homogeneity