CHAPTER IV
RESULT OF THE STUDY AND DISCUSSION
This chapter described the obtained data of the students’ mastery of simple
past tense and writing score. The presented data consisted of score description,
normality, linearity, homogenity testing and analysis of hypothesis.
A. Description of the Data
1. The Students’ Score of Simple Past Tense Mastery Test
The score of students’ mastery are distributed in the following table:
The Description Data of the Students’ Mastery of Simple Past Tense Score
NO. Sample X X2
Based on the data above, students` mastery of simple past tense as the
varibale X, it was known ∑X was 3536 and ∑X² was 7072 mean of the
simple past tense mastery score was 57.03, maximum of the score was 86
and minimum of the score was 30. To know the classification of the
students’ score can be seen on the table below:
Distribution of Students’ Achievement Criteria of Simple Past Tense Mastery of MTsN 2 Palangka Raya
No. Category Score Frequency
1. 80-100 2
100. There were six students who got score 70-80. There were seventeen
students who got score 60-70. There were sixteen students who got score
classification of the students’ achievement criteria of heavy value and
predicate can be seen on the table below:
Distribution of Students’ Achievement Criteria of Mastery of Simple Past Tense Score
Mark Value Letter Value Heavy Value Predicate
80-100 A 2 Excellent
70-80 B 6 Good
60-70 C 17 Fair
50-60 D 16 Poor
0-50 E 21 Very Poor
To determine the frequency of score, percent of score, and cumulative
percent calculated using manual calculation as follows:
The Frequency of Score, Percent of Score,
Valid Percent and Cumulative Percent calculated using Manual Calculation
Category
Score Frequency Percent Valid Percent
There were 25.81% students who got score 50-60. And there were 33.87%
Based on the result above using manual calculation, it was found that
the mean score of simple past tense mastery score was 57.03. The
distribution of students’ mastery of simple past tense score can also be
seen in the following figure.
Histogram of Students’ Simple Past Tense Mastery Score
It can be seen from the figure above the students’ mastery of simple
past tense score. There were twenty one students who got 0-50 with
predicate very poor. There were sixteen students who got score 50-60 with
predicate poor. There were seventeen students who got score 60-70 with
predicate fair. There were six students who got score 70-80 with predicate
good. And there were two students who got 80-100 with predicate
excellent.
The next step, the result calculated the score of mean using SPSS 17
program as follows:
The Calculation of Statistics using SPSS 17
N Valid 62
Based on the table above, the result calculated using SPSS 17, it was
found that the mean of score were 57.03, the standard deviation was 12.51
and the standard error of mean was 15.98. Then, based on valuation scale
used in MTsN 2 Palangka Raya, the average of the students’ mastery of
simple past tense was in fair criteria.
2. The Students’ Score of Writing Test
The Description Data of the Students’ Writing Score
NO. SAMPLE Y Y2
Based on the data above, writing as the varibale Y, it was known ∑Y
was 4239.5 and ∑Y² was 8479, mean of the writing score was 68.38,
maximum of the score was 88 and minimum of the score was 46. To know
the classificaton of the students’ score can be seen on the table below:
Distribution of Students’ Achievement Criteria of Writing Anecdote Ability of MTsN 2 Palangka Raya
No. Category Score Frequency
Based on the data above, there were six students who got score
80-100. There were twentythree students who got score 70-80. There were
seventeen students who got score 60-70. There were eleven students who
got score 50-60. And there were five students who got score 0-50.
The next, to know the classificaton of the students’ achievement
criteria of heavy value and predicate can be seen on the table below:
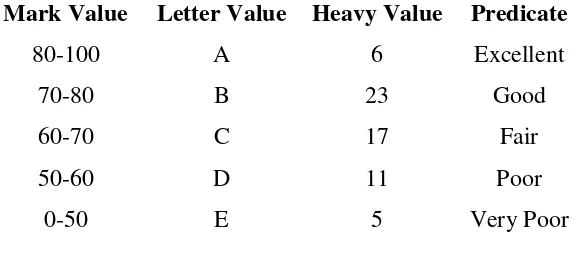
Table Distribution of Students’ Achievement Criteria of the
Writing Score
Mark Value Letter Value Heavy Value Predicate
80-100 A 6 Excellent
70-80 B 23 Good
60-70 C 17 Fair
50-60 D 11 Poor
0-50 E 5 Very Poor
To determine the frequency of score,percent of score, and cumulative
percent calculated using manual calculation as follows:
The Frequency of Score, Percent of Score,
Valid Percent and Cumulative Percent calculated using Manual Calculation
Category
Score Frequency Percent Valid Percent
Based on the data of percent of score, it can be concluded that there
Based on the result above using manual calculation, it was found that
the mean score of writing score was 68.38. The distribution of students’
writing score can also be seen in the following figure.
Histogram of Students’ Writing Score
It can be seen from the figure above the students’ writing score. There
were five students who got score 0-50 with predicate very poor. There
were eleven students who got score 50-60 with predicate poor. There were
seventeen students who got score 60-70 with predicate fair. There were
twenty three students who got score 70-80 with predicate good. And there
were six students who got score 80-100 with predicate excellent.
The next step, the result calculated the score of mean using SPSS 17
program as follows:
Calculation of Statistics using SPSS 17
N Valid 44
Missing 0
Mean 68,38
Std. Error of Mean 13,67
Std. Deviation 10,74
Minimum 46
Maximum 88
Based on the table above, the result calculated using SPSS 17, it was
found that the mean of score were 68,38, the standard deviation was 10,74
and the standard error of mean was 13,67. Then, based on valuation scale
used in MTsN 2 Palangka Raya, the average of the students’ writing score
was in fair criteria.
B. Testing of Normality, Homogeneity and Linearity
1. Testing of the Normality
It used to know the normality of the data that was going to be
analyzed whether both groups have normal distribution or not. Because of
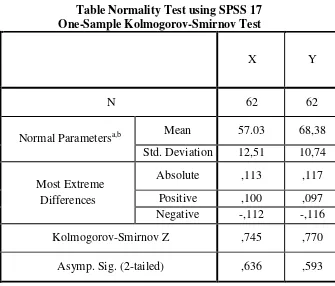
Table Normality Test using SPSS 17 One-Sample Kolmogorov-Smirnov Test
X Y
N 62 62
Normal Parametersa,b Mean 57.03 68,38
Std. Deviation 12,51 10,74
Most Extreme Differences
Absolute ,113 ,117
Positive ,100 ,097
Negative -,112 -,116
Kolmogorov-Smirnov Z ,745 ,770
Asymp. Sig. (2-tailed) ,636 ,593
The criteria of the normality test was if the value of (probability
value/critical value) was higher than or equal to the level of significance
alpha defined (r > a), it meant that the distribution was normal. Based on
the calculation using SPSS 17 above, the value of (probably value/critical
value) from vocabulary and writing score in Kolmogorov-Smirnov Z table
was higher than level of significance alpha used or r = 0,745 > 0,05 for
vocabulary score and r = 0,770 > 0,05 for writing score. So, the
distribution was normal. It meant the students’ score of simple ast tense
2. Testing of the Homogeneity
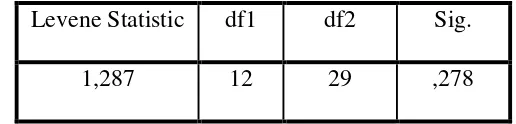
Table Homogeneity Test using SPSS 17
Levene Statistic df1 df2 Sig.
1,287 12 29 ,278
The criteria of the homogeneity test was if the value of (probability
value/critical value) was higher than or equal to the level significance
alpha defined (r > a), it meant the distribution was homogeneity. Based on
the calculation using SPSS 17 program above, the value of (probably
value/critical value) from simple past tense master and writing score of
variance in sig column was known that p-value was 0,278. The data in this
study fulfilled homogeneity since the p-value was 0,278 > 0,05.
3. Testing of the Linearity
It used to know the correlation linearity of the data that was going to
be analyzed between independent and dependent variable. Because of that,
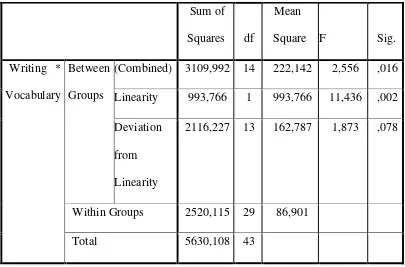
Table Linearity Test using SPSS 17
0,078, and analysis above showed that value F was 1,873 with Sig. 0,078
higher than level of significance alpha or 0,078 > 0,05 for vocabulary
mastery and writing ability. So, it concluded that correlation between
C. The Result of Data Analysis
1. Testing Hypothesis using Manual Calculation
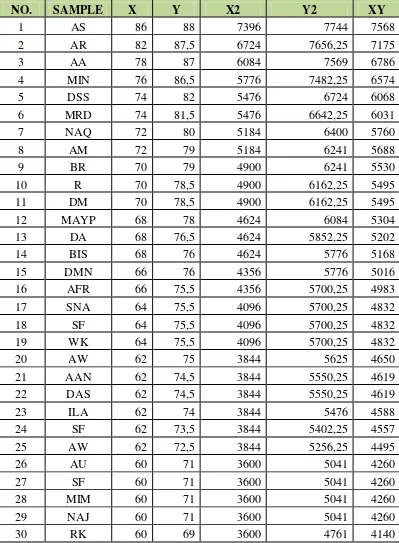
Table Distribution Scores Simple Past Tense Mastery and Writing Ability
To find out the correlation between simple past tense mastery and
writing ability of the eight graders MTsN 2 Palangka Raya, this study used
Product Moment Formula by Pearson, as follow:
rxy = ( )( ) √* ( )+* ( )+
From the calculation of variable X and variable Y, it was known that:
N = 62
The calculation above had shown index correlation of variable X and
Y was 0,987. Based on the interpretation orientation score of “r” product,
variable Y there is very high correlation. It meant simple past tense
mastery had association with writing ability.
The result of the calculation that was counted by product moment
above showed that the index of correlation was 0,987. Then, the degree of
calculation degree of freedom with formula, as follow:
df = N – nr
It was known:
N =62, nr =2
Df = 62 – 2 = 60
The significant choose at 5%, it meant the significant level or refusall
at 5%. It was illustrated as follow:
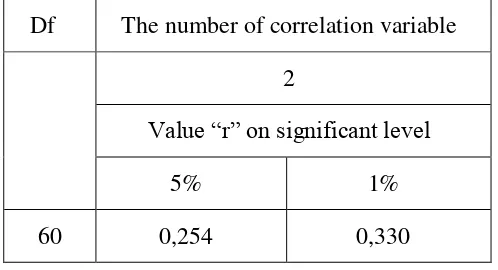
Table Critical Value of the Product Moment Correlation Coefficient
Df The number of correlation variable
2
Value “r” on significant level
5% 1%
60 0,254 0,330
Even so, it was known the result of “r” = 0,254 < 0,987> 0,393. It can
be explained that the value of “r” (0,420) was higher at significance level
5% (0,304). As the result, the value of “r” showed positive correlation
between simple past tense mastery and writing ability at significant level
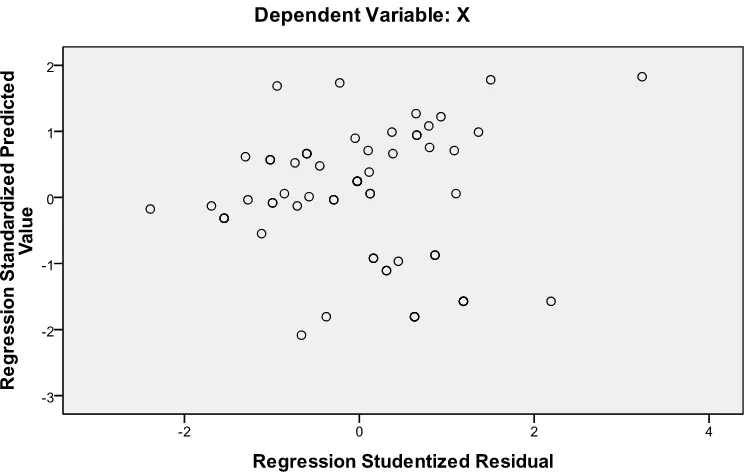
The correlation between variable X (simple past tense mastery) and
variable Y (writing ability) can be illustrated by following scatter plot as
follow:
Figure the Linear of Variable X and Variable Y
The scatter plot above illustrated the direction of the correlation
between the variables. The dots going from lower left to upper right
indicate positive correlation. A scatter plot with dots going from lower left
to upper right indicated a positive correlation as variable X goes up,
variable Y also goes up. Scatter plot of also reveals the moderate of the
correlation between variables. The scatter plot above has shown the dots
is strong correlation between two variables, simple past tense mastery and
writing anecdote ability.
To know the contribution of the variable X and Y, this study used the
formula as follow:
KP = r2 × 100%
= (0,987)2 × 100
= 0,974169 × 100% = 97,4169 %
So, it means that the variable X (simple past tense mastery) gives the
contribution’ ability in writing anecdote at eight graders of MTsN 2
Palangka Raya was 97,4169 %.
The reject or accepted hypothesis, this study calculated tvalue as follow:
Tobserved = √ √
meant there was significant correlation. If tobserved < t table, H0 was rejected.
It meant there was no significant correlation between variables. Based on
freedom used the formula nr – 2, N = 62. So, df = n – 2 = 62 – 2 = 60 and
ttable, = 2,02 at significance level 5% and 2,71 at significance level 1%. The
following table was the result of tobserved and ttable from df at 5% level, as
follow:
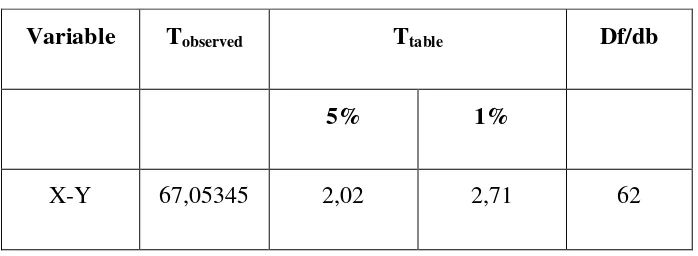
Table Result of the Manual Calculation Tobserved
Variable Tobserved Ttable Df/db
5% 1%
X-Y 67,05345 2,02 2,71 62
The result of the ttest used manual calculation, it was found the tobserved
was greater than the ttable at 5% significance level or 67,05345 > 2,02. It
means Ha (there is significant correlation between simple past tense
mastery and writing anedote text ability at eight graders of MTsN 2
Palangka Raya) is accepted and H0 (there is no significant correlation
between simple past tense mastery and writing anecdote text ability at
eight graders of MTsN Palangka raya) is rejected.
2. Testing Hypothesis using SPSS Calculation
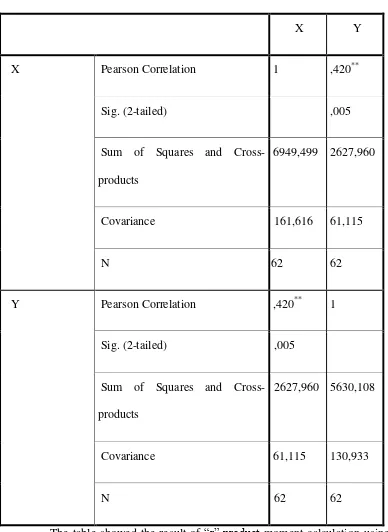
This study also applied SPSS 17 program to calculate correlation “r”
product moment in testing hypothesis of the study. The result of
calculation SPSS 17 to support the manual calculation could be seen as
Table Correlation Index used SPSS 17 Program
Correlations
X Y
X Pearson Correlation 1 ,420**
Sig. (2-tailed) ,005
Sum of Squares and
Cross-products
6949,499 2627,960
Covariance 161,616 61,115
N 62 62
Y Pearson Correlation ,420** 1
Sig. (2-tailed) ,005
Sum of Squares and
Cross-products
2627,960 5630,108
Covariance 61,115 130,933
N 62 62
The table showed the result of “r” product moment calculation using
SPSS 17 program. Since the result of Pearson Correlation was 0,420. So,
3. Interpretation
To examine the truth of the false of null hypothesis, the result of
Pearson Correlation was 0,987. Correlation , so Ha was accepted and H0
was rejected. The result of Pearson Correlation was interpreted on the
result of degree freedom to get the ttable. The result of the degree of
freedom (df) was 62, it found from total number of the students in both
group minus 2. The following table was the result of Pearson Correlation
and “r” table from df at 5% level.
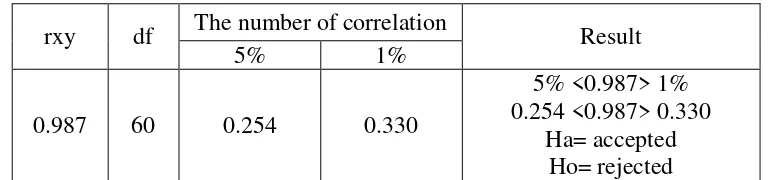
Table the Result “r” Product Moment
rxy df The number of correlation Result
5% 1%
0.987 60 0.254 0.330
5% <0.987> 1% 0.254 <0.987> 0.330
Ha= accepted Ho= rejected
Based on the result of interpretation was found the Pearson correlation
was greater than the r table at 5% significance level or 0,987> 0,304. It
means that Ha is accepted and H0 is rejected. Based on the table above
there was avarege correlation between correlation variable vocabulary and
writing.
It could be interpreted based on the result of calculation that Ha there
is correlation between students’ simple past tense mastery and writing
anecdote ability at eight graders of MTsN 2 Palangka Raya and H0 stating
and writing anecdote ability at eight graders of MTsN 2 Palangka Raya is
rejected.
D. Discussions
Based on the result of linear, the dots going from lower left to upper right
indicate positive correlation. A scatter plot with dots going from lower left to
upper right indicated a positive correlation as variable X goes up, variable Y
also goes up. Scatter plot of also reveals the moderate of the correlation
between variables. It means the data of simple past tense mastery and writing
ability in the present study have good linear association. As the result, the data
in the present study can be analyzed by using parametric statistic especially
product moment correlation.
Based on data analysis, simple past tens mastery gives contribution
97,4169% to writing ability. The result of product moment correlation has shown that the value of rxy was greater than the value of ttable at 5% and 1%
significant levels (0,304 < 0,987 > 0,393). It means that null hypothesis was
rejected and the alternative hypothesis was accepted.
Next, the dots in scatter plot of variable X and variable Y going from
lower left to upper right. It means there was positive correlation between
simpel past tense mastery and writing anecdote ability. The dots in the scatter
plot also formed a narrow band. When a straight line was drawn through the
band the dots would be near the line. It illustrated that there was moderate
correlation between the variables. So this way, alternative hypothesis is
between students’ mastery of simple past tense and their ability in writing
anecdote text of the eight grade students MTsN 2 Palangka Raya.
From the research findings, it could be considered that the good writers
may effectively create a composition in case they may excellent in grammar
and tenses: therefore to have the adequate grammatically tenses knowledge is
insisted for them. Writing is essential subject that useful for the students to
develop their idea, express their emotion through writing. Besides, writing was
representation of language in textual medium through the use of sign of
symbols. It means, it is in line with theory stated by Hamer in chapter II.
The result also shows the students’ mastery of simple past tense was
important to be developed as theorie statetd in chapter II page 12. It means that
related to writing skill in using grammar to make writing paragraph, they have
to mastery simple past tense. By mastery gramatical tenses, the students can