The journal homepage www.jpacr.ub.ac.id p-ISSN : 2302 – 4690 | e-ISSN : 2541 – 0733
Mass Spectrometry Analysis of Chromium-Binding
Low-Molecular-Weight Serum Fractions
Anna Safitri1,2, Aviva Levina2, Peter A. Lay2
1
Chemistry Dept, Brawijaya University Jl. Veteran, Malang, 65145, East Java, Indonesia
2
School of Chemistry, The University of Sydney City Road, Camperdown, NSW, 2006, Australia
Email: [email protected]
Received 3 February 2017 ; Revised 17 March 2017 ; Accepted 21 March 2017
ABSTRACT
The current work is focused on the characterization of the chromium(III)-containing low-molecular-weight (LMW) fractions of blood serum by mass spectrometry. The LMW fractions of serum binding-Cr(III) were collected by organic solvent precipitation using acetonitrile. The chromium(III) compounds used were [Cr(pic)3], where pic =
2-pyridinecarboxylato() or A, and the Cr(III) propionate complex, [Cr3O(OCOEt)6(OH2)3])+
or B. The new signals appeared in the mass spectra in the presence of added Cr(III) compounds, either A or B. This indicated that common LMW Cr containing serum fractions were formed on addition of Cr(III) to serum. The new signals contained three distinct peaks with a shift of 16, corresponding to ions of m/z +1083, +1099, and +1115 Da, which consisted of 4 Cr atoms with bridging ligands.
Keywords: acetonitrile, Cr(III), low-molecular-weight, mass spectrometry, speciation
INTRODUCTION
The major factor that causes Cr(III) to be regarded as an essential element is its purported function in carbohydrate and lipid metabolism through its interaction with insulin [1-4]. However, the acceptance of Cr(III) as an essential element for humans and animals is now widely controversial since specific chemical mechanisms and the biologically active form by which Cr(III) carries out its insulin potentiating activities has not been found yet [5, 6]. Considering the widespread and frequent use of Cr(III) nutritional supplements, and also some findings that indicated potential toxic effects of consuming [Cr(pic)3], information is
inconclusive regarding its biological functions and its speciation in biological fluids. Additionally, the low levels of Cr in humans and animals has meant that little is known about naturally occurring Cr speciation [7]. It is, therefore, the speciation of metal ion in biological systems has been conducted to reveal the biological essentiality or toxicity of the element of interest [8-10].
Several studies on the reactions of Cr(III) complexes with biomolecules have discovered that this oxidation state is mainly bound to transferrin and albumin, the most abundant proteins in blood serum [11, 12]. A recent study indicated that both [Cr(pic)3] and
[Cr3O(O2CEt)6(OH2)3]+, are able to bind to transferrin and albumin; and to an unidentified
low-molecular-weight Cr binding-substance in serum fractions [13].
protein and peptide sequencing, using methodology referred to as tandem mass spectrometry (MS/MS) [14]. In tandem mass spectrometry, two stages of mass analysis are used to detect secondary fragment ions that are formed from a particular precursor ion [15].Therefore, ESMS, and particularly MS/MS, can be applied to study speciation of Cr(III) in biological fluids.
About 10,000 different proteins are thought to exist in blood serum, most of which are present at very low relative abundances [16]. The protein content of serum is dominated by highly abundant proteins, including albumin, transferrin, immunoglobulins, and lipoproteins (Figure 1.2), which constitute 99% of the protein content of serum [17]. Only 1% of the entire protein content is of great interest in proteomic studies [17]. Consequently, the first essential step in trace element speciation studies in serum is the separation of high molecular mass (HMM) and low molecular mass (LMM) fractions. The effective method proposed to remove large abundant proteins, without loss of the molecules of interest, is the precipitation of abundant proteins with organic solvents [18]. A study by Merrel and co-workers [19] revealed that acetonitrile precipitation is a superior method to remove serum albumin and immunoglobulin, since acetonitrile not only precipitated large proteins, but also allowed the low-abundance proteins to dissociate, enabling them to be identified by LC-MS.
Results of the past work showed that Cr(III) complexes used as nutritional supplements can bind both high- and low-molecular-weight substances of serum, and the distribution of Cr(III) within serum was time-dependent [13]. While the high-molecular-weight fractions associated with Cr(III) were albumin and transferrin, the most abundant proteins in serum, identification of the low-molecular-weight fractions has proven to be a demanding task [13]. For these reasons, the current work concentrates on the investigation of LMW binding Cr(III) formed in serum during the reactions with Cr(III) nutritional supplements (used for their purported anti-diabetic activity), using mass spectrometry technique. The LMW serum fractions were collected using acetonitrile precipitation. The Cr(III) nutritional supplements used in this work were Cr(III) picolinate, [Cr(pic)3]·H2O (pic
= 2-pyridinecarboxylato()) (A), the most popular Cr(III) nutritional supplement and the second largest-selling metal supplement after calcium supplements in the United States [20], and trinuclear Cr(III) propionate, [Cr3O(O2CEt)6(OH2)3](NO3)·3H2O (B), a purported
biologically active form of Cr(III) (Fig. 1) [21].
Figure 1 Structures of Cr(III) complexes used in this work. Designations: A = [Cr(pic)3], B =
EXPERIMENT
Chemicals and Instrumentation
All reagents of analytical or higher purity grade were purchased from Merck or Sigma-Aldrich and were used as received: HCl (37% aqueous solution), HNO3 (trace pure,
65% w/w in H2O), NaOH (99.9%), NH4OAc, Na2Cr2O7, acetonitrile (MeCN), picolinic acid
(pyridine-2-carboxylic acid, picH), and ethanol. Water was purified using the Milli-Q technique.
The commercial calf serum was purchased from Invitrogen. The Cr(III) nutritional supplements, [Cr(pic)3]·H2O (A) and [Cr3O(O2CEt)6(OH2)3](NO3)·3H2O (B) were
synthesized according to the literature method [22, 23], characterized by I. Mulyani [24], their identities were confirmed by elemental analyes.
The instruments used in this study were a LCQ electrospray mass spectrometer (Finnigan, San Jose, CA, USA), and a Varian SpectrAA20 spectrometer with a GTA 96 graphite tube atomizer for performing AAS.
Procedure reaction
A stock solution of B in H2O ([Cr] = 100 mM) was prepared immediately before the
experiments. Due to the low solubility of A, its solutions in blood serum were prepared by sonication (~10 min at 50 W and 298 K), and undissolved solid was removed by centrifugation (~10 min at 10,000 rpm and 298 K). The total concentration of Cr in the saturated solutions of A and B in aqueous buffer or blood serum were determined by atomic absorption spectroscopy. The results were: concentrations of A = 1.0 mM and B = 0.3 mM.
The separation methods were adapted from Ref. [19]. Calf serum was diluted with an equal volume of buffer (0.10 M NH4OAc, pH 7.2). High-molecular-weight (HMW) fractions
were then precipitated by the addition of three volumes of acetonitrile. Samples were centrifuged at 10,000 rpm for 30 min and stored at 4°C overnight. The collected supernatants were separated and concentrated through freeze-drying at 217 K and 0.5 mbar for 24-48 h for further analysis. The same procedures were applied to a sample of blood serum spiked with Cr(III) compounds (A or B), then were incubated for 1 and 24 h, at 310 K.
The mass spectrometry analysis was conducted with the freeze-dried samples. The samples were first freeze-dried at 217 K and 0.5 mbar for 24 - 48 h. The freeze-dried samples were re-dissolved in a minimal amount of methanol:water (1:1, v/v). Buffer solution (0.10 M NH4OAc) were also spiked with samples A and B, their mass spectra were also recorded as
comparison with serum samples spiked with A and B.
The solutions to be analyzed (~20 L) were injected into a flow of methanol:water (1:1, v/v, flow rate 0.05 mL min1). Typical experiment settings were as follows: sheath gas (N2) pressure, 50 psi; spray voltage, 4.5 kV; capillary temperature, 300 K; cone voltage, 39
V; tube lens offset, 15 V; m/z range, 150-2000 (both in the positive- and negative-ion modes; no significant signals were detected in the latter mode). The acquired spectra were the averages of 10 scans. MS/MS spectra were collected using collision cell voltages from 25 V to 35 V. Simulations of the mass spectra were performed using IsoPro software [25].
RESULT AND DISCUSSION
solid of A was removed by centrifugation, and this did not affect to the measurement of subsequent analysis.
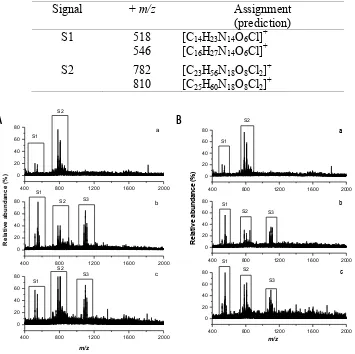
Typical ESMS spectra for the supernatants of serum spiked with A or B from acetonitrile precipitation are presented in Figure 2. The ESMS data for the low-molecular-weight serum fractions showed two distinct signals, labelled as S1 and S2. The S1 and S2 signals showed major peaks at +518, +546 (S1), +782, and +810 m/z (S2). The difference in
m/z values for both set of peaks in S1 and S2 are 28. This difference is likely to attribute to two methylene units from the alkyl side chain from the amino acid(s) residues. Assignments of these signals were predicted using IsoPro software [26], and is presented in Table 1. The simulation of isotopic distribution also was performed using IsoPro software [26], and the experimental high-resolution mass spectra for these signals, S1 and S2, confirmed the prediction (Fig. 3).
There were new signals detected after serum was spiked with either A or B for various incubation times (S3). The new ESMS signals showed major peaks at m/z +1083, +1099, and +1115, with a m/z shift of 16. This shift suggests an extra oxygen atom, and/or -NH2 species from amino acid(s) residues. The difference values between S2 and S3 are likely
to be due to Cr binding. Unfortunately, the S3 peaks could not be reproduced in high-resolution mass spectra, probably due to the cleavage of Cr ions. It should be noted that peaks at the S3 signal have different intensities. The highest intensity was shown for the m/z +1099, while the intensity for +1083 and +1115 were approximately equal.
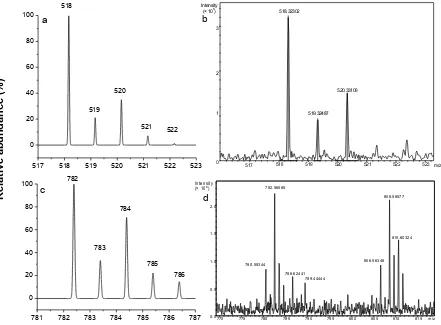
Figure 3 Isotopic distribution pattern for the major ESMS (positive-ion mode) signals of S1 and S2 from acetonitrile precipitation of serum (unspiked) at m/z: (a) +518 (simulated); (b) +518 (experimental); (c) +782 (simulated); and (d) +782 (experimental). The experimental isotopic distribution obtained from high-resolution ESMS.
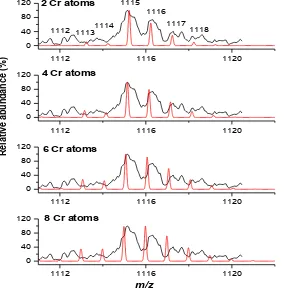
In order to characterize signals in S3, ESMS spectra at the narrow scan range were attempted. The zoom spectrum of S3 (Fig. 4) revealed that the major peaks may contain several Cr atoms. Thus, simulations of isotopic distribution of one of the major peaks (at m/z
+1115) were performed with variation in numbers of Cr atoms, as shown in Fig. 5. The results showed that S3 was likely to be composed of four atoms of Cr, which are bound to low-molecular-weight serum species with bridging ligands. Additionally, it was observed that the Cr complexes were singly charged, as the satellite peaks were approximately 1 unit apart.
517 518 519 520 521 522 523 0
1060 1080 1100 1120 1140 1160 postulated for chromodulin, a purported biologically active form of Cr(III) [26]. However, there are differences between these two biomolecules. From the mass spectrometry, the new Cr-containing biomolecules are likely to be cationic, while chromodulin is anionic [26]. In addition, the molecular masses of the two complexes are significantly different; chromodulin has been reported to have a molecular mass of around 1500 Da [26].
Figure 4 The major signals of ESMS (positive-ion mode) of S3 from acetonitrile precipitation of serum spiked with saturated solutions of A or solutions of B in serum.
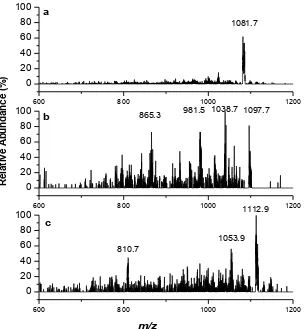
Figure 6. Typical MS/MS signals (positive-ion mode) of signal S3, at m/z: (a) +1083, the optimum collision energy was achieved at 27 eV; (b) +1099, the optimum collision energy was achieved at 30 eV; and (c) +1115, the optimum collision energy was achieved at 30 eV.
Tandem mass spectrometry was performed for peaks of interest for Cr speciation, in order to understand the fragmentation of those particular ions. Therefore, the MS/MS analysis was carried out for ESMS results for S3 signals. However, since the low-molecular-weight components of serum obtained from the acetonitrile extraction method contained a mixture of species, amino acid sequencing efforts were not conducted in this work.
Nevertheless, fragmentation of the Cr-containing species responsible for the peak at
m/z +1084 in signal S3 resulted in only one single peak +1081.7 (Fig. 6a). The differences in the fragment ion and the parent ion could be due to the loss of 2 H atoms during fragmentation. The parent peaks and two distinct fragmentation peaks were obtained from the species with m/z +1099, +1097.7, +1038.7, and +981.5, with a difference of ~60, showing the possibility of fragment loss of (CH3COO), as illustrated in Fig. 6b. Another possibility is the
~60 Da species could be assigned as acetate or a fragment of citrate. In a study of the application of ESI MS/MS for the speciation of alkaloids in biological media, the loss of ~60 (CH3COO) and ~18 (H2O) are the most common fragmentation pathways [27]. However,
the presence of a fragment ion at m/z +865.3 shows that fragmentation still continued. Fragmentation of the species responsible for the m/z +1115 peak resulted in the parent peak and two main fragmentation peaks at m/z +1112.9, +1053.9, and +810.7 (Fig. 6c). The first two peaks differ in m/z by ~60, which showed the same fragmentation pattern as the peak at
400 600 800 1000 0
20 40 60 80
100 858.7
441.1 419.1
714.1
400 600 800 1000
0 20 40 60 80 100
419.1 441.1
858.7
m/z
Re
lati
ve
ab
un
da
nc
e (%
)
714.1 a
b
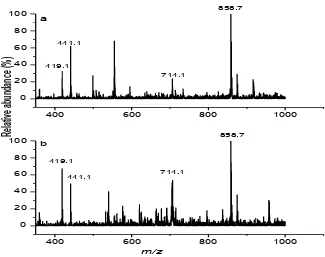
Figure 7 ESMS (positive-ion mode) results for A in buffer solution (0.10 M NH4OAc, pH
7.2) after the acetonitrile treatment for: (a) 1 h; (b) 24 h, at 310 K.
Mass spectrometry analysis were also performed on A or B in aqueous NH4OAc
buffer (0.10 M, pH 7.4), after the mixture was treated with acetonitrile for 1-24 h at 310 K. The ESMS signals obtained from those samples are presented in Figures 7 and 8. The results were in agreement with previous work [24], which used ESMS to study the stability of A and B in aqueous NH4OAc buffer solutions. No major signals corresponding to S3 in Fig. 2 were
detected in the absence of serum supernatants, which confirms that these signals were due to Cr(III)-binding to serum components.
The ESMS data for the solution containing A at the beginning of the reaction (1 h, 310 K) or after further reaction (24 h, 310 K) showed major ions at +419, +441, +714, and +858, m/z, corresponding to [Cr(pic)3]·H+, [Cr(pic)3]·Na+, [Cr(pic)3]·[Cr(pic)2]+, and
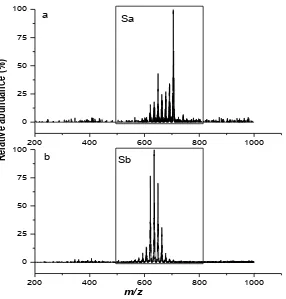
2[Cr(pic)3]·Na+, respectively. The major ESMS signals for B are designated as Sa and Sb,
Figure 8 ESMS (positive-ion mode) results for B in buffer solution (0.10 M NH4OAc, pH
7.2) after the acetonitrile treatment for: (a) 1 h; (b) 24 h, at 310 K.
Table 2 Assignment of the major ESMS signals for B in buffer solution (0.10 M NH4OAc, pH 7.2) reacted with acetonitrile
Signal + m/z Assignment
(prediction)
Sa 705 [Cr3O(L)6(MeOH)3]+
691 [Cr3O(L)6(OH2)(MeOH)2]+
677 [Cr3O(L)6(OH2)2(MeOH)]+
663 [Cr3O(L)6(OH2)3]+
649 [Cr3O(L)5(OH)(MeOH)3]+
Sb 663 [Cr3O(L)6(OH2)3]+
649 [Cr3O(L)5(OH) (MeOH)3]+
635 [Cr3O(L)5(OH)2(MeOH)2]+
621 [Cr3O(L)5(OH2)2(OH)(MeOH)]+
607 [Cr3O(L)4(OH2)2(OH)2(MeOH)]+
200 400 600 800 1000 0
25 50 75 100
m/z
R
elati
ve
ab
un
da
nc
e (
%)
b
Sa
200 400 600 800 1000 0
25 50 75 100
a
CONCLUSION
The formation of common LMW species in the reactions of two different types of Cr(III) complexes (picolinato or propionato) with serum has been detected by mass spectrometry technique. These species are likely to be polynuclear complexes containing four Cr atoms, but they are different from the purported natural Cr(III) compound (chromodulin) by charge (positive rather than negative), and molecular weight (~1100 Da rather than 1500 Da). Further studies are needed on the isolation and chemical characterization of the LMW binding-Cr(III) species.
ACKNOWLEDGMENT
A. S. acknowledges the Australian Development Scholarship from AusAID for funding of her MSc at the University of Sydney.
REFERENCES
[1]. Vincent, J. B., Proceedings Nut. Soc., 2004, 63, 41-47.
[2]. Pu, D., Vincent, J. B., Cassady, C. J., J. Mass Spectrom., 2008, 43, 773-781. [3]. Vincent, J .B., J. Trace Elem. Med. Biol., 2014, 28, 397-405.
[4]. Vincent, J. B., Polyhedron, 2001, 20, 1-26.
[5]. Levina, A., Harris, H. H., Lay, P. A., J. Am. Chem. Soc., 2007, 129, 1065-1075 (Erratum p9832).
[6]. Vincent, J. B., Dalton Trans., 2010, 39, 3787-3794.
[7]. Feng, W., Li, B., Chai, Z., Zhang, P., Gao, Y., Zhao, J., Anal. Bioanal. Chem., 2003, 375, 363-368.
[8]. Crans, D. C., Woll, K. A., Prusinskas, K., Johnson, M. D., Norkus, E., Inorg. Chem, 2013, 52, 12262-12275.
[9]. Haraguchi, H., J. Anal. At. Spectrom., 2004, 19, 5-14.
[10]. Sanz-Medel, A., Montes-Bayón, M., Sánchez, M. L. F., Anal. Bioanal. Chem., 2003, 377, 236-247.
[11]. Sun, Y., Ramirez, J., Woski, S. A., Vincent, J. B., J. Biol. Inorg. Chem., 2000, 5, 129-136.
[12]. Speetjens, J. C., Parand, A., Crowder, M. W., Vincent, J. B., Woski, S. S.,
Polyhedron, 1999, 18, 2617-2624.
[13]. Nguyen, A., Mulyani, I., Levina, A., Lay, P. A., Inorg. Chem., 2008, 47, 4299-4309. [14]. Becker, J.S., Mounicoua, S., Zoriy, M. P., Becker, J. S., Lobinski, R., Talanta, 2008,
76, 1183-1188.
[15]. Yates, J. R., Ruse, C. I., Nakorchevsky, A., Annu. Rev. Biomed. Eng., 2009, 11, 49-79.
[16]. Adkins, J. N., Varnum, S. M., Auberry, K. J., Moore, R. J., Angell, N. H., Smith, R. D., Springer, D. L., Pounds, J. G., Mol. Cell. Proteomics, 2002, 1, 947-955.
[17]. Tirumalai, R.S., Chan, K. C., Prieto, D. A., Issaq, H. J., Conrads, T. P., Veenstra, T. D., Mol. Cell. Proteomics, 2003, 2, 1096-1103.
[18]. Chertov, O., Biragyn, A., Kwak, L. W., Simpson, J. T., Boronina, T., Hoang, V. M., Prieto, D. R. A., Conrads, T. P., Veenstra, T. D., Fisher, R. J., Proteomics, 2004, 4, 3243-3250.
[19]. Merrel, K.,Southwick, K., Graves, S. W., Esplin, M. S., Lewis, N. E., Thulin, C. D.,
J. Biomol. Tech., 2004 , 15, 238-248.
[20]. Nielsen, F. H., J. Trace Elem. Med. Biol., 2014, 31, 226-234.
[22]. Stearns, D. M., Amstrong, W. H., Inorg. Chem., 1992, 31, 5178-5184.
[23]. Antsyshkina, A.S., Porai-Koshits, M. A., Arkhangel'skii, I. V., Diallo, I. N., Russ. J. Inorg. Chem., 1987, 32, 1700-1703.
[24]. Mulyani, I., In Vitro Biological Activities and Chemistry of Cr(III) Dietary Supplements, in Department of Chemistry, 2006, PhD Thesis, The University of Sydney: Sydney, Australia.
[25]. IsoPro 3.0, 1998, Senko, M.:Sunnyvale, CA.
![Figure 1 Structures of Cr(III) complexes used in this work. Designations: A = [Cr(pic)3], B = [Cr3O(O2CEt)6(OH2)3]+](https://thumb-ap.123doks.com/thumbv2/123dok/2862237.1694523/2.595.122.478.540.712/figure-structures-iii-complexes-used-work-designations-cet.webp)