Academic Self-Concept and Academic Achievement: Developmental
Perspectives on Their Causal Ordering
Fre´de´ric Guay
Universite´ LavalHerbert W. Marsh
University of Western Sydney—Bankstown
Michel Boivin
Universite´ LavalThis study tests theoretical and developmental models of the causal ordering between academic self-concept and academic achievement in a multicohort–multioccasion design (i.e., 3 age cohorts, each with 3 measurement waves). Participants were students in Grades 2, 3, and 4 from 10 elementary schools. The structural equation model for the total sample supported a reciprocal-effects model, indicating that achievement has an effect on self-concept (skill-development model) and that academic self-concept has an effect on achievement (self-enhancement model). This pattern was replicated in tests of invariance across the 3 age cohorts and did not support the developmental hypothesis that skill-development and self-enhancement models would vary with age. Discussion centers on the theoretical, methodological, and practical implications of the results.
Over the past decades, academic self-concept has been exten-sively studied in relation to academic achievement (Marsh & Craven, 1997). Although there is support for a reciprocal relation between these variables (Marsh, Byrne, & Yeung, 1999), this relation has not been examined fully from a developmental per-spective, especially with younger children. To test the develop-mental pattern in the causal ordering of these constructs, Marsh et al. (1999) recommended the use of multicohort–multioccasion designs (e.g., Marsh, Craven, & Debus, 1998) that combined the advantages of cross-sectional (multiple-age cohorts) and longitu-dinal (multiple occasions) research within the same study. The purpose of the present investigation was to evaluate developmental hypotheses about the causal ordering of academic self-concept and academic achievement among elementary school children through the use of a multicohort–multioccasion design. In the following section, we present (a) the theoretical models and methodological guidelines, (b) the developmental perspectives, and (c) the features of the present study.
Theoretical Models and Methodological Guidelines
The causal ordering of academic self-concept and academic achievement has been one of the most critical issues in academic self-concept research. Research has contrasted the self-enhancement and skill-development models posited by Calsyn and Kenny (1977). According to the enhancement model, self-concept is a determinant of academic achievement, whereas the skill-development model implies that academic self-concept is a consequence of academic achievement. Historically, research aimed at testing these models has used the magnitude of cross-lagged relations to estimate the causal predominance between these two variables. That is, the sizes of effects of prior achieve-ment on subsequent self-concept (in support of skill-developachieve-ment models) were compared with the sizes of effects of prior concept on subsequent achievement (in support of a self-enhancement model).
In a review and critique of this research, Marsh (1990a, 1990b, 1993; also see Marsh et al., 1999) argued that much of this research was methodologically unsound and inconsistent with the academic self-concept theory. Furthermore, there is substantial evidence that prior academic achievement is one determinant of academic self-concept (Marsh et al., 1999). The critical question is, therefore, whether a causal link also exists from prior academic self-concept to subsequent achievement. The statistical signifi-cance and size of the path coefficient are of critical importance regardless of whether they are larger than the path from prior academic achievement to subsequent academic self-concept. A more realistic compromise between the self-enhancement and skill-development models is a reciprocal-effects model, according to which prior self-concept affects subsequent achievement and prior achievement affects subsequent self-concept. The reciprocal-effects model has major implications for the importance placed on
Fre´de´ric Guay, De´partement des fondements et pratiques en e´ducation, Faculte´ des sciences de l’e´ducation, Universite´ Laval, Sainte-Foy, Que´bec, Canada; Herbert W. Marsh, Faculty of Education, University of Western Sydney—Bankstown, Australia; Michel Boivin, E´cole de psychologie, Universite´ Laval.
We would like to thank Marielle Dion, Lise Coˆte´, and Franc¸ois Poulin for their significant contribution to this research project.
Correspondence concerning this article should be addressed to Fre´de´ric Guay, De´partement des fondements et pratiques en e´ducation, Faculte´ des sciences de l’e´ducation, Universite´ Laval, Sainte-Foy, Que´bec G1K 7P4, Canada. E-mail: [email protected]
academic self-concept as a means of facilitating other desirable outcomes as well as being an important outcome variable.
Marsh et al. (1999) proposed methodological guidelines to es-tablish more clearly the nature of the relation between academic achievement and academic self-concept. These guidelines are based on a structural equation modeling (SEM) statistical ap-proach. First, academic self-concept and academic achievement should be inferred on the basis of multiple indicators, that is, at least three items per factor, although more is preferable. Second, there is a need to control appropriately for method– halo effects associated with the same measures collected on multiple occa-sions. Because the failure to control for these effects produces positively biased estimates of stability, we should always test for correlated uniquenesses between measures assessed on multiple occasions. Third, academic self-concept and academic achieve-ment should be measured at least twice (i.e., a two-wave study) and preferably more frequently. Although more research is needed to establish the optimal interval between measurement points, it is recommended that the data span more than one school year. Fourth, researchers should proceed with a “full-forward” a priori SEM model (see Figure 1) to test rigorously the reciprocal-effects model. This model estimates stability coefficients and cross-lag effects to determine the causal flow among the constructs. The main advantage of this model is that other alternative models are nested under this more general model, thereby offering a point of comparison. Fifth, it is important to consider a sufficiently large
and diverse sample to justify the use of SEM and the generality of the findings.
Previous studies published on this topic have provided good support for the reciprocal-effects model for adolescents, although most of them did not fully satisfy these methodological criteria (for a review of this literature, see Marsh & Yeung, 1997a; Marsh et al., 1999). However, few defensible studies of the reciprocal-effects model have been conducted with early elementary school children (second and third graders). This is unfortunate because, as many researchers and practitioners alike argue, this is a critical time for young children to develop a positive academic self-concept (e.g., Chapman & Tunmer, 1997; Marsh & Craven, 1997).
Developmental Perspectives
Many authors (Chapman & Tunmer, 1997; Eccles, Wigfield, Harold, & Blumenfeld, 1993; Harter, 1999; Marsh, 1989; Marsh & Craven, 1997; Skaalvik & Hagtvet, 1990; Wigfield & Eccles, 1992; Wigfield & Karpathian, 1991; Wigfield et al., 1997) have offered a developmental perspective on the relation between aca-demic self-concept and acaaca-demic achievement. This developmen-tal perspective addresses the correlational and causal aspects of the relation between these constructs.
Marsh (1989, 1990a) proposed that the self-concepts of very young children are very positive and not highly correlated with external indicators (e.g., skills, accomplishments, achievement,
self-concepts inferred by significant others) but that with increas-ing life experience, children learn their relative strengths and weaknesses so that specific self-concept domains become more differentiated and more highly correlated with external indicators. It should be noted, however, that this positive halo effect is normal in young children. As Harter (1999) pointed out, “Self-descriptions typically represent an overestimation of personal abilities. It is important to appreciate, however, that these apparent distortions are normative in that they reflect the cognitive limitations rather than conscious efforts to deceive the listener” (p. 38). In line with this perspective, Marsh et al. (1998) showed that reliability, sta-bility, and factor structure of self-concept scales improve with age (children 5– 8 years of age). In addition, consistent with the pro-posal that children’s self-perceptions become more realistic with age, self-ratings were more correlated with teacher ratings as children grow older.
Wigfield and Karpathian (1991) argued that young children’s understanding of competence changes with age, such that with increasing age, self-concepts of ability were likely to be less positive. In addition, they posited that as children grow in age, their academic self-concept would be more systematically related to external academic outcomes. From this developmental perspec-tive, Wigfield and Karpathian argued that “once ability perceptions are more firmly established the relation likely becomes reciprocal: Students with high perceptions of ability would approach new tasks with confidence, and success on those tasks is likely to bolster their confidence in their ability” (p. 255).
To summarize, the developmental perspective suggests that young children have very positive self-concepts that may appear to be biased in relation to external indicators of self-concept but that these very high self-concepts tend to become less positive and more differentiated as they grow older. In addition, it appears that this developmental pattern may lead to a skill-development effect for younger children, but as children’s self-concept becomes more closely aligned with external indicators, a reciprocal-effects model may be obtained. What are the processes that might account for this developmental trend? In line with Harter’s (1999) view, we suggested that this developmental trend could be explained by three factors: (a) Older children have higher cognitive abilities that improve their coordination between self-representations that were previously considered to be opposite, thus leading to better agree-ment between self-concept ratings and external indicators; (b) these higher cognitive skills lead older children to use social comparison processes, which foster a more balanced view of the self; and (c) older children have internalized evaluative standards of others, which lead to less egocentric evaluations of the self. These three developmental processes lead to greater accuracy among older children, thus making it possible for academic self-concept to predict changes in academic achievement.
Marsh et al. (1999) found reasonably consistent support for the reciprocal-effects model across different studies, suggesting that there may not be well-established development differences in the relative support for the skill-development and self-enhancement models. They emphasized, however, that there was insufficient research with young children to evaluate developmental trends in early school years. We have identified six studies aimed at testing the development of the causal ordering between academic achieve-ment and academic self-concept among eleachieve-mentary school chil-dren. Skaalvik and Hagtvet (1990) tested the developmental
per-spective using two cohorts of students (Grade 3 and Grade 6 at the start of the study) that were evaluated on their academic self-concept and global self-self-concept on two occasions at an interval of 18 months. Achievement was measured using teacher ratings. Results of their study showed that teachers’ ratings were more substantively correlated with academic self-concept than with gen-eral self-concept. In addition, results showed reciprocal effects between achievement and academic self-concept for the older cohort but a skill-development effect for the younger cohort (see also Skaalvik, 1997, for similar results).
Helmke and van Aken (1995) evaluated the relation between achievement in mathematics and mathematics self-concept using a three-wave design (i.e., Grade 2, Grade 3, and Grade 4). In this study, achievement in mathematics was inferred using test scores and school marks. Results from the final and complex model based on two latent constructs of achievement (i.e., test scores and school marks) revealed that only one of the four effects of prior self-concept on subsequent achievement was statistically significant. Hence, Helmke and van Aken concluded, “During elementary school self-concept is mainly a consequence of cumulative achievement-related success and failure and that it does not have a significant impact on later achievement, neither on marks nor on test performance” (p. 635).
Chapman and Tunmer (1997) assessed reading achievement and reading self-concept in elementary students using three waves of data collection (i.e., Grade 1, Grade 2, and Grade 3). Results showed that between Grade 1 and Grade 2, only stability paths were significant (i.e., reading achievement from Grade 1 to Grade 2 and reading self-concept from Grade 1 to Grade 2). All other paths were nonsignificant, suggesting that neither achieve-ment nor self-concept directly affected each other. However, a skill-development effect was observed between Grade 2 and Grade 3, thereby providing some support for the developmental perspective outlined previously.
Skaalvik and Valas (1999) conducted a study with three cohorts of children (i.e., Grades 3, 6, and 8 at the start of the study) who were assessed on two occasions on math and verbal achievement and on self-concept related to these school subjects. Results of this study provided support only for the skill-development model. That is, for each cohort and each school subject, the path connecting Time 1 (T1) achievement was significantly related to Time 2 (T2) academic concept, whereas the path connecting T1 self-concept to T2 achievement was nonsignificant. In contrast to Skaalvik and Hagtvet’s (1990) study, no reciprocal effects were found for the older cohort. This study, however, had some impor-tant limitations. In particular, the conclusions were based on an apparently improper solution, because the parameter estimate in-volving path coefficient leading from prior achievement to subse-quent achievement was set to 1. Because subsesubse-quent achievement was perfectly predicted by prior achievement, it was not surprising that prior academic self-concept did not contribute to changes in academic achievement.
subsequent academic self-concept, Mujis concluded that the results point to a reciprocal relationship.
Taken together, previous developmental studies do not allow any firm conclusion to be drawn about how the causal ordering of self-concept and academic achievement develops. Specifically, opposite results were reported, and few of these studies offer defensible methodological features to test developmental hypoth-eses (i.e., few of them met the methodological criteria proposed by Marsh et al., 1999).
The Present Study
The purpose of the present study was to verify developmental trends between academic self-concept and academic achievement using a sample of elementary school children. The present study has some advantage over previous studies because it meets most of the methodological criteria formulated by Marsh et al. (1999). Thus, we used (a) multiple indicators to assess academic achieve-ment and academic self-concept, (b) a general SEM model that estimated stability coefficients and cross-lag effects to determine the causal flow among the constructs, (c) SEM models with correlated uniquenesses, (d) a sufficiently large and diverse sam-ple, and (e) a multicohort–multioccasion design with three waves of data collected 1 year apart in each of three age cohorts. This multicohort–multioccasion design allows comparisons between cross-sectional results and true longitudinal results in order to test developmental differences in the relations between academic achievement and academic self-concept from Grades 2 to 6.
On the basis of previous developmental research, we formulated four developmental hypotheses: (a) academic self-concept mea-surement error would decrease with age; (b) the stability of self-concept across time would increase with age; (c) the relation between academic achievement and academic self-concept would be stronger with age; and (d) during the early to middle elementary school years, academic achievement would predominate over ac-ademic self-concept, thus supporting the skill-development model, whereas this relation would become reciprocal in late elementary school years or early adolescence. If the data are consistent with Hypothesis 4, then we should observe only skill-development effects between each wave of the two younger cohorts (i.e., Grades 2 and 3 at the start of the study) and the first two waves of Cohort 3 (Grade 4 at the start of the study) but a reciprocal effect for the last two waves of Cohort 3 because children of this cohort are in late elementary school years. However, it is important to emphasize that there is little or no empirical support for Hypoth-esis 4 and that the generality of support for the reciprocal-effects model reported by Marsh et al. (1999) suggests that support for the reciprocal-effects model may not vary with age (although they emphasized that there was too little methodologically sound re-search with young children to draw firm conclusions).
Method
Participants
Participants were three cohorts of 385 French Canadian children (202 girls, 183 boys; mean age⫽108 months, range 88 –157 months) from 10 elementary schools from a variety of socioeconomic environments in Quebec City, Canada. Children in Cohorts 1 (n⫽125), 2 (n⫽147), and 3 (n⫽113) were in Grades 2, 3, and 4, respectively, at the start of the study.
Participation required parental consent, and the parental participation rate was over 98% (only 2% of the parents refused to have their children participate to this study).
Procedure
The study involved three waves of data collection with a 1-year interval between each measurement time. For instance, children of the first cohort were evaluated at the end of Grades 2, 3, and 4 using the Self-Perceptions Profile for Children (Harter, 1985). In addition, teachers completed a questionnaire assessing children’s academic achievement in three areas: writing, reading, and mathematics. Questionnaires were administered in the classroom by two well-trained research assistants.
Measures
Academic self-concept. Children completed the perceived academic competence subscale of the French version of the Self-Perceptions Profile for Children (Boivin, Vitaro, & Gagnon, 1992). This 6-item subscale uses a structured alternative format. Items are scored on a 4-point scale, where a score of 1 indicates a low academic self-concept and a score of 4 reflects a high academic self-concept.
Academic achievement. The measure used to assess academic achieve-ment was a three-item teacher rating scale. Each of the three items was designed to assess academic achievement in reading, writing, and mathe-matics. Teachers rated a child’s academic performance in these three subjects relative to other classmates using the following scale: 1 (far under the mean), 2 (slightly under the mean), 3 (at the mean), 4 (slightly above the mean), and 5 (far above the mean; for a similar methodology, see also Frentz, Greshman, & Elliot, 1991; Hay, Ashman, & van Kraayenoord, 1997; Skaalvik & Hagtvet, 1990). A score of 5 represents the best aca-demic performance, whereas a score of 1 represents the worst level of performance.
Four reasons lead us to use teachers’ ratings of achievement instead of test scores. First, ranking participants within the classroom takes into account social comparison processes that have a potent influence on self-concept development (Marsh, 1984). Second, Frentz et al. (1991) reported correlations ranging from .43 to .72 between teacher ratings of achievement and the Peabody Individual Achievement Test and the Wech-sler Intelligence Test for Children—Revised, thereby providing good sup-port for the validity of teachers’ ratings of achievement. In addition, in the present study, the test–retest correlation of .69 based on responses by different teachers from one year to the next provides very good support for the construct validity of teacher ratings of achievement. Third, as pointed out by Skaalvik and Hagtvet (1990), “Teachers are significant others for most students, thereby providing important clues about academic perfor-mance. The reflected appraisals from the teachers may have a strong impact on the students’ self-concept of ability” (p. 295). Fourth, school-based performance measures are preferred over standardized test scores as the basis for inferring achievement. Particularly for early years in school, school grades are either not formally given or are very idiosyncratic to each teacher.
Statistical Analyses
Goodness of fit. The adequacy of the models tested in the present study was assessed by SEM with the EQS program (Version 5.1; Bentler, 1993). Models were all tested with standardized coefficients obtained from the maximum likelihood method of estimation. To ascertain the model fit, we emphasized the comparative fit index (CFI), the nonnormed fit index (NNFI, also known as the Tucker–Lewis index), and the root-mean-square error of approximation (RMSEA) as well as the chi-square test statistic.
in practice) in which values greater than .90 and .95 are typically taken to reflect acceptable and excellent fits to the data (Schumacker & Lomax, 1996). Browne and Cudeck (1993; also see Joreskog & Sorbom, 1993) suggest that RMSEAs less than .05 are indicative of a “close fit” and that values up to .08 represent reasonable errors of approximation. The CFI contains no penalty for a lack of parsimony so that the addition of new parameters leads to an improved fit that may reflect capitalization on chance, whereas the NNFI and RMSEA contain a penalty for a lack of parsimony. Model comparison is also facilitated by positing a nested ordering of models in which the parameter estimates for a more restrictive model are a proper subset of those in a more general model (for further discussion, see Bentler, 1990). Under appropriate assumptions, the differ-ence in chi-squares between two nested models has a chi-square distribu-tion and so can be tested in reladistribu-tion to statistical significance. In the present investigation, for example, models with invariance constraints are nested under corresponding models without invariance constraints. Whereas nested models, tests of statistical significance, and indices of fit aid in the evaluation of a model, there is ultimately a degree of subjectivity and professional judgment in the selection of a “best” model.
Correlated uniquenesses with longitudinal data. In most applications of confirmatory factor analysis (CFA), a priori models assume that the residual variance (uniqueness plus random error, hereafter referred to as
uniquenesses) associated with each measured variable is independent of residual variances associated with other measured variables. However, in longitudinal studies in which the same items are administered to the same participants on multiple occasions, it is likely that the uniquenesses asso-ciated with the matching measured variables are correlated (hereafter referred to ascorrelated uniquenesses). If there are substantial correlated uniquenesses that are not included in the model, then the estimated corre-lations between the corresponding latent constructs will be positively biased. In the present application, for example, this would result in a positively biased estimate of the test–retest stability coefficient relating responses to the same latent variable on two occasions and, perhaps, would also negatively bias estimates of other constructs leading to that latent variable. For this reason, Marsh and Hau (1996) recommended that for longitudinal data, researchers should always posit a priori models with correlated uniquenesses, although it may also be appropriate to compare these models with corresponding models with no correlated uniquenesses. This complexity is likely to be compounded when, as in the present investigation, comparisons are made between different age cohorts where the size of measurement errors and, perhaps, the correlated uniquenesses are likely to vary with age. Because of these complications, a potentially important contribution of the present investigation is to evaluate age cohort differences in test–retest stability coefficients with latent variable models that incorporate appropriate control for measurement error and test for correlated uniquenesses.
In the present study, a priori models that included these correlated uniquenesses fit the data significantly better than corresponding models that did not and, consistent with expectations, the correlated uniquenesses were mostly positive (although not all were significantly positive, none were significantly negative). Also consistent with expectations, stability (test–retest) correlations and path coefficients relating the same latent construct on different occasions were somewhat positively biased when these correlated uniquenesses were excluded, whereas cross-lagged paths were somewhat negatively biased (i.e., paths leading from prior self-concept to subsequent achievement and from prior achievement to subse-quent self-concept were somewhat smaller). Although these differences were not sufficiently large to be substantively important, they do support the contention by Marsh and Hau (1996) that a priori models should include correlated uniquenesses. On the basis of this recommendation and our preliminary analyses, and in order to facilitate substantive interpreta-tions of the results, we focus our discussion on a priori models with correlated uniquenesses.
Tests of invariance over different age cohorts. To evaluate age-related differences in the structure of self-concept and achievement, we computed separate covariance matrices for each of the three age (year-in-school) cohorts. When there are parallel data from more than one group—the age cohorts in this study—it is possible to test the invariance of the solution by requiring any one, any set, or all parameter estimates to be the same in two or more groups. The minimal condition of factorial invariance is the invariance of the factor loadings. Separate tests were conducted to test the invariance of the factor loadings, factor variances, factor correlations, path coefficients, uniquenesses, and correlated uniquenesses. In the present investigation, we expect that self-concept factor loadings would be invari-ant over age, whereas measurement error would decline with age and stability would increase with age. For purposes of evaluating development differences in support of the skill development and enhancement models, the critical tests of invariance were for path coefficients leading from prior academic self-concept to subsequent achievement and from prior achieve-ment to subsequent self-concept.
Results
This section consists of three sets of analyses. In the first set, we conducted reliability and correlational analyses. In the second set, we performed CFA and SEM analyses on the total sample to verify the appropriateness of the full-forward model. In the third set, we tested developmental trends over cohorts with a CFA solution for each age cohort and a set of analyses of invariance. These analyses tested the four developmental hypotheses outlined in the introduction.
Internal Consistency, Stability, and Cross-Lagged
Correlations
We begin with a preliminary overview of the psychometric properties of our measures and an evaluation of developmental trends evidenced in the multicohort (cross-sectional) and multioc-casion (longitudinal) comparisons. For the total sample and the three cohorts, internal consistency values for academic self-concept and academic achievement measures were found to be satisfactory across the three waves of data collection (Table 1). Consistent with Hypothesis 1, there were age-related differences in the reliability of self-concept responses that were reflected in both the multicohort and the multioccasion comparisons. Thus, for example, the mean reliabilities for the total sample are .79, .83, and .84 for T1, T2, and Time 3 (T3), respectively, and .80, .81, and .84 for Cohorts 1, 2, and 3, respectively. Consistent with Hypothesis 2, there were age-related differences in the stability of academic self-concept (see Table 1). For example, in Cohort 1, the correla-tion was .35 between T1 and T2 academic self-concept, but it was .61 between T2 and T3. A similar pattern is also observed between cohorts in that the mean stability coefficient for academic self-concept is .43, .61, and .65 for Cohorts 1, 2, and 3 respectively. Also consistent with Hypothesis 3, the correlations between aca-demic achievement and acaaca-demic self-concept increased with age (see Table 2). This general pattern is evident for correlations based on measures of self-concept and achievement collected on the same occasion (boldface correlations) and for some cross-lagged correlations (underlined correlations), especially in Cohort 1.
(multicohort) and longitudinal (multioccasion) comparisons. This set of results thus provided some support for Hypotheses 1, 2, and 3. There is, however, need to interpret carefully the apparent developmental trends based on correlations involving self-concept scale scores because these differences are confounded with age-related differences in reliability and are not based on formal tests of statistical significance. For this reason, we now examine con-firmatory factor analysis models that control for such differences in measurement error and provide tests of statistical significance.
Total Sample Analyses
CFA. To provide an overview of the results, we began with a CFA based on the total sample. Results are presented in Table 3.
We fit an a priori model with correlated uniquenesses between all matching measures collected at T1, T2, and T3. The fit of Model 1 was good (NNFI⫽.979, CFI⫽. 983, RMSEA⫽.032), the factor solution was fully proper, and the factors were well defined (e.g., all factor loadings are substantial; see Total group models in the Appendix).
The sizes of correlations among the latent constructs were systematically higher than the corresponding correlations among scale scores (see Table 2 and the Appendix). This demonstrates the importance of controlling for measurement error. However, the patterns of relations for stability correlations and the cross-lagged and cross-sectional correlations were similar to those reported for correlations among scale scores.
Table 1
Cronbach’s Alpha and Stability Coefficients for Each Cohort and the Total Sample
Analysis
Academic self-concept Academic achievement
T (N⫽385)
C1 (N⫽125)
C2 (N⫽147)
C3 (N⫽113)
T (N⫽385)
C1 (N⫽125)
C2 (N⫽147)
C3 (N⫽113) Reliabilities
T1 .79 .80 .75 .83 .93 .93 .91 .96
T2 .83 .77 .84 .85 .93 .91 .95 .92
T3 .84 .83 .83 .85 .92 .91 .93 .89
Mean␣ .82 .80 .81 .84 .93 .92 .93 .93
Stabilities based on scale scores
r(T1/T2) .50 .35 .52 .64 .68 .71 .72 .63
r(T1/T3) .51 .32 .62 .61 .67 .61 .72 .70
r(T2/T3) .67 .61 .70 .71 .72 .75 .70 .71
Meanrs .56 .43 .61 .65 .69 .69 .71 .68
Stabilities based on latent variables
r(T1/T2) .57 .38 .55 .68 .71 .76 .74 .65
r(T1/T3) .61 .40 .71 .70 .70 .63 .73 .75
r(T2/T3) .76 .71 .77 .79 .75 .81 .73 .73
Meanrs .65 .50 .68 .72 .72 .73 .73 .71
Note. T⫽total sample; C1⫽Cohort 1 (Grades 2– 4); C2⫽Cohort 2 (Grades 3–5); C3⫽Cohort 3 (Grades 4 – 6); T1⫽Time 1; T2⫽Time 2; T3⫽
Time 3.
Table 2
Correlations Between Academic Self-Concept and Academic Achievement for Each Cohort and the Total Sample
Variable
Cohort 1 Cohort 2 Cohort 3 Total sample ACH1 ACH2 ACH3 ACH1 ACH2 ACH3 ACH1 ACH2 ACH3 ACH1 ACH2 ACH3 Scale score
ASC1 .22 .26 .21 .48 .46 .51 .55 .56 .54 .43 .43 .42 ASC2 .31 .40 .32 .38 .40 .49 .55 .51 .53 .41 .43 .45 ASC3 .34 .43 .44 .45 .40 .57 .53 .55 .65 .43 .44 .55 Latent variable
ASC1 .31 .30 .26 .49 .54 .53 .57 .59 .57 .50 .50 .48 ASC2 .37 .45 .35 .42 .46 .56 .61 .58 .61 .47 .49 .52 ASC3 .38 .50 .47 .46 .43 .59 .57 .59 .73 .47 .49 .61
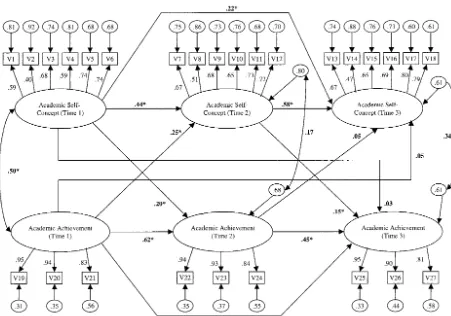
SEM. As recommended by Marsh et al. (1999), we began with a full-forward SEM in which correlations among factors within the same wave, as well as all paths from all constructs in each wave to all constructs in subsequent waves, are freely estimated (see Figure 1). This full-forward SEM is equivalent to the corresponding CFA model (Model 1) in that the goodness of fit and degrees of freedom are the same, the factor loadings and uniquenesses are the same, and the remaining parameters (factor covariances in the CFA model; path coefficients, factor covariances, and residual factor covariances in the SEM model) are merely reparameterizations of each other. The fit of this full-forward model is good and the same as the equivalent CFA model (see Table 3).
The critical parameters for evaluating theoretical models of the causal ordering of self-concept and achievement are the path coefficients leading from T1 to T2 constructs and from T2 to T3 constructs (Figure 1). All paths leading from prior self-concept to
subsequent achievement are statistically significant (.20 for the path leading from T1 academic self-concept to T2 academic achievement, .15 for the path leading from T2 academic self-concept to T3 academic achievement). Whereas the path leading from T1 academic achievement to T2 academic self-concept is significant (.25; Figure 1), the path from T2 academic achievement to T3 academic self-concept (.05) is not significant. Hence, these results supported a reciprocal-effects model for the first two waves of data collection and a self-enhancement effect between the second and the third waves. This interpretation of reciprocal ef-fects is based merely on the finding that the paths from prior self-concept to subsequent achievement and from prior achieve-ment to subsequent self-concept are statistically significant and not on the magnitude of those paths. It should be noted that results based on the total sample provided no support for our Hypothesis 4 because reciprocal effects were obtained between the first two Table 3
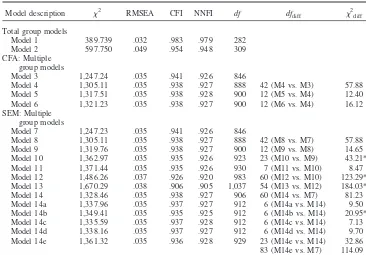
Fit Indices for Analyses of Invariance Across the Three Cohorts
Model description 2 RMSEA CFI NNFI df dfdiff
2 diff
Total group models
Model 1 389.739 .032 .983 .979 282 Model 2 597.750 .049 .954 .948 309 CFA: Multiple
group models
Model 3 1,247.24 .035 .941 .926 846
Model 4 1,305.11 .035 .938 .927 888 42 (M4 vs. M3) 57.88 Model 5 1,317.51 .035 .938 .928 900 12 (M5 vs. M4) 12.40 Model 6 1,321.23 .035 .938 .927 900 12 (M6 vs. M4) 16.12 SEM: Multiple
group models
Model 7 1,247.23 .035 .941 .926 846
Model 8 1,305.11 .035 .938 .927 888 42 (M8 vs. M7) 57.88 Model 9 1,319.76 .035 .938 .927 900 12 (M9 vs. M8) 14.65 Model 10 1,362.97 .035 .935 .926 923 23 (M10 vs. M9) 43.21* Model 11 1,371.44 .035 .935 .926 930 7 (M11 vs. M10) 8.47 Model 12 1,486.26 .037 .926 .920 983 60 (M12 vs. M10) 123.29* Model 13 1,670.29 .038 .906 .905 1,037 54 (M13 vs. M12) 184.03* Model 14 1,328.46 .035 .938 .927 906 60 (M14 vs. M7) 81.23 Model 14a 1,337.96 .035 .937 .927 912 6 (M14a vs. M14) 9.50 Model 14b 1,349.41 .035 .935 .925 912 6 (M14b vs. M14) 20.95* Model 14c 1,335.59 .035 .937 .928 912 6 (M14c vs. M14) 7.13 Model 14d 1,338.16 .035 .937 .927 912 6 (M14d vs. M14) 9.70 Model 14e 1,361.32 .035 .936 .928 929 23 (M14e vs. M14) 32.86 83 (M14e vs. M7) 114.09
Note. For tests of invariance, each model is tested against another model that is nested under it (e.g., M4 vs. M3 is a comparison between M4 and M3). Tests of statistical significance are based on the2diffin relation to
the dfdiff. RMSEA ⫽ root-mean-square error of approximation; CFI ⫽ comparative fit index; NNFI ⫽
nonnormed fit index; CFA⫽confirmatory factor analysis; SEM⫽structural equation modeling; Model (M) 1⫽
a priori model with correlated uniquenesses associated with the same measured variables from different occasions; Model 2⫽Model 1 with no correlated uniquenesses; Model 3⫽all free; Model 4⫽factor loadings across cohorts were invariant; Model 5⫽between-cohort constraints were invariant; Model 6⫽within-cohort constraints were invariant; Model 7⫽no invariance constraints were imposed; Model 8⫽factor loadings were invariant; Model 9⫽factor loadings and variances were invariant; Model 10⫽factor loadings, variances, and path coefficients were invariant; Model 11⫽factor loadings, variances, path coefficients, and factor covariances were invariant; Model 12⫽factor loadings, variances, path coefficients, factor covariances, and correlated uniquenesses were invariant; Model 13⫽all parameters were invariant; Model 14⫽factor loadings, factor variances, and covariances were invariant; Model 14a⫽Model 14 with paths connecting academic self-concept across the three measurement times were invariant; Model 14b⫽Model 14 with paths connecting academic achievement across the three measurement times were invariant; Model 14c⫽Model 14 with paths leading academic self-concept to academic achievement were invariant; Model 14d⫽Model 14 with paths leading academic achievement to academic self-concept were invariant; Model 14e⫽Model 14 with selected paths were invariant.
waves of data collection (i.e., for younger children). However, it is possible that the present pattern of results would be different for each cohort. In the next section, we test this possibility.
Multiple Group Analyses: Comparisons Across
Multiple-Age Cohorts
We begin with a brief evaluation of CFA solutions for each cohort (see Tables 1 and 2 and the Appendix), with particular emphasis on the developmental trends in the sizes of correlations. Although the sizes of correlations are systematically larger be-cause of the correction in measurement error, the pattern of results is similar to those observed with scale scores. Hence, self-concept stability coefficients increased with age, as shown by comparisons based on both multicohort and multioccasion correlations (see Table 1). Similarly, correlations between academic self-concept and academic achievement (Table 2) increased with age, as in-ferred from both multicohort and multioccasion comparisons. In contrast to these developmental trends for academic self-concept responses by students, the achievement stability coefficients based on teacher responses did not show age-related trends for either multicohort or multioccasion comparisons. In summary, these de-velopmental patterns in the stability of self-concept and in its relation to achievement support earlier conclusions based on scale scores, thereby providing some support for Hypotheses 2 and 3. However, it is important to interpret these developmental differ-ences carefully because they are not based on any formal tests of statistical significance. For this reason, we conducted CFA invari-ance analyses to test formally these differences.
Following Marsh et al. (1998), we evaluated the invariance of three sets of parameters: (a) factor loadings across cohorts, (b) academic self-concept (ASC) stabilities (i.e., three key correla-tions: ASC1–ASC2, ASC1–ASC3, ASC2–ASC3) within and be-tween cohorts, and (c) academic self-concept–academic achieve-ment (ACH) relations (i.e., three key correlations: ASC1–ACH1, ASC2–ACH2, ASC3–ACH3) within and between cohorts. Fit indices for these analyses are presented in Table 3. The minimum condition of factorial invariance is the invariance of factor load-ings. In Model 3, no parameters were constrained to be equal across and within cohorts. In Model 4, factor loadings were con-strained to be invariant across cohort, and the fit of this model did not differ significantly from that of Model 3 (i.e., the chi-square difference test was nonsignificant). In Model 5, factor loadings and the six key correlations (i.e., ASC1–ASC2, ASC1–ASC3, ASC2– ASC3, ASC1–ACH1, ASC2–ACH2, ASC3–ACH3) were con-strained to be equal across cohorts. The fit of this model was not significantly different from Model 4, thereby indicating no signif-icant differences across cohorts. In Model 6, factor loadings and the six key correlations were constrained to equality within each cohort. The fit of this model was not significantly different from Model 4, thereby indicating no significant developmental trends within each cohort. Taken together, these formal tests indicate that the developmental effects observed in previous analyses were not sufficiently strong to be statistically significant in invariance anal-yses, thereby providing no support for Hypotheses 2 and 3. This absence of significant effects could be explained by the low number of participants involved in each cohort.
In the next set of analyses, we evaluated invariance of path coefficients used to test developmental trends in support of the
skill development and enhancement models of academic self-concept–academic achievement relations. In the least restrictive model, no parameters were constrained to be equal across cohorts, and this model provided a good fit to the data (see Model 7 in Table 3). In Model 8, the factor loadings were constrained to be invariant across cohorts, and the fit of this model did not differ significantly from that of Model 7 (i.e., the chi-square difference test was nonsignificant). Hence, the factor loadings did not differ significantly across the three age cohorts. In Model 9, factor loadings and factor variances were constrained to be invariant. Model 9 was not statistically different from Model 8, indicating that those parameters did not differ significantly across age co-horts. In Model 10, factor loadings, factor variances, and path coefficients were constrained to be invariant. The fit of Model 10 was significantly poorer than Model 9, according to the chi-square difference test, although the fit indices were nearly identical. This led us to conclude that the path coefficients were not equivalent across the three cohorts. In Model 11, factor loadings, factor variances, path coefficients, and factor covariances were invariant, and this model did not differ significantly from Model 10. In Model 12, factor loadings, factor variances, path coefficients, factor covariances, and correlated uniquenesses were invariant. This model resulted in a significantly worse fit to the data than Model 10, indicating that the correlated uniquenesses were not invariant. In Model 13, all parameters were constrained to be equal over cohorts (i.e., uniquenesses were invariant). This model of-fered a worse fit to the data than Model 12, indicating that the uniquenesses were not invariant (which is consistent with the finding that measurement error is smaller for older students).
On the basis of results obtained under Models 7–13, we con-cluded that path coefficients, correlated uniquenesses, and unique-ness were not completely invariant across the three cohorts. Con-sequently, we specified Model 14 in which these constraints were relaxed. This model offered a good fit to the data (see Table 3) in that the chi-square was not significantly different from Model 7 and the fit indices were as good or better for Model 14 than for any of the other models. On this basis, we selected Model 14 as the best model from Models 7–13 and based further analyses on it.
In Model 14, no path coefficients were constrained to be invari-ant across the three age cohorts. This does not mean, of course, that all path coefficients were significantly different. Thus, for exam-ple, the reasonable fit of Model 10 in which all path coefficients were constrained to be equal suggests that many of the path coefficients may be similar across cohorts. Because these path coefficients are so important in the present investigation, we pur-sued a series of models to determine which of the path coefficients did differ across the three cohorts. In particular, we evaluated a series of submodels of Model 14 in which the invariance of selected path coefficients was tested.
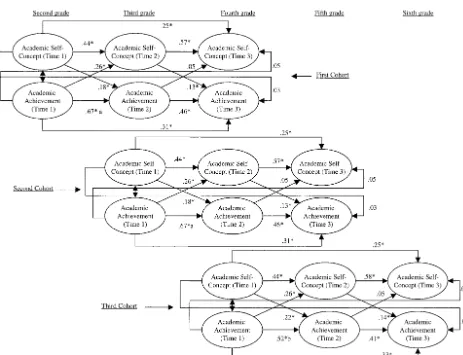
equivalent between the first and the third cohort, whereas this path was equivalent between the first and the second cohort. In Model 14c, cross-lagged paths connecting academic achievement to aca-demic self-concept were invariant. This model offered a good fit to the data that was not significantly different from Model 14. In Model 14d, cross-lagged paths connecting academic self-concept to academic achievement were invariant. This model offered a good fit to the data that was not significantly different from Model 14. Finally, in Model 14e, all paths were invariant except the one that had been found to be statistically different in Model 14b. This model offered a fairly good fit and was not significantly different from Model 14 or from Model 7 (no invari-ance). Results of Model 14e are depicted in Figure 2 (only paths are depicted). Despite the fact that one path was noninvariant, results were similar to those obtained with the overall sample. That is, reciprocal effects were obtained in the first two waves of data collection, whereas a self-enhancement effect was obtained be-tween the second and the third waves for each cohort.
Supplementary Analyses
The systematic results across the cohorts are intriguing. That is, how could we have observed reciprocal effects for the first two
waves and only self-enhancement effects for the second and third waves for the total sample and for each cohort? We believe that these results may be explained by the multiple-wave design used in the present study. Specifically, we suspect that the multiple-wave design is likely to result in smaller effects, and consequently support for either part of the reciprocal-effects model will be harder to show in subsequent waves. To test this idea, we per-formed two supplementary analyses in which we used only two waves of data instead of three. In the first analysis, we tested the reciprocal-effects model on the total sample using only T2 and T3 waves. Results indicated fairly good support for the reciprocal effects-model. Specifically, the path connecting T2 academic achievement to T3 academic self-concept was significant (.16) as well as the path connecting T2 academic self-concept to T3 aca-demic achievement (.19). In the second analysis, we tested the reciprocal-effects model on the total sample using only T1 and T3 waves. Again, results showed fairly good support for the reciprocal-effects model. In particular, the path connecting T1 academic achievement to T3 academic self-concept was signifi-cant (.23) as well as the one connecting T1 academic self-concept to T3 academic achievement (.18). In sum, although SEM analyses involving the three waves of data supported a self-enhancement
effect between Waves 2 and 3, these supplementary analyses provided good support for a reciprocal effect between Wave 2 and Wave 3 and between Wave 1 and Wave 3. The invariance of these results were not performed across cohorts. That is, the invariance of the full-forward model is equivalent to a test of the invariance of the factor correlations. Given the fact that the factor correlations are invariant, then the paths must also be invariant. Thus, we conclude from these set of results that the best fitting model is the reciprocal-effects model across the three waves of data collection and across cohorts.
Discussion
The purpose of the present study was to evaluate the develop-mental trends between academic self-concept and academic achievement with a sample of elementary school children. Specif-ically, we tested four developmental hypotheses: (a) Academic self-concept measurement error would decrease as children grow older; (b) as children grow older, the stability of self-concept across time would increase; (c) as children grow older, the relation between academic achievement and academic self-concept would be stronger; and (d) during the early to middle elementary school years, academic achievement would predominate over academic self-concept, thus supporting the skill-development model, whereas this relation would become reciprocal in late elementary school years.
Results from correlational analysis and CFA showed that, as children grow older, their academic self-concept responses became more reliable (Hypothesis 1), more stable (Hypothesis 2), and more strongly correlated with academic achievement (Hypothesis 3). Furthermore, support for these age-related differences was evident for both multicohort (cross-sectional) and multioccasion (longitudinal) comparisons in our multicohort–multioccasion de-sign. However, it is important to keep in mind that results from invariance analyses provided a different picture. That is, these formal tests indicated that the developmental effects observed within and between cohorts were not sufficiently strong to be statistically significant. However, this absence of significant ef-fects could be explained by the low number of participants in-volved in each cohort (i.e., Cohort 1⫽ 125, Cohort 2 ⫽ 147, Cohort 3⫽113). Taken together, these results provided no support for Hypotheses 2 and 3. Nevertheless, results of SEM multigroup analyses provided support for Hypothesis 1.
Although previous research (e.g., Skaalvik, 1997; Skaalvik & Hagtvet, 1990) suggested evidence in favor of the skill-development model for young children and support for the self-enhancement model or the reciprocal-effects model for older chil-dren, there was no support for this developmental pattern for the children considered in the present investigation. More precisely, the present results supported the reciprocal-effects model for the first two waves of data collection for all three age cohorts. For the second and third waves, however, the results supported the self-enhancement model for all three age cohorts. Even stronger sup-port for the replicability of this pattern of results was evident for the tests of invariance because the pattern of these results did not differ significantly across the three cohorts.1Nevertheless,
supple-mentary analyses indicate that these systematic results across the cohorts may be explained by the multiple-wave design used in the present study. That is, when results are based on only T2 and T3
waves or T1 and T3 waves, they indicated fairly good support for the reciprocal-effects model. In sum, it appears that there is no developmental pattern in the causal ordering of these constructs in our study and that the best fitting model is the reciprocal-effects model for all waves, thereby providing no support for Hypothe-sis 4. In contrast to HypotheHypothe-sis 4, the results of the present investigation support the contention by Marsh et al. (1999) that support for the reciprocal-effects model has good generalizability. Because the present investigation is, perhaps, the methodologically strongest study of the causal ordering of academic self-concept differences for young children, it provides important new support for the reciprocal-effects model. In particular, it substantially ex-tends the Marsh et al. (1999) conclusion about the generalizability of the reciprocal-effects model.
Our results in support of the generalizability of the reciprocal-effects model over age in early school years differ from limited research in this area. This difference may reflect the fact that previous research has met few of the methodological criteria proposed by Marsh et al. (1999). However, other factors may explain these differences. For instance, results of Skaalvik and Hagtvet (1990) are based on a different grading system. Indeed, in contrast to the present sample of children who were exposed to grades as early as Grade 1, Skaalvik and Hagtvet’s study was conducted in Norway where grades are not used before Grade 7. Consequently, participants in the present investigation may have developed relatively more stable self-concepts at younger ages than the Norwegian students, thus leading to reciprocal effects among young children in this study. In addition, it is possible that the developmental trends in support of the skill-development, self-enhancement, and reciprocal-effects models are evident for younger ages than we considered (e.g., at the very start of school in Grade 1 or, even, kindergarten). Future studies are therefore needed on this issue.
The present investigation has some important methodological implications for developmental studies of the causal ordering of academic self-concept and achievement. First, results provided support for the use of a multicohort–multioccasion design. With such a design we were able to assess developmental trends based on multicohort (cross-sectional) and multioccasion (longitudinal) comparisons. It is important to note that the use of a multicohort– multioccasion design made it possible to carry out a stringent test of the developmental hypotheses. Second, the fact that we mea-sured academic performance and academic self-concept with mul-tiple indicators allowed us to verify the importance of including correlated uniquenesses among academic performance indicators
1It should be noted that path coefficients of the self-enhancement effect
(Marsh et al., 1999), which is not possible when either academic achievement or academic self-concept is assessed only using a single score. Results indicated that the models without correlated uniquenesses did not fit the data as well and resulted in somewhat biased parameter estimates. However, it is important to emphasize that the inclusion of correlated uniqueness had only small effects on the sizes of the path coefficients. For example, although the exclusion of the correlated uniquenesses for the multiple indicators of achievement led to somewhat positively biased estimates of the stability of achievement, these differences were not large enough to be substantively important in the present investigation. Potential problems associated with correlated uniquenesses are likely to be larger, however, in studies where results are based on scores of the same standardized achievement test administered to students on different occasions or on teacher assessments of achievement made by the same teacher on different occasions. Hence, even though the inclusion of correlated uniquenesses did not substan-tially alter the pattern of results in the present investigation, the results do support Marsh et al.’s (1999) recommendation that researchers should test a priori models with correlated unique-nesses associated with the same variable administered on different occasions.
Although the present investigation supports the reciprocal-effects model, several limitations should be taken into consider-ation when interpreting these findings. First, we did not focus on the processes that could intervene in the academic self-concept– academic performance relationship. For instance, Guay and Val-lerand (1997) showed that self-determined academic motivation (i.e., acting out of pleasure and choice) mediated the effect of academic self-concept on changes in academic performance. Thus, students who feel competent are more motivated to pursue school activities out of choice and pleasure. Their motivation, in turn, produces an increase in their academic performance. Similarly, Marsh and Yeung (1997b) found that the effects of prior self-concept were mediated in part by academic choice behavior. In particular, high academic self-concepts in particular school sub-jects—more strongly than academic achievement—led students to take more courses in the school subject, which subsequently led to better academic achievement. Clearly, further research is needed to understand the psychological processes and classroom practices that mediate or moderate the academic self-concept–academic performance relation. Second, we did not assess academic self-concept in multiple school subjects. Such an evaluation is impor-tant to demonstrate processes underlying the formation of aca-demic self-concept in different domains and their relation to academic achievement and other constructs. For instance, if a student has a good math self-concept and poor self-concepts in all other school subjects, then this student is more likely to pursue mathematics than if this student has a good math self-concept and even better self-concepts in other school subjects (Marsh & Yeung, 1997b). In addition, the use of a general academic self-concept measure is somewhat problematic, given the trend in the field to use specific measures of these variables. Third, the age range of the present study was not large enough to make a full test of developmental issues (i.e., Grades 2 to 6). Further studies are thus needed on this issue.
It is important to emphasize that the present results have im-portant practical implications. The fact that the reciprocal-effects model was supported for very young children (i.e., Grade 2)
provided support for early interventions based on academic self-concept and achievement and not only on achievement, as sug-gested by the results of a number of previous studies (e.g., Chap-man & Tunmer, 1997; Helmke and van Aken, 1995; Skaalvik, 1997; Skaalvik & Hagtvet, 1990; Skaalvik & Valas, 1999). Spe-cifically, results of previous developmental studies suggest that, for young children, skill-development effects predominate. Ac-cording to these results, teachers should primarily improve dents’ academic achievement without necessarily fostering stu-dents’ self-beliefs in their academic capabilities. However, the present results suggest that with young children, teachers should strive to improve simultaneously both academic self-concept and achievement in order to produce positive changes in both constructs.
In conclusion, we began by arguing that the critical question in self-concept research is whether there exists a causal link from prior academic self-concept to subsequent achievement. Although there is increasing evidence in support of this effect for older students in middle and high schools, there is a very limited body of strong research and no consistent pattern of results for young students in the early primary school years. This is indeed unfor-tunate because, as many researchers and practitioners alike argue, this is a critical time for young children to develop positive self-concepts of themselves as students (e.g., Chapman & Tunmer, 1997; Marsh & Craven, 1997). In contrast to all previous research, we offer a methodologically strong study that provides clear sup-port for this link that is consistent across comparisons based on different age cohorts of young students and different waves within each cohort. In summary, the results of our study provide stronger support for the generality over preadolescent ages of this important link between prior self-concept and subsequent achievement.
References
Bentler, P. M. (1990). Comparative fit indices in structural models. Psy-chological Bulletin, 107,238 –246.
Bentler, P. M. (1993).EQS: Structural equation program manual. Los Angeles: BioMedical Package Statistical Software.
Boivin, M., Vitaro, F., & Gagnon, C. (1992). A reassessment of the self-perception profile for children: Factor structure, reliability, and convergent validity of a French version among second through six grade children.International Journal of Behavioral Development, 15, 275– 290.
Browne, M. W., & Cudeck, R. (1993). Alternative ways of assessing model fit. In K. Bollen & R. Stine (Eds.),Testing structural equation models
(pp. 136 –162). Newbury Park, CA: Sage.
Calsyn, R., & Kenny, D. (1977). Self-concept of ability and perceived evaluations by others: Cause or effect of academic achievement? Jour-nal of EducatioJour-nal Psychology, 69,136 –145.
Chapman, J. W., & Tunmer, W. E. (1997). A longitudinal study of beginning reading achievement and reading self-concept.British Jour-nal of EducatioJour-nal Psychology, 67,279 –291.
Eccles, J. S., Wigfield, A., Harold, R. D., & Blumenfeld, P. (1993). Age and gender differences in children’s self- and task perceptions during elementary school.Child Development, 64,830 – 847.
Frentz, C., Greshman, F. M., & Elliot, S. N. (1991). Popular, controversial, neglected, and rejected adolescents: Contrasts of social competence and achievement difference.Journal of School Psychology, 29,109 –120. Guay, F., & Vallerand, R. J. (1997). Social context, students’ motivation,
Harter, S. (1985). Manual for the self-perception profile for children.
Denver, CO: University of Denver.
Harter, S. (1999).The construction of the self: A developmental perspec-tive.New York: Guilford Press.
Hay, I., Ashman, A., & van Kraayenoord, C. E. (1997). Investigating the influence of achievement on self-concept using an intra-class design and a comparison of the PASS and SDQ-I self-concept tests.British Journal of Educational Psychology, 67,311–321.
Helmke, K. G., & van Aken, M. A. G. (1995). The causal ordering of academic achievement and self-concept of ability during elementary school: A longitudinal study.Journal of Educational Psychology, 87,
624 – 637.
Joreskog, K. G., & Sorbom, D. (1993).LISREL 8: Structural equation modeling with the SIMPLIS command language[Computer software].
Chicago: Scientific Software International.
Marsh, H. W. (1984). Self-concept, social comparison, and ability group-ing: A reply to Kulik and Kulik.American Educational Research Jour-nal, 4,799 – 806.
Marsh, H. W. (1989). Age and sex effects in multiple dimensions of self-concept: Preadolescence to early adulthood.Journal of Educational Psychology, 81,417– 430.
Marsh, H. W. (1990a). The causal ordering of academic self-concept and academic achievement: A multiwave, longitudinal panel analysis. Jour-nal of EducatioJour-nal Psychology, 82,646 – 656.
Marsh, H. W. (1990b). A multidimensional, hierarchical self-concept: Theoretical and empirical justification. Educational Psychology Re-view, 2,77–172.
Marsh, H. W. (1993). Academic self-concept: Theory measurement and research. In J. Suls (Ed.),Psychological perspectives on the self(Vol. 4, pp. 59 –98). Hillsdale, NJ: Erlbaum.
Marsh, H. W., Byrne, B. M., & Yeung, A. S. (1999). Causal ordering of academic self-concept and achievement: Reanalysis of a pioneering study and revised recommendations. Educational Psychologist, 34,
154 –157.
Marsh, H. W., & Craven, R. (1997). Academic self-concept: Beyond the dustbowl. In G. Phye (Ed.),Handbook of classroom assessment: Learn-ing, achievement, and adjustment(pp. 131–198). Orlando, FL: Aca-demic Press.
Marsh, H. W., Craven, R. G., & Debus, R. (1998). Structure, stability, and development of young children’s self-concepts: A multicohort– multioccasion study.Child Development, 69,1030 –1053.
Marsh, H. W., & Hau, K.-T. (1996). Assessing goodness of fit: Is parsi-mony always desirable?Journal of Experimental Education, 64,364 – 390.
Marsh, H. W., & Yeung, A. S. (1997a). Causal effects of academic self-concept on academic achievement: Structural equation models of longitudinal data.Journal of Educational Psychology, 89,41–54. Marsh, H. W., & Yeung, A. S. (1997b). Coursework selection: The effects
of academic self-concept and achievement.American Educational Re-search Journal, 34,691–720.
Muijs, R. D. (1997). Predictors of academic achievement and academic self-concept: A longitudinal perspective.British Journal of Educational Psychology, 67,263–277.
Schumacker, R. E., & Lomax, R. G. (1996).A beginner’s guide to struc-tural equation modeling.Mahwah, NJ: Erlbaum.
Skaalvik, E. M. (1997). Issues in research on self-concept. In M. L. Maehr & P. R. Pintrich (Eds.), Advances in motivation and achievement
(Vol. 10, pp. 51–98). Greenwich, CT: JAI Press.
Skaalvik, E. M., & Hagtvet, K. A. (1990). Academic achievement and self-concept: An analysis of causal predominance in a developmental perspective.Journal of Personality and Social Psychology, 58,292– 307.
Skaalvik, E. M., & Valas, H. (1999). Relations among achievement, self-concept, and motivation in mathematics and language arts: A lon-gitudinal study.The Journal of Experimental Education, 67,135–149. Wigfield, A., & Eccles, J. S. (1992). The development of achievement task
values: A theoretical analysis.Developmental Review, 12,265–310. Wigfield, A., Eccles, J. S., Yoon, K. S., Harold, R. D., Arbreton, A.,
Freedman-Doan, K., & Blumenfeld, P. C. (1997). Change in children’s competence beliefs and subjective task values across the elementary school years: A three-year study. Journal of Educational Psychol-ogy, 89,451–569.
Wigfield, A., & Karpathian, M. (1991). Who am I and what can I do? Children’s self-concepts and motivation in achievement solutions. Ed-ucational Psychologist, 26,233–261.
Received February 8, 2001 Revision received February 20, 2002
Accepted February 20, 2002 䡲
Appendix
Confirmatory Factor Analyses: Factors Loadings, Uniquenesses, and Stability
Coefficients for Each Cohort and the Total Sample
Indicators and uniquenesses
Total sample (N⫽385)
Cohort 1 (N⫽125)
Cohort 2 (N⫽147)
Cohort 3 (N⫽113)
T1 T2 T3 T1 T2 T3 T1 T2 T3 T1 T2 T3
Factor loading
ASC1 .59 .67 .67 .52 .58 .60 .54 .72 .68 .70 .71 .79 ASC2 .40 .51 .47 .48 .47 .45 .35 .49 .35 .43 .58 .63 ASC3 .68 .68 .65 .71 .61 .74 .79 .75 .68 .54 .66 .56 ASC4 .59 .65 .69 .61 .62 .65 .51 .67 .69 .69 .65 .70 ASC5 .74 .73 .80 .79 .68 .75 .67 .73 .85 .80 .78 .78 ASC6 .74 .72 .79 .71 .70 .84 .64 .73 .78 .85 .76 .78 ACH1 .95 .94 .95 .95 .91 .96 .92 .96 .97 .99 .93 .90 ACH2 .94 .93 .90 .88 .90 .93 .96 .96 .91 .95 .90 .86 ACH3 .83 .84 .81 .87 .82 .80 .75 .86 .82 .90 .84 .82 Uniquenesses
ASC1 .81 .75 .74 .86 .82 .80 .84 .69 .74 .71 .71 .61 ASC2 .92 .86 .88 .88 .89 .89 .94 .87 .94 .90 .81 .78 ASC3 .74 .73 .76 .71 .79 .68 .61 .66 .73 .84 .75 .83 ASC4 .81 .76 .73 .80 .78 .76 .86 .74 .72 .73 .76 .72 ASC5 .68 .68 .60 .61 .73 .66 .75 .69 .53 .61 .63 .63 ASC6 .68 .70 .61 .71 .71 .55 .77 .68 .63 .53 .66 .62 ACH1 .31 .35 .33 .31 .43 .28 .39 .29 .24 .13 .37 .43 ACH2 .35 .37 .44 .47 .44 .36 .27 .27 .41 .32 .44 .51 ACH3 .56 .55 .58 .49 .58 .60 .66 .52 .58 .45 .54 .57
RMSEA .03 .06 .06 .07
CFI .98 .94 .95 .93
NNFI .98 .93 .94 .92
2 389.74 397.71 418.12 431.40
df 282 282 282 282
Note. T1 ⫽ Time 1; T2 ⫽ Time 2; T3 ⫽Time 3; ASC ⫽ academic self-concept; ACH ⫽ academic