Assessment of Trophic Status in Bali Strait
U. Zakiyah, E.Y. Herawati, Kusriani
Faculty of Fisheries and Marine Science, University of Brawijaya E-mail : [email protected]
ABSTRACT
The nutrient content in Banyuwangi coastal environment mostly caused by human activities along the coastal area of Bali strait especially in Banyuwangi surrounding areas. The change of organic element content in waters will directly affect plankton community structure and the aquatic trophic level. The aimed of this research were to analyze the plankton community structure, and to observe the quality of aquatic and determine Bali Strait especially Banyuwangi coastal area trophic level. This research was done in October 2015 at Banyuwangi coastal area. Methods used in this research was descriptive with seawater sampling for water quality analysis of several parameter such as nitrates (NO3), phosphates (PO4), TOM (Total Organic Matter) and Chlorophyll-a, meanwhile other parameters were, temperature, pH, Dissolved Oxygen dan salinity from three different depth of three different stations, coastal area of Bangsring, Tandjung Wangi and Muncar. The results for water quality parameters showed that Bangsring coastal area was the most healthy Phytoplankton identified and calculated consisted of 3 division, namely Chlorophyta,
Chrysophyta, and Cyanophyta with total
density ranges between 4-2888 ind/ml. The
value of diversity index phytoplankton (H’)
ranges between 0,3-0,7. Based on the result it can be concluded that Banyuwangi coastal areas were at throphic level of oligotrophic
tended to mesotrophic in northern part and eutrophic especially in Muncar. Thus, it was suggested for the Government to prevent this area becoming more polluted in the future. Keywords: Trophic Level, Eutrophication, Plankton, Banyuwangi Coastal Area, Bali strait.
INTRODUCTION
Human activities in surrounding coastal areas will lead to an increased in organic matter content in coastal area nearby and these can be in form of CO2, N2, H2, CH4, N (nitrates) as well
P (phosphates). Nutrient pollution released to freshwater and coastal areas comes from many diverse sources including agriculture, aquaculture, septic tanks sewage, urban wastewater, urban stormwater run off, industry, and fossil fuel combustion. Nutrients enter aquatic ecosystems via the air, surface water, or even groundwater.
Variable that influence the existence of these substance such as the climatology, Several other parameters such as, tidal ranges, currents will also multiply the effect of the organic matter in the water as well as in the surrounding areas.
Banyuwangi, is one regency located at the most eastern part of Java island facing on Bali strait belong to east Java province and at geographically within 7o40’ – 8o46’ S dan 113o
53’ – 114o38’ E. It has 5.782,50 km2 area with
Bali strait especiallly that located along Banyuwangi coastal area, secondly to analyze the hydro-oseanography related to the season and thirdly to observe the plankton community according to its nutrient distribution.
METHODS & RESULT
This research has been done in October 2015 during the changing season of the dry till rainy season. The hydro-oceanography parameter as well as plankton samples quntitative and qualitatively were analyzed in the Laboratory of Environment and Bitotechnology, Faculty of Fisheries and Marine Science Brawijaya University. These parameters were temperature (oC), Salinity
(ppt) and Dissolved Oxygen (mg/l) using Water Quality Checker AAQ, while the phosphate (ppm), nitrate (ppm), silica (ppm), organic Matter (ppm), Chlorophyll-a (mg/m3) were analyzed.
Figure 1. Research stations at Bali strait (area of Banyuwangi Coastal beaches).
Using spectro-photometer. The water quality and plankton samples were taken within three different depth, at the surface, compensation depth and twice of compensation depth which were, 0.4 and 8m. This methods was done to determine the nutrient distribution that related to the plankton distribution. This sampling methods was also assumed to includes all of euphotic till aphotic zone of the water column. The water samples were taken
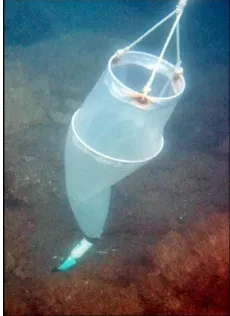
using nansen bottle (Figure 2) while plankton using plankton net (Figure 3) with meshsize range between 20µm – 0.2mm (Nybakken, 1988).
Figure 2. Nansen Bottle.
The plankton net were lowered in to the third depth (8m) and pulled up till surface area and handled. The samples were preserved using i% lugol solution (Nontji, 2006).
Figure 3. Plankton net.
The chlorphyll-a samples were analyzed using vacuum pump methods and the concentration were determine using spectrophotometer with wavelength of (664, 647, 630 and 750 nm) (Boyd, 1981). The formula was:
Note:
E664 : abs 664 nm - absorbance750 nm. E647 : absorbance 647 nm - abs750 nm. E630 : absorbance 630 nm - abs 750 nm. Ve : acetone extract volume (ml).
Vs : samples water volume sieved (liter). D : cuvettes diameter (cm).
Plankton was identified using Davis (1955), Shirota (1966), Todd (1996) and Larink (2006). Meanwhile the plankton samples were also analyzed thier abundance using Sedgwick Rafter with unit (ind/l). Accodrding to APHA (1989) the formula is as follows:
Plankton diversity indices was analyzed using (diversity index) based on Odum (1998):
H’ = - ∑ (ni/N) ln (ni/N) with: i=1
H’ : Shannon-Wiener indices Ni : total individu genus i
Oceanographic condition in Bali strait. Western part of Bali strait is java island nad Bali island on the east side (Hendiarti et al., 2004; Sartimbul et al., 2010).Based on its
topography, the Bali strait water significantly affected by water mass from the Indian Ocean and the Pacific ocean (Figure 4), especially on its oceaographic parameter such as chlorophyll-a and the sea surface temperature (Burhanuddin dan Praseno, 1982).
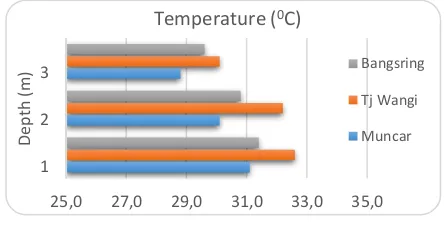
Figure 4. The Indonesian Throughflow that flow from the Pacific ocean to Indian ocean flow through Indonesian water via surface temperatures indicated that the values tends to decrese with the increase in depth. However there were variety of the values in those three diferent station as shown in Figure 5.
The temperatures pattern showed that the values were decrease with the increase in depth, this is due to light intensity variability in temperatures (Figure 5) besides the water mass that comes from the Indonesian troughflow as well as ENSO phenomenon also affect the temperatures distribution significantly through upwelling activity (Hendiarti et.al., 2004; Susanto dan Marra, 2005; Sartimbul et.al., 2010).
The effect of ENSO that carried by the Indonesian Through Flow has caused the oceanographic processes to change its pattern in several areas in Indonesian waters. Bali strait characterized by its colder temperatures and low salinity due to its geographic location (as shown in figure 5 and 6). However, this srait also influenced by the water mass that flow from Pacific ocean to the Indian ocean through Indonesian water (Gordon, 1998; Sartimbul et.al., 2010).
This condition will at the end affect the pH distribution along the coastal water of Banyuwangi as shown in figure 7.
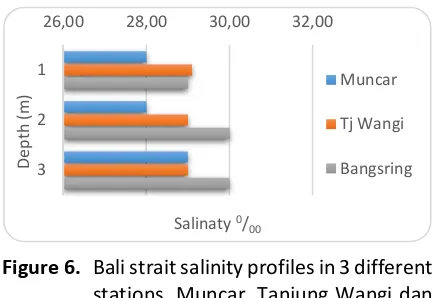
Figure 6. Bali strait salinity profiles in 3 different stations, Muncar, Tanjung Wangi dan Bangsring coastal areas at 3 different depth, surface, secchi disc and twice secchi disc depth.
Furthermore, the salinity distribution values were ranged between 28.0 to 30.0 promil. Figure 7 shown that the salinity values distribution tend to increase with depth which presumably due to the dilution in the surface water.
Figure 7. Bali strait pH profiles in 3 different stations, Muncar, Tanjung Wangi dan Bangsring coastal areas at 3 different depth, surface, secchi disc and twice secchi disc depth.
The salinity distribution also affected by the Indonesian Throughflow as well as the temperatures and pH horizontally and vertically as the water masses different in every layer (Susanto dan Gordon, 2001).
Meanwhile the the nitrates values can be seen in figure 8. The distribution shown that the values were between 0.33 to 1.02 mg/l. The values was due to the upload from the land river system.
Figure 8. Bali strait Nitrates profiles in 3 different stations, Muncar, Tanjung Wangi dan Bangsring coastal areas at 3 different depth, surface, secchi disc and twice secchi disc depth.
available water temperature sand the light intensity in the water.
In general Bali strait water has its unique characteristic with the monsoon wind system that flew from Asia continent to Australia continent and vice versa. This monsoonal system is very dominant and become the main factor that influence the oceanographic dynamin in Indonesian waters especially Bali strait (Wibawa et.al., 2012).
Figure 9. Bali strait Phosphates profiles in 3 different stations, Muncar, Tanjung Wangi, dan Bangsring coastal areas at 3 different depth, surface, secchi disc and twice secchi disc depth.
Other than the monsoonal system, factors that affect the condition of nitrates and phosphates in the water was rubbish/ garbage from human activity in surrounding areas. This domestic pollution will be added with oil from the boast activities from the fisherman activities. This condition will lead to the occurence of eutrophication in the water.
Figure 10. Bali strait Total Organic Matters profiles in 3 different stations, Muncar, Tanjung Wangi dan Bangsring coastal areas at 3 different depth, surface, secchi disc and twice secchi disc depth.
The water eutrophication can also be shown by the values of total Organic Matters. The values found were relatively high and were between 176 to 556 mg/l. These values were significantly higher than the standard values allowed for the sea water.
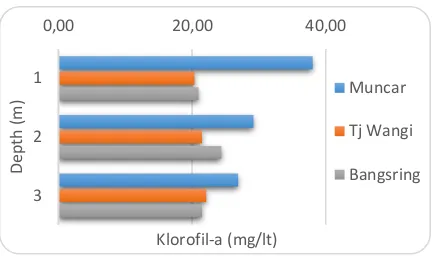
During the west monsoon (December to February), the monsoonal wind movement is from Asia to Australia continent and from the high pressure area to the lower pressure area which passed the Indonesian water. This movement carried humid air masses which causing the increase in precipitaton and lead to more rain in Indonesia. Figure 11 showed the vales of chlorophyll-a which tend to decrease with depth. This condition is due to the light intensity and the temperatures.
Figure 11. Bali strait Chlorophyll-a profiles in 3 different stations, Muncar, Tanjung Wangi dan Bangsring coastal areas at 3 different depth, surface, secchi disc and twice secchi disc depth.
The higher values of chlorophyll-a at the surface of the water was assumed to be due to the phytoplankton abundance and this condition was only because these algae need light intensity to perform the photosynthesis. And when the photosynthesis rate is high this mean the primary prodcutivity also tend to be high. The chlorophyll-a values in coastal area of Banyuwangi as part of Bali strait were between 20.95-38.04 mg/m3 and based on these values level, the water can be classified
0,00 0,01 0,02 0,03 0,04 0,05
in eutrophic condition. This classification was based from Parslow et al (2008), that stated if the chlorophyll-a content ranged between 0-2 mg/m3, the water can be classified as oligotrophic, between 2-5 as meso-oligotrophic, while between 5-20 mg/m3 classified as mesotrophic and between 20-50 mg/m3 classified as euthrophic and more than 50 mg/m3 will be classified as hyper-eutrophic. And sicne the values of this research were more than 20 but less than 50 mg/m3, the water in coastal areas of Banyuwangi as part of the Bali strait can be considered as euthrophic.
Furthermore, the distribution of the dissolved oxygen was shown in Figure 12. In this figure the values of dissolved oxygen were lower with the increase of the depth. This condition was due to the photosynthesis was higher in the surface compare to the deeper water as the light intensity also tend to be lower.
Figure 12. Bali strait Dissolved Oxygen profiles in 3 different stations, Muncar, Tanjung Wangi dan Bangsring coastal areas at 3 different depth, surface, secchi disc and twice secchi disc depth.
This process will produce more oxygen. When chlorophyll-a was found relatively high in the water this condition will also dur to the availability of the algae abundance in the water.
Result of the Phytoplankton Analysis. The total species of the phytoplankton found in this research was relatively rare and
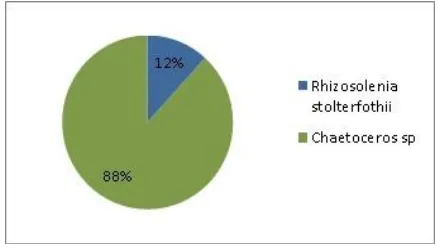
showed different pattern among the three different station and depths. None of them all in the composition were found to be more than 50% as shown in Figure 13.
Figure 13. Phytoplankton Distribution in the surface water (depth 1) of Muncar coastal areas.
Meanwhile, in the deeper water the phytoplankton species founf was less and in the depest water was only one species found except in Muncar coastal areas were found two species, these were Chaetoceros spp and
Rhizosolenia stolterforthii. This condition
might due to the light intensity and nutrient which become limiting factor in the deeper layer of the water. Furthermore, some species still survive in less light and nutrient such as chaetoceros spp. This species was the only species that survive in the deepest water with poor light intensity and nutient content.
Figure 14. Phytoplankton Distribution in the deeper water (secchi depth) of Muncar coastal areas.
0,00 5,00 10,00
1
2
3
Dissolved oxygen (mg/lt)
De
p
th
(m)
Muncar
Tj Wangi
Meanwhile, in the deepest water (depth 3) or twice as secchi depth, the phytoplankton species found was surprisingly increase as shown in Figure15. This condition assumed due to the nutrient content was increase in the bottom layer of the water. The laboratory analysis of the nitrates and phosphates showed a decrease nutrient and
Total Organic Matter. Factors that
responsible for this were total amount of the phytolankton found also the current system in this areas. However the phytoplankton abundance was reached more than 2000 ind/l.
Meanwhile, in Tandjung Wangi station, the phytoplankton spcies was found to be relatively low compares to the Muncar area with three different depth.
The composition of the phytoplankton species much lesser than Muncar station area that has different species.
Figure 15. Phytoplankton Distribution in the deepest water (secchi depth 2x) of Muncar coastal areas.
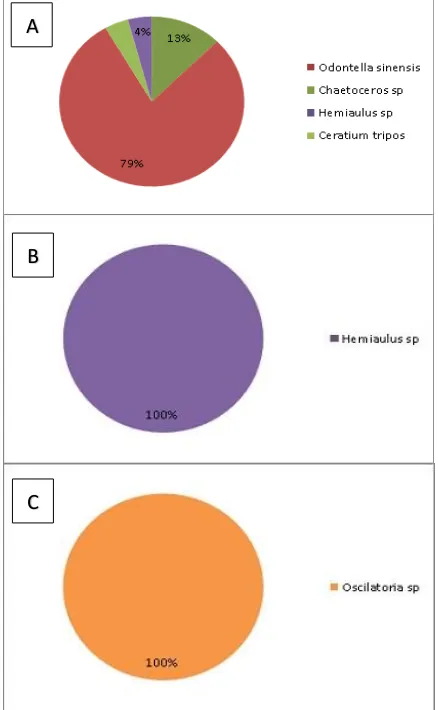
The species found in ths station were only Hemiaulus sp in the secchi disc and was only Leptocylindrus sp or in depth of 8 m as shown in Fures (Figure 16 A, B, and C). The phytoplankton species in Tandjung Wangi areas showed the same pattern in the water, which was higher in the surface and getting lower with increasing depth. In the surface station were found 4 species and in the deeper water was found only one species, which was Hemiaulus sp and Leptcylindrus sp. These species was common species found in
the water with relatively high salinity and survive with low nutrient content water. This result was coincide with the nutient content of these station which founf to be relatively low. Total amount of phytoplankton species found were between 4 to 212 ind/ml.
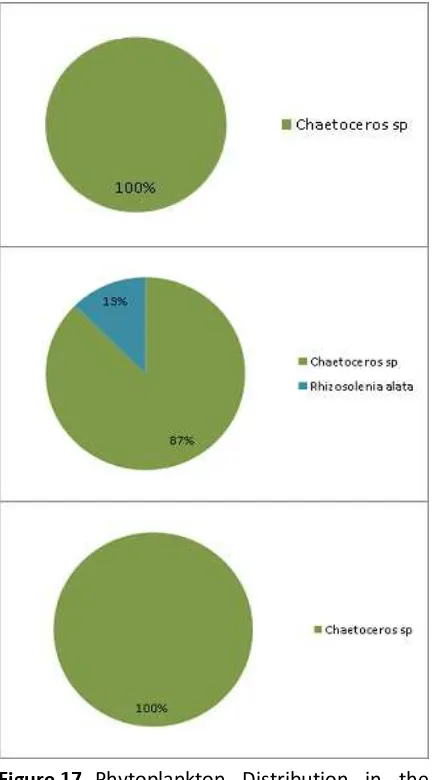
The composition of phytoplankton species in Bangsring station was found to be only 1 till 2 species only. The species found in the surface water wasrhizosolenia stolterfothii
and chaetoceros sp, in depth of secchi disc in
depth 2 of the station which was 4m under the surface the phytoplankton species found was only Hemiaulus sp while in the deepest water the species found was only Leptocylindrus sp
as in Figure 17 A, B, and C the total amount was between 16-32 ind/ml.
Figure 16. Phytoplankton Distribution in the three different depth (0m, 4m and 8m) of Tandjung Wangi coastal areas. A
B
This station seems cleaner compared to Muncar coastal areas. However the fertility level were much depend on the nutient or physical and chemical condition. Or it can be seen from its phytoplantkon abundance.
Figure 17. Phytoplankton Distribution in the three different depth (0m, 4m, and 8m) of Bangsring coastal areas.
According to Landner (1976) in Suryanto (2011), any water can be classified as oligotrophic with low fertility when the total amount of the phytoplankton species 0-2000 ind/l, while the mesotrophic level, the total amount of phytoplankton species will be between 2000-15000 ind/l, and if the total amount reached more than 15000
ind/l, the level will be considered as high fertility or in eutrophic condition.
CONCLUSION & SUGGESTION
Based on the analysis result of the water quality parameters as well as the phytoplankton analysis in three different station, Muncar, Tandjung Wangi and Bangsring with three different depth in each station it can be concluded that Banyuwangi coastal areas as part of Bali strait has eutropic level in some of the areas especially Muncar. However, more in northern part of the strait the water were still in slightly better condition, as the level was mesotrophic. The external factor such as Indonesian Throughflow has significant influence to the condition of the water quality in this strait.
Based on this result it was suggested that there should be policies from the authority to slowdown the rate of pollution and environment degradation that going into this areas as it can affected wider areas of the strait and at the end can effect the economical status both of the communities and the environment as well.
REFFERENCES
American Public Health Association (APHA). 1989. Standard Methods for the Examination of Water and Waste Water Including Bottom Sediment and
Sludges. 17th editions. Amer. Publ.
Health Association.Inc., New York. 1527 p.
coastalregion of the United Stated,
Menilai Kualitas Suatu Perairan Lotik.
Fakultas MIPA USU. Medan.
Beveridge, M. C. M. 1984. Cage and Pen Fish
Farming. Carrying Capacity models
and environmental impact. FAO Fish. Tech. Pap., (225): 131 p.
Boyd, C. E. 1978. PhytopLankton. 2nd
editions. Edward Arnold. London. 118 p.
Burhanuddin dan D. Praseno. 1982. Lingkungan Perairan di Selat Bali.
Prosiding. 2/SPL/82: 27-32.
Cappenberg, H. A. W. 2000. Komunitas Moluska di Perairan Teluk Lampung
Propinsi Lampung. Kumpulan Jurnal
Perairan Indonesia Oseanografi, Biologi dan lingkungan. Pusat Penelitian Oseanografi. Jakarta. Davis, C. C. 1995. The Marine And
Fresh-Water Plankton. Michigan State
University Press: Japan.
Departemen Kelautan dan Perikanan (DKP). 2009. Kumpulan Peraturan Tentang
Konservasi Sumber Daya Ikan.
Direktorat Konservasi dan Taman Nasional Laut: Jakarta Pusat.
Edgardh, L. A. 2013. Landsat 8 Snabba
Leveranser av Bilder Till Anvandarna.
Spacemetric.
Effendi, H. 2003. Telaah Kualitas Air. bagi Pengelola Sumber Daya dan Lingkungan
Perairan. Kanisius: Yogyakarta.
Elfinurfajri, F. 2009. Struktur Komunitas
Fitoplankton Serta Keterkaitannya
dengan Kualitas Perairan di Lingkungan
Tambak Udang Intensif. Skripsi. Institut
Pertanian Bogor: Bogor.
Endang. 2014. Sistem Informasi Geografis
Menggunakan Arc Gis. Kompas
Gramedia: Jakarta.
Fachrul, M. F., H. Herman dan Listari. 2005.
Komunitas Fitoplankton sebagai Bio-indikator Kualitas Perairan Teluk
Jakarta. http://www.lipi.go.id. Diakses
pada tanggal 16 Mei 2015.
Ferianita, M., H. Haeruman dan Sitepu. 2005. Komunitas Fitoplankton Sebagai Bio-Indikator Kualitas Perairan Teluk
Jakarta. Jurusan Teknik Lingkungan.
Fakultas Arsitektur Lansekap Teknologi Lingkungan. Universitas Trisakti. Jakarta. Hendiarti, N., S. Herbert and O. Thomas. 2004. Investigation of Different
Coastal Processes In Indonesian
Waters Using Seawifs Data. Deep-Sea
Research II 51, 85–97.
Nontji, A. 2006. Tiada Kehidupan di Bumi Tanpa Keberadaan Plankton. Lembaga Ilmu Pengetahuan Indonesia (Pusat Penelitian Oseanografi). Jakarta Nybakken, J.W. 1988. Biologi Laut: Suatu
Pendekatan Ekologis. Gramedia.
Jakarta.
Odum, E.P. 1998. Dasar-dasar Ekologi:
Terjemahan dari Fundamentals of
Ecology. Alih Bahasa Samingan, T. Edisi
Ketiga. Universitas Gadjah Mada Press, Yogyakarta. 697 p.
Parslow, J.J. Hunter and A. Davidson.2008. Estuarine Eutrophication Models. Final Report Project E6 National River Health Program. Water Services Association of Australian Melbourne Australia. CAIRO. Marine Research. Hobart. Tasmania.
Parsons TR, M Takashi, B Hargrave. 1984. Biological Oceanographic Processes. Ed. Ke-3. Pergamon Press. Oxford. Praseno, D,P. dan Sugestiningsih., 2000, Red
Penelitian dan Pengembangan Oseanologi – LIPI, Jakarta.
Sartimbul, A., H. Nakata, E. Rohadi, B. Yusuf and H.P. Kadarisman. 2010. Variations in Chlorophyll-a Concentration and The Impact on Sardinella lemuru Catches in
Bali Strait, Indonesia. Progress in
Oceanography 87. 168-175.
SNI 06-2477-1991. Metode Pengujian Kadar Silika dalam Air dengan Alat Spektrofotometer secara Molibdat silikat.
Susanto, R.D., A.L. Gordon, dan Q. Zheng. 2001. Upwelling along the coast of Java and Sumatra and its relation to ENSO. Geophysical Research Letters 29: 1599-1602.
Susanto, R.D., dan J. Marra. 2005. Effect of the 1997/98 El Nino on Chlorophyll a Variability Along the Southern Coast of
Java and Sumatra. Oceanography, 18: 124-127.
Wasfi, A. 2000. Tingkat Kesuburan Situ Rawa Besar Depok Berdasarkan Kandungan
Unsur Hara N dan P. Skripsi. Fakultas
Perikanan dan Ilmu Kelautan. Institut Pertanian Bogor: Bogor.
Wibawa, T, A. Dian, N. Budi N. 2012. Sebaran Spasial Kelimpahan Ikan Cakalnag
(Katsuwonus pelamis) Berdasarkan
Analisis Data Satelit Oseanografi. Balai Penelitian dan Observasi Laut. Kementerian Kelautan dan Perikanan RI. Prosiding Insinas 2012.
