Ya You, Gautham G. Vadakkepatt, & Amit M. Joshi
A Meta-Analysis of Electronic
Word-of-Mouth Elasticity
The authors conduct a meta-analysis on the effect of electronic word of mouth on sales by examining 51 studies (involving 339 volume and 271 valence elasticities) and primary data collected on product characteristics (durability, trialability, and usage condition), industry characteristics (industry growth and competition), and platform characteristics (expertise and trustworthiness). Their analysis reveals that electronic word-of-mouth volume (valence) elasticity is .236 (.417). More importantly, the findings show that volume and valence elasticities are higher for privately consumed, low-trialability products that operate in less competitive industries and whose reviews are carried on independent review sites. Furthermore, volume elasticities are higher for durable goods and for reviews on specialized review sites, whereas valence elasticities are greater for community-based sites. Drawing on the results, they discuss several implications for managers and researchers and explain why valence elasticities are often found to be insignificant. Finally, they propose numerous directions for future research in the area on the basis of their findings.
Keywords: electronic word-of-mouth elasticity, social media, meta-analysis Online Supplement: http://dx.doi.org/10.1509/jm.14.0169
Ya You is Assistant Professor of Marketing, School of Business, College of Charleston (e-mail: [email protected]). Gautham G. Vadakkepatt is Assis-tant Professor of Marketing, School of Business, George Mason Univer-sity (e-mail: [email protected]). Amit M. Joshi is Associate Professor of Marketing, College of Business Administration, University of Central Florida (e-mail: [email protected]). This article is based on the first author’s dissertation, and she thanks members of her dissertation com-mittee for their feedback. All authors contributed equally to this research. Roland Rust served as area editor for this article.
E
lectronic word of mouth (eWOM)—Internet-mediated written communications between current or potential consumers (also categorized as consumer–consumer interactions by Yadav and Pavlou [2014])—has emerged to play an important role in the consumer decision-making process (Cheung and Lee 2012), with an increasing number of consumers trusting these communications over traditional media (Bickart and Schindler 2001; Goldsmith and Horowitz 2006). Not surprisingly, companies are allocating larger portions of their marketing budgets to generate and manage the eWOM process (Moorman 2014). This increased practi-tioner emphasis on eWOM has resulted in a substantial body of research focused on establishing a link between eWOM and product sales (“eWOM elasticity” hereinafter). Although these studies have advanced our understanding of the effect of eWOM on sales, they also raise several ques-tions. For example, why do we observe such high variances in the reported elasticities (for reported elasticities in each study, see Theme 1 in the Web Appendix) of the two key metrics used to measure eWOM, volume and valence1? Why,even when studies focus on the same empirical context, do we observe conflicting findings with regard to these two key metrics? For example, using data from the movie industry, Liu (2006) and Duan, Gu, and Whinston (2008) find that volume, not valence, of consumer reviews is significantly associated with movie revenues, whereas Chintagunta, Gopinath, and Venkataraman (2010) find that it is valence, rather than volume, that drives box office performance. Are all eWOM communications created equal (as most studies assume), or do different platforms (such as blogs, forums, and social networking sites) have varying effects?
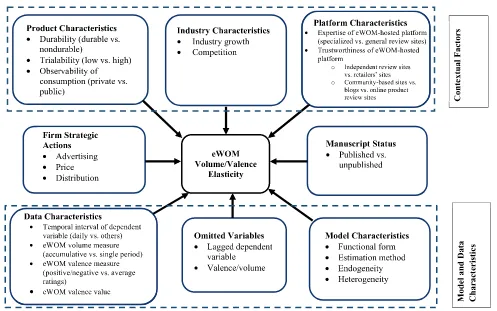
To reconcile these issues, to synthesize the research in this domain, and to guide future studies, we undertake a meta-analytic review. More specifically, and as Figure 1 shows, we examine how (1) contextual factors of product, industry, and platform characteristics; (2) strategic action factors of a firm (e.g., advertising, pricing, distribution)2; (3) data characteristics; (4) omitted variables; (5) model char-acteristics; and (6) manuscript status (Albers, Mantrala, and Sridhar 2010; Assmus, Farley, and Lehmann 1984; Sethura-man, Tellis, and Briesch 2011) affect eWOM elasticities.
Although Floyd et al. (2014) provide a previous meta-analysis on the impact of online reviews on sales, there are several differences between our study and theirs that merit discussion. First, Floyd et al. restrict their analysis to online product reviews, whereas we consider several additional sources of eWOM, such as blogs, forums, and social net-1Volume refers to the total number of eWOM messages, and
valence refers to the tone or preference of comments (typically expressed as positive/negative/neutral).
FIGURE 1
A Conceptual Framework of the Factors Influencing eWOM Effect
working sites. Consequently, our analysis is more compre-hensive, covering 51 studies (with 610 total elasticities), compared with Floyd et al.’s 26 studies and 412 elasticities. More importantly, by considering different sources of eWOM, our research provides a more nuanced understand-ing of the effect of eWOM platforms on eWOM elasticity because we analyze each platform on the basis of expertise, sender motivation, and sender–recipient relationship. Sec-ond, whereas Floyd et al. pool volume and valence elas-ticities, we analyze each separately. This method enables us to (1) avoid pooling bias, (2) identify unique drivers of vol-ume and valence elasticities, and (3) address conflicts in extant research that pertain to the impact of these dimen-sions. Third, our research includes multiple new drivers of eWOM elasticity, such as product trialability, industry growth, competition, strategic marketing variables, and numerous data variables that were not considered previ-ously. Perhaps because of these differences, our research overturns some of the findings in Floyd et al. and generates several new results that provide a clearer understanding of the area as well as richer inferences and directions for mar-keting practice and science alike.
Our meta-analysis of 51 studies involving 339 volume elasticities and 271 valence elasticities (for details on all the studies, products, and platforms included in our analysis, see Themes 1–3 in the Web Appendix) shows the average eWOM volume elasticity to be .236 and the average valence elasticity to be .417. In general, our results find
dimensions of eWOM and offer directions for future research, our main contribution is that we resolve the incon-sistent findings in previous research and explain hetero-geneity in reported elasticities by shedding light on how the contextual factors of product, industry, and platform charac-teristics influence eWOM elasticity. In doing so, we iden-tify the role of factors such as product trialability, platform type, and industry competition, which were not covered in Floyd et al.’s (2014) previous meta-analysis. Another con-tribution of our analysis is our evidence that there are some differences between drivers of volume and valence elas-ticities that scientists and practitioners alike should con-sider. By analyzing eWOM elasticities separately, we arrived at the key finding that all levels of valence ratings do not affect sales in the same manner. Specifically, we observe that negative ratings have a more significant effect on eWOM valence elasticity. Finally, from the perspective of managers, we find that (1) eWOM elasticities are greater than most other marketing-mix elasticities (with valence elasticities being much larger), (2) managers need to account for product- and industry-specific factors to under-stand the impact of eWOM volume and valence, and (3) not all eWOM platforms have the same effect.
The remainder of the article is organized as follows. First, we develop hypotheses regarding several factors that could influence eWOM elasticities. Next, we describe the data collection approach and the model we use to test our hypotheses. We then present and discuss the results of our analysis, followed by a discussion of the academic and managerial implications of our findings. We conclude by identifying avenues for future research.
Theory and Hypotheses
Product uncertainty, defined as a consumer’s lack of infor-mation about the available alternatives or fit of products with user needs, is a key driver of the extent of information search a consumer undertakes (Maity, Dass, and Malhotra 2014; Moorthy, Ratchford, and Talukdar 1997; Urbany 1986; Urbany, Dickson, and Wilkie 1989). However, this information search is constrained by the cost–benefit trade-off associated with gathering and processing the informa-tion: benefits include reduced product uncertainty, greater fit to user needs, and potential price savings, whereas costs include monetary costs, opportunity cost of time, and the psychological and cognitive costs of gathering and process-ing the information (e.g., frustration, information overload) (Maity, Dass, and Malhotra 2014; Schmidt and Spreng 1996). Consumer information search has been studied in-depth in marketing research (e.g., Moorthy, Ratchford, and Taluk-dar 1997; Srinivasan and Ratchford 1991; Urbany 1986; Urbany, Dickson, and Wilkie 1989). We use this informa-tion search literature to develop the conceptual framework of our article for three main reasons. First, for eWOM to affect sales, consumers must seek out this information3and
then trust its credibility enough to make decisions based on it. Thus, like any other information source (e.g., traditional advertising), eWOM is subject to the cost–benefit argument in evaluating its usage by consumers and its ultimate effect on sales. Second, prior research has shown that the extent of information sought, the intensity of information search, and the effect of this information on actual purchase behavior can vary according to product characteristics, industry char-acteristics, and platform characteristics such as credibility of source and message (e.g., Beatty and Smith 1987; For-man, Ghose, and Wiesenfeld 2008; Gu, Park, and Konana 2012; Moore and Lehmann 1980; Urbany 1986; Urbany, Dickson, and Wilkie 1989). Thus, the information search literature provides a rich set of contextual factors to under-stand their effects on eWOM elasticity. Third, characteris-tics of the Internet, such as the differing levels of anonymity provided to transmitters of eWOM, enable us to include platform factors that can capture both the enhanced value of that information as well as the costs associated with gather-ing and processgather-ing information online.
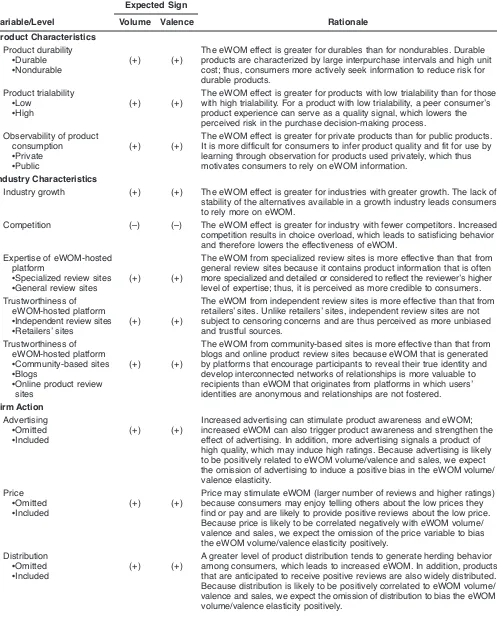
In the following subsections, we discuss how the con-textual factors of product, industry, and platform character-istics influence eWOM elasticity. For the entire set of expected relationships, see Table 1.
Product Characteristics
As we have mentioned, perceived benefits of information search such as reduced product uncertainty and lower prices have a significant impact on search activity (e.g., Schmidt and Spreng 1996; Srinivasan and Ratchford 1991). In this subsection, we argue that the magnitude of these benefits varies according to product characteristics of durability, tri-alability, and usage situations. Because our explicit assump-tion is that eWOM metrics affect sales only if consumers first seek out the information, product characteristics influ-ence eWOM elasticity through the extent of information sought through various eWOM platforms.
Product durability (durable vs. nondurable). We expect information search to be more beneficial for durable goods than nondurable goods for two reasons. First, durable goods (e.g., automobiles) are more complex and have longer inter-purchase intervals than nondurable goods (e.g., movies) (Farley and Lehmann 1977; Kim and Sullivan 1998; Sethu-raman and Tellis 1991). These factors increase the product uncertainty and perceived risk associated with durable goods, which in turn increase the benefits of information search. Consistent with this argument, Moorthy, Ratchford, and Talukdar (1997) find that in the automotive context, the extent of information search depends on relative brand uncertainty (i.e., which brand among the many brands is the best fit) and individual brand uncertainty (i.e., what each brand offers). Second, and mainly because durable goods are more expen-sive (Urbany 1986), information search for durable goods can also result in larger potential price savings.
Electronic word of mouth is a good source of informa-tion because it leverages the advantages of the Internet (i.e., asynchronous mode of communication, multiway commu-nication, communication between potential strangers, and 3We are assuming goal-directed search. However, it is possible
Expected Sign
Variable/Level Volume Valence Rationale
Product Characteristics Product durability
•Durable •Nondurable
(+) (+)
The eWOM effect is greater for durables than for nondurables. Durable products are characterized by large interpurchase intervals and high unit cost; thus, consumers more actively seek information to reduce risk for durable products.
Product trialability •Low
•High
(+) (+)
The eWOM effect is greater for products with low trialability than for those with high trialability. For a product with low trialability, a peer consumer’s product experience can serve as a quality signal, which lowers the perceived risk in the purchase decision-making process.
Observability of product consumption
•Private •Public
(+) (+)
The eWOM effect is greater for private products than for public products. It is more difficult for consumers to infer product quality and fit for use by learning through observation for products used privately, which thus motivates consumers to rely on eWOM information.
Industry Characteristics
Industry growth (+) (+) The eWOM effect is greater for industries with greater growth. The lack of stability of the alternatives available in a growth industry leads consumers to rely more on eWOM.
Competition (–) (–) The eWOM effect is greater for industry with fewer competitors. Increased competition results in choice overload, which leads to satisficing behavior and therefore lowers the effectiveness of eWOM.
Expertise of eWOM-hosted platform
•Specialized review sites •General review sites
(+) (+)
The eWOM from specialized review sites is more effective than that from general review sites because it contains product information that is often more specialized and detailed or considered to reflect the reviewer’s higher level of expertise; thus, it is perceived as more credible to consumers. Trustworthiness of
eWOM-hosted platform •Independent review sites •Retailers’ sites
(+) (+)
The eWOM from independent review sites is more effective than that from retailers’ sites. Unlike retailers’ sites, independent review sites are not subject to censoring concerns and are thus perceived as more unbiased and trustful sources.
Trustworthiness of eWOM-hosted platform •Community-based sites •Blogs
•Online product review sites
(+) (+)
The eWOM from community-based sites is more effective than that from blogs and online product review sites because eWOM that is generated by platforms that encourage participants to reveal their true identity and develop interconnected networks of relationships is more valuable to recipients than eWOM that originates from platforms in which users’ identities are anonymous and relationships are not fostered. Firm Action
Advertising •Omitted •Included
(+) (+)
Increased advertising can stimulate product awareness and eWOM; increased eWOM can also trigger product awareness and strengthen the effect of advertising. In addition, more advertising signals a product of high quality, which may induce high ratings. Because advertising is likely to be positively related to eWOM volume/valence and sales, we expect the omission of advertising to induce a positive bias in the eWOM volume/ valence elasticity.
Price •Omitted •Included
(+) (+)
Price may stimulate eWOM (larger number of reviews and higher ratings) because consumers may enjoy telling others about the low prices they find or pay and are likely to provide positive reviews about the low price. Because price is likely to be correlated negatively with eWOM volume/ valence and sales, we expect the omission of the price variable to bias the eWOM volume/valence elasticity positively.
Distribution •Omitted •Included
(+) (+)
A greater level of product distribution tends to generate herding behavior among consumers, which leads to increased eWOM. In addition, products that are anticipated to receive positive reviews are also widely distributed. Because distribution is likely to be positively correlated to eWOM volume/ valence and sales, we expect the omission of distribution to bias the eWOM volume/valence elasticity positively.
TABLE 1
Expected Sign
Variable/Level Volume Valence Rationale
Data Characteristics
Temporal interval of dependent variable (sales)
•Daily •Others
(+) (+)
We expect that a finer level of temporal aggregation (e.g., daily instead of weekly or monthly) of the dependent variable will positively affect the eWOM volume and valence elasticities because when the dependent variables (e.g., sales) are aggregated at a coarser level, finer fluctuations may be lost.
eWOM volume measure •Accumulative •Single period
(–) (–)
People tend to weigh recent information more heavily than previous information. Indeed, consumers might not read all reviews because of the opportunity cost of time. Moreover, eWOM tends to fade away more quickly than face-to-face WOM because there is less trust and fewer social interactions in the virtual world. Thus, we expect that the sales response to accumulative eWOM is less than that to single-period (e.g., current/previous time period) eWOM.
eWOM valence measure •Positive ratings •Negative ratings •Average ratings
(–) (–)
We expect the eWOM valence measure of extreme positive ratings (e.g., five stars in a 1–5-star rating scale)/extreme negative ratings (e.g., one star in a 1–5-star rating scale) to negatively bias the valence elasticity because of customer risk aversion.
eWOM valence value (–) We expect higher valence ratings to bias the eWOM valence elasticity negatively. The lower the valence ratings, the poorer the product quality perceived, and thus, the stronger effect they have on consumer’s decision according to prospect theory.
Omitted Variables
Lagged dependent variable •Omitted
•Included
(+) (?)
We expect the omission of lagged sales to positively bias eWOM volume elasticity because lagged sales are likely to be correlated positively with current-period eWOM volume and sales. We have no prior expectations for the effect on valence elasticities.
Valence/volume •Omitted •Included
(–) (–)
Valence of ratings tends to trend downward as more reviews accumulate because of self-selection bias. We expect the omission of valence (volume) to bias the eWOM volume (valence) elasticity estimate negatively because valence is likely to be negatively related to volume and positively related to product sales.
Model Characteristics
Functional form •Multiplicative •Others
(?) (?) No prior expectations
Estimation method •OLS
•Others
(?) (?) No prior expectations
Endogeneity •Omitted •Included
(–) (–)
Consistent with previous studies (e.g., Bijmolt, Van Heerde, and Pieters 2005; Sethuraman, Tellis, and Briesch 2011), we expect the failure to account for endogeneity to bias the eWOM volume and valence elasticities negatively.
Heterogeneity •Omitted •Included
(?) (?) No prior expectations
Other Factors
Manuscript status •Published •Unpublished
(+) (+)
We expect eWOM volume and valence elasticities in published articles to be greater than those in unpublished articles.
archiving ability) to provide reach, accessibility, and persis-tence of messages that traditional WOM cannot achieve (Cheung and Lee 2012). Moreover, these Internet platforms make it easier to capture a range of diverse consumer per-spectives and better allow consumers to gauge the fit of the product with their own needs and preferences (Chen and Xie 2008). Thus, it is not surprising that recent research on consumer information search in the durable goods context has shown that consumers are switching from offline to online information search (Klein and Ford 2003; Morton, Zettelmeyer, and Silva-Risso 2001; Ratchford, Talukdar, and Lee 2007). In addition, research has shown that search-ing on the Internet can result in lower prices for consumers of durable goods (Morton, Zettelmeyer, and Silva-Risso 2001; Zettelmeyer, Morton, and Silva-Risso 2006). Because of the greater benefits of information search for durable goods, combined with the benefits of eWOM over tradi-tional WOM, we hypothesize the following:
H1: Electronic word-of-mouth (a) volume elasticities and (b) valence elasticities are greater for durable products than for nondurable products.
Product trialability (low vs. high). Product trial plays a significant role in influencing consumer beliefs and pur-chase intentions mostly because it provides a low-risk option through which consumers can more accurately evaluate product attributes and fit (Agarwal and Prasad 1997; Wright and Lynch 1995). In other words, product trials affect sales positively by minimizing product uncertainty (Bawa and Shoemaker 2004). Because product trials provide con-sumers a cost-effective way to reduce product uncertainty, all else being equal, the benefits of information search for such products are generally lower than for products with low trialability. Therefore, we expect eWOM to have a greater impact on sales for products that have low trialabil-ity compared with products that can be easily tried before being purchased. Formally,
H2: Electronic word-of-mouth (a) volume elasticities and (b) valence elasticities are greater for products with low trial-ability than for products with high trialtrial-ability.
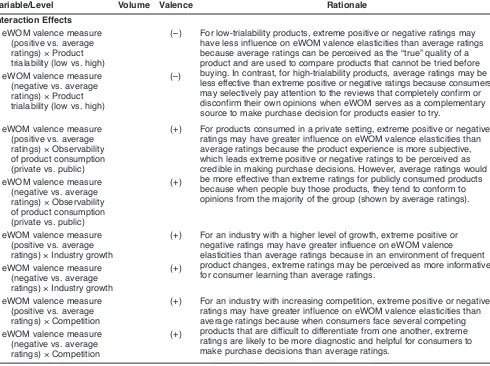
Observability of product consumption (private vs. pub-lic). Public consumption of products can weaken the effect of eWOM metrics on sales through three routes. First, Expected Sign
Variable/Level Volume Valence Rationale
Interaction Effects eWOM valence measure
(positive vs. average ratings) ¥Product trialability (low vs. high)
(–) For low-trialability products, extreme positive or negative ratings may have less influence on eWOM valence elasticities than average ratings because average ratings can be perceived as the “true” quality of a product and are used to compare products that cannot be tried before buying. In contrast, for high-trialability products, average ratings may be less effective than extreme positive or negative ratings because consumers may selectively pay attention to the reviews that completely confirm or disconfirm their own opinions when eWOM serves as a complementary source to make purchase decision for products easier to try.
eWOM valence measure (negative vs. average ratings) ¥Product trialability (low vs. high)
(–)
eWOM valence measure (positive vs. average ratings) ¥Observability of product consumption (private vs. public)
(+) For products consumed in a private setting, extreme positive or negative ratings may have greater influence on eWOM valence elasticities than average ratings because the product experience is more subjective, which leads extreme positive or negative ratings to be perceived as credible in making purchase decisions. However, average ratings would be more effective than extreme ratings for publicly consumed products because when people buy those products, they tend to conform to opinions from the majority of the group (shown by average ratings). eWOM valence measure
(negative vs. average ratings) ¥Observability of product consumption (private vs. public)
(+)
eWOM valence measure (positive vs. average ratings) ¥Industry growth
(+) For an industry with a higher level of growth, extreme positive or negative ratings may have greater influence on eWOM valence elasticities than average ratings because in an environment of frequent product changes, extreme ratings may be perceived as more informative for consumer learning than average ratings.
eWOM valence measure (negative vs. average ratings) ¥Industry growth
(+)
eWOM valence measure (positive vs. average ratings) ¥Competition
(+) For an industry with increasing competition, extreme positive or negative ratings may have greater influence on eWOM valence elasticities than average ratings because when consumers face several competing products that are difficult to differentiate from one another, extreme ratings are likely to be more diagnostic and helpful for consumers to make purchase decisions than average ratings.
eWOM valence measure (negative vs. average ratings) ¥Competition
(+)
observing a product in use provides potential consumers with an alternative route to gather information about the product, which in turn reduces the benefits of information obtained through eWOM. Second, observability of product con-sumption could result in mimicking behavior. Often called observational learning or social learning (Bikhchandani, Hirshleifer, and Welch 1992; Chen, Wang, and Xie 2011), this mimicking behavior could arise because consumers perceive other users’ final choice as more reliable information than their own private information (Chen, Wang, and Xie 2011; Dholakia, Basuroy, and Soltysinski 2002). This mimicking behavior, driven by observability of other users’ product consumption, can detract from the benefits of information search and therefore weaken eWOM elasticity. Third, prod-ucts help people not only create self-identities (e.g., Belk 1988; Berger and Heath 2007; Escalas and Bettman 2003) but also infer identities of others (e.g., Belk, Bahn, and Mayer 1982). Thus, products are both extensions of self-identity and part of a person’s social identity (Kleine, Kleine, and Kernan 1993). If consumers see a product being used, they may buy the product to conform with others under certain conditions (Schmidt and Spreng 1996), which again reduces the benefits of information obtained through eWOM.
However, products that are privately consumed provide potential consumers with very limited opportunity to learn through observation. For these products, eWOM can have a significant impact on sales by making information from pri-vate consumption more readily available, therefore enabling consumers to evaluate whether the product matches their own preferences. Thus, we hypothesize the following:
H3: Electronic word-of-mouth (a) volume elasticities and (b) valence elasticities are greater for privately consumed products than for publicly consumed products.
The relationship between product observability and eWOM elasticity need not be as clear-cut. This is because it is also possible that consumers engage in more detailed information search for publicly consumed products because of the increased salience of these products in the construction of their self and social identities. According to this argument, publicly consumed goods may benefit from information search, which in turn has implications for eWOM elasticity.
Industry Characteristics
The number of alternatives available in the marketplace and the stability of these alternatives are important determinants of the extent of information search a consumer undertakes (Beatty and Smith 1987; Moore and Lehmann 1980). In our framework, we consider industry competition as a direct proxy for the number of alternatives in the marketplace, whereas industry growth proxies the stability of the alterna-tives in the marketplace. We use industry growth to proxy for stability of available alternatives because fast-growth industries are associated with changing technologies, evolv-ing product attributes, and new product introductions, whereas slow-growth industries are associated with stability in products and available alternatives (Klepper 1996; Utter-back and Suarez 1993). We expand on these arguments in the following subsections.
Growth. Prior research on industry evolution has pro-vided evidence that growth industries are industries in which (1) the underlying technology is still evolving (Utter-back and Suarez 1993) and (2) product innovation, rather than process innovation, is the industry norm (Klepper 1996). These characteristics of growth industries directly correlate with the lack of stability of the alternatives avail-able in a growth industry. Under such market conditions, consumers are less likely to rely on prior knowledge and more likely to rely on externally retrieved information (Hulland and Kleinmuntz 1994; Punj and Staelin 1983). Moreover, the benefits of information search are greater in these contexts. Because eWOM is ubiquitous and is a more credible source of external information (compared with marketing communications) for learning about usage situa-tions and experiences (Bickart and Schindler 2001; Gold-smith and Horowitz 2006), we expect eWOM elasticity to be greater in fast-growth industries.
H4: Electronic word-of-mouth (a) volume elasticities and (b) valence elasticities are greater for industries with higher growth.
However, the relationship might not be as clear-cut as articulated in H4for two reasons. First, when the underlying technology or product attributes are changing, the potential for information overload through eWOM increases, which might result in an opposite effect on eWOM elasticity. Sec-ond, prior research has shown that the addition of a novel product attribute may result in consumers evaluating the new product poorly because of associated learning costs (Mukherjee and Hoyer 2001), thus negatively affecting sales or at least dampening the eWOM elasticity.
Platform Characteristics
For consumers to rely on eWOM rather than other sources of information, there must be some credibility associated with the source of the recommendation. According to Kel-man (1961), credibility is composed of two major dimen-sions, expertise and trustworthiness, in which expertise is defined as the perceived ability of an information source to provide detailed information and trustworthiness is the per-ceived information source’s motivation to make valid asser-tions without bias (McGuire 1969). Next, we hypothesize how these two dimensions of platform credibility affect eWOM volume and valence elasticities.
Expertise of the eWOM-hosted platform (specialized vs. general review sites). We operationalize expertise by distin-guishing specialized review sites, which have a narrow focus on a particular product category (e.g., Flixster.com for movies, CarandDriver.com for cars), and general review sites, which elicit consumer reviews for a wide range of products (e.g., Amazon.com, Epinions.com). Specialized review sites, by their nature, host reviews by experts on that particular product category, whereas generalist platforms may attract more novice reviewers. As such, reviews on specialized review sites have a greater discussion of product attributes, while other consumer reviews may have more information about individual consumer preferences and experiences (Chen and Xie 2005, 2008). Because potential consumers value reviewer expertise (Bansal and Voyer 2000) and because experts evaluate a product on a larger number of attributes (Moorthy, Ratchford, and Talukdar 1997), specialized review sites probably provide more reli-able and detailed information to consumers, which in turn can reduce product uncertainty. Therefore, we expect spe-cialized review sites to provide greater benefits to con-sumers and have a greater effect on eWOM volume and valence elasticities. Formally, we hypothesize the following: H6: Electronic word-of-mouth (a) volume elasticities and (b) valence elasticities estimated with reviews from special-ized review sites are greater than those estimated with reviews from general review sites.
Trustworthiness of the eWOM-hosted platform. Because traditional WOM is propagated through in-person commu-nication between relatives and friends, it is notably different from eWOM in two ways. First, traditional WOM commu-nication is typically not driven by profit motives. This is one reason why a general consumer belief exists that infor-mation received from other product users is more trustwor-thy than company-sponsored communication (Goldsmith and Horowitz 2006). Second, the effectiveness of tradi-tional WOM is predicated on the familiarity between the sender and recipient of the message to assess source credi-bility and message quality (Brown and Reingen 1987). However, with eWOM, both these factors are called into question. Thus, we examine two factors that can influence perceived trustworthiness of the eWOM communication: (1) motivation for eWOM and (2) facilitating relationships between the sender and the recipient of the message.
Motivation for eWOM (independent review sites vs. retailers’ sites). Prior research has hypothesized that WOM is most effective when there is similarity between the source and the recipient and when their incentives are aligned (e.g., Brown and Reingen 1987). Because it is impossible to infer actual motives, we operationalize this variable by categorizing the type of platform that carries eWOM. The platforms that host eWOM information can be broadly categorized into independent review sites (e.g., Epinions.com) and retailers’ sites (e.g., Amazon.com). Pre-vious literature has suggested that retailers may have an incentive to manipulate consumer reviews on their sites to generate more sales (Gu, Park, and Konana 2012). In con-trast, independent review websites provide more objective information and are not subject to censoring concerns. Therefore, they are perceived as being more unbiased and trustworthy sources and should have a greater influence on consumer decisions (Senecal and Nantel 2004). Formally,
H7: Electronic word-of-mouth (a) volume elasticities (b) and valence elasticities estimated with reviews on independent review sites are greater than those estimated with reviews on retailers’ sites.
Facilitating relationships between sender and recipient of message (community-based sites vs. blogs vs. online product review sites). Brown and Reingen (1987) show that WOM is at its most influential if there is a strong relationship between the sender and the recipient of the message. A key characteristic of eWOM is that there need not exist any rela-tionship between the sender and recipient of the message to the extent that several forms of eWOM are anonymous. This would not be a problem if the platforms were structured to facilitate assessments of message quality by allowing repeated interactions (and therefore learning) between members of the platform. However, platforms vary in this ability to foster relationships between members. Specifically, community-based sites (e.g., social networking sites) thrive on repeated interactions among members, who are also often known to one another outside cyberspace, which leads to the develop-ment of stronger links between them (Yadav et al. 2013). In contrast, online product review sites, with mostly anony-mous reviews, typically do not engender relationship build-ing with the source of the eWOM. Blogs lie in the middle of these anchor points: their success depends on building rela-tionships with readers (who may still remain anonymous). Blogs also facilitate repeated interactions by allowing read-ers to post comments to the blog and allowing the blog author to respond to these postings. We do not expect the relationship-building abilities of blogs to be stronger than those of community-based sites because (1) the frequency of interaction on community-based sites is greater than that of blogs and (2) members in community-based sites are con-nected to one another because they have been acquainted at some point in time. It is perhaps for this reason that Ratch-ford, Talukdar, and Lee (2007) find that even within the world of online information search, consumers rely on dif-ferent sources of information in varying ways.
the depth of relationship between participants. In line with this notion, we posit that eWOM generated by platforms that encourage participants to reveal their true identity and develop interconnected networks of relationships is more valuable to recipients than eWOM that originates on plat-forms in which users’ identities are anonymous and rela-tionships are not fostered (e.g., online product review sites). Therefore, we hypothesize the following:
H8: Electronic word-of-mouth (a) volume elasticities and (b) valence elasticities estimated with community-based sites are greater than those estimated with blogs, which in turn are greater than those estimated with online product review sites.
Data and Methodology
To create our database, we conducted a thorough search for studies that report eWOM volume and valence elasticity estimates directly, or for which we could calculate elas-ticities from regression coefficients using appropriate trans-formations (for details, see Theme 4 in the Web Appendix). The search procedure we adopted was as follows. First, we conducted an issue-by-issue search of relevant publications from major journals in marketing, management, and infor-mation systems that typically publish studies pertaining to WOM (specifically, Journal of Marketing, Journal of Mar-keting Research, Marketing Science, Management Science,
Journal of the Academy of Marketing Science, Information Systems Research, Decision Support Systems, MIS Quar-terly, Electronic Commerce Research and Applications,
Journal of Interactive Marketing, Journal of Retailing,
International Journal of Research in Marketing, Journal of Advertising, Journal of Advertising Research, and Marketing Letters). Second, we used keyword searches (e.g., “electronic WOM,” “online WOM,” “social media,” “online reviews”) in several electronic databases such as ABI/ INFORM, Busi-ness Source Premier, Science Direct, and Google Scholar to identify articles that were pertinent to our study. Third, we searched the Web for working papers (e.g., Social Science Citation Index, Social Science Research Network, Marketing Science Institute, key authors’ webpages). Fourth, we con-ducted a search for dissertations in ProQuest Dissertation and Theses database. Fifth, we reviewed the reference lists in all of the previously obtained articles. Finally, we contacted key authors in this field to request unpublished or working papers. We included articles in the database using two criteria. First, consistent with the scope of previous meta-analyses of marketing instruments (e.g., Assmus, Farley, and Lehmann 1984; Bijmolt, Van Heerde, and Pieters 2005; Sethuraman, Tellis, and Briesch 2011), we restricted our analysis to the elasticities estimated from econometric mod-els. Thus, we exclude studies using experimental and judg-mental data such as purchase intention or preferences. Sec-ond, we only considered studies in which elasticities are unambiguously reported or derivable from the estimated coefficients in the regression. Specifically, among a total of 339 (271) volume (valence) elasticities, 265 (73) are reported directly in original studies and 74 (198) are deriv-able from the estimated coefficients in the regression at the
variable means. We transformed coefficients into elasticities using the formulas based on Gemmill, Costa-Font, and McGuire (2007) (see Theme 4 in the Web Appendix). How-ever, when we could not calculate the elasticities, we made every effort to contact the authors to get the information necessary to do so. Theme 1 in the Web Appendix lists not only the studies included in our analysis but also the eWOM volume and valence measures in each study, the average volume and valence elasticities for each of these articles, and whether the elasticities were given or had to be obtained through a transformation.
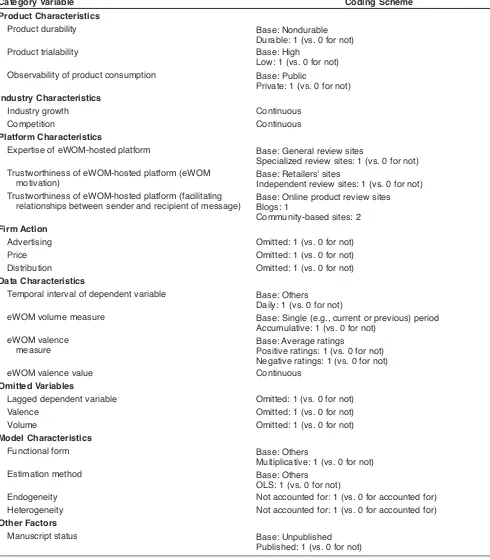
Using our screening criteria, we identified 51 empirical studies, providing 340 eWOM volume elasticities and 271 eWOM valence elasticities. We dropped one eWOM vol-ume elasticity from the data set after conducting outlier analysis.4Thus, our final research database consists of 339 eWOM volume elasticities and 271 valence elasticities reported in 51 studies. The number of studies included com-pares favorably with several other meta-analyses of differ-ent elemdiffer-ents of marketing mix, such as Assmus, Farley, and Lehmann (1984; 16 studies of advertising elasticity) and Tellis (1988; 42 studies of price elasticity). The minimum and maximum number of eWOM volume (valence) elas-ticities reported in a study is 1 (1) and 46 (36), respectively. Table 2 shows the coding scheme used in our research. Although the coding scheme for variables that are tradition-ally included in meta-analyses is straightforward, we col-lected primary data on several variables that were not avail-able from the source articles themselves. Specifically, the articles did not contain product characteristics, industry characteristics, and platform characteristics, so we manu-ally collected these data for each article or model (in cases of articles with multiple product categories).
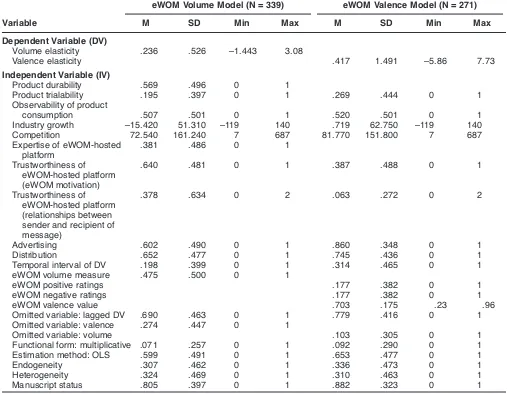
Following the coding method in Chandy and Tellis (2000) and Srinivasan, Lilien, and Rangaswamy (2006), we used two expert coders to independently code the product and platform characteristics identified in our conceptual framework. We used different measures of reliability, such as Cohen’s kappa (= .85 [.9]) and Krippendorff’s alpha (= .85 [.95]), in addition to the intercoder agreement of .92 (.96) for product (platform) characteristics to ensure a high level of consistency between two independent coders; a third researcher resolved the remaining disagreements. For industry characteristics, we used the historical method to collect data on industry growth and number of competitors (for details, see Theme 5 in the Web Appendix). We obtained other, more traditional influencing factors such as firm actions, data characteristics, omitted variables, model characteristics, and manuscript status directly from each of the individual studies. Table 3 shows the summary statistics, and Theme 6 in the Web Appendix provides correlations of key factors in the eWOM volume and valence models.
Estimation Model and Procedure
Our analysis proceeds in two stages. First, we perform uni-variate analyses to obtain estimates of the mean eWOM
volume and valence elasticities. We also analyze the distri-bution of eWOM volume and valence elasticities. Second, we estimate the impact of the aforementioned factors on eWOM volume and valence elasticities. In the context of quantitative meta-analysis, data have a nested or hierarchi-cal structure (i.e., subjects nested within studies; Denson
and Seltzer 2011), making traditional regression analyses such as ordinary least squares (OLS) inappropriate because nested data structures may lead to heteroskedasticity in the errors (Krasnikov and Jayachandran 2008). Thus, to account for within-study error correlations between eWOM elas-ticities, we perform the meta-analysis with hierarchical linear
Category Variable Coding Scheme
Product Characteristics
Product durability Base: Nondurable
Durable: 1 (vs. 0 for not)
Product trialability Base: High
Low: 1 (vs. 0 for not) Observability of product consumption Base: Public
Private: 1 (vs. 0 for not) Industry Characteristics
Industry growth Continuous
Competition Continuous
Platform Characteristics
Expertise of eWOM-hosted platform Base: General review sites
Specialized review sites: 1 (vs. 0 for not) Trustworthiness of eWOM-hosted platform (eWOM
motivation)
Base: Retailers’ sites
Independent review sites: 1 (vs. 0 for not) Trustworthiness of eWOM-hosted platform (facilitating
relationships between sender and recipient of message)
Base: Online product review sites Blogs: 1
Community-based sites: 2 Firm Action
Advertising Omitted: 1 (vs. 0 for not)
Price Omitted: 1 (vs. 0 for not)
Distribution Omitted: 1 (vs. 0 for not)
Data Characteristics
Temporal interval of dependent variable Base: Others
Daily: 1 (vs. 0 for not)
eWOM volume measure Base: Single (e.g., current or previous) period Accumulative: 1 (vs. 0 for not)
eWOM valence measure
Base: Average ratings
Positive ratings: 1 (vs. 0 for not) Negative ratings: 1 (vs. 0 for not)
eWOM valence value Continuous
Omitted Variables
Lagged dependent variable Omitted: 1 (vs. 0 for not)
Valence Omitted: 1 (vs. 0 for not)
Volume Omitted: 1 (vs. 0 for not)
Model Characteristics
Functional form Base: Others
Multiplicative: 1 (vs. 0 for not)
Estimation method Base: Others
OLS: 1 (vs. 0 for not)
Endogeneity Not accounted for: 1 (vs. 0 for accounted for) Heterogeneity Not accounted for: 1 (vs. 0 for accounted for) Other Factors
Manuscript status Base: Unpublished
Published: 1 (vs. 0 for not) TABLE 2
modeling (HLM),5as Bijmolt and Pieters (2001) suggest. Consistent with previous meta-analyses in marketing (e.g., Rubera and Kirca 2012; Troy, Hirunyawipada, and Paswan 2008), we estimate the models using the maximum likelihood estimation method because it produces robust, efficient, and consistent estimates (Hox 2002; Singer and Willet 2003).
The estimated model is as follows: Level 1: Yij= b0j+ bj¥Xij+ eij, and
Level 2: bj= g0+ mj,
where Yij is the ith eWOM volume (or valence) elasticity from study j, b0jis the intercept for the jth study, bj is the parameter estimate of the influencing factors for the jth study, eij is random error associated with ith elasticity in study j, g0 is overall intercept, and mj is the study-level residual error term. The Level 1 equation describes the impact of the contextual, data, and model characteristics previously hypothesized on eWOM volume (or valence) elasticity, which vary at a study level, whereas the Level 2 equation describes the effect of study characteristics on the intercept and slopes in the Level 1 equation.
Robustness Checks
Before estimating an HLM, we conducted several checks to ensure the robustness of this meta-analysis. First, we exam-ined the bivariate correlations among the potential factors in both volume and valence models and found that some correlations were greater than .7, indicating potential collinearity problems (Ofir and Khuri 1986). Specifically, in the valence model, the correlations between product durability and omission of marketing-mix variables were TABLE 3
Summary Statistics of Key Variables
eWOM Volume Model (N = 339) eWOM Valence Model (N = 271)
Variable M SD Min Max M SD Min Max
Dependent Variable (DV)
Volume elasticity .236 .526 –1.443 3.08
Valence elasticity .417 1.491 –5.86 7.73 Independent Variable (IV)
Product durability .569 .496 0 1
Product trialability .195 .397 0 1 .269 .444 0 1
Observability of product consumption .507 .501 0 1 .520 .501 0 1
Industry growth –15.420 51.310 –119 140 .719 62.750 –119 140
Competition 72.540 161.240 7 687 81.770 151.800 7 687
Expertise of eWOM-hosted .381 .486 0 1
platform Trustworthiness of .640 .481 0 1 .387 .488 0 1
eWOM-hosted platform (eWOM motivation) Trustworthiness of .378 .634 0 2 .063 .272 0 2
eWOM-hosted platform (relationships between sender and recipient of message) Advertising .602 .490 0 1 .860 .348 0 1
Distribution .652 .477 0 1 .745 .436 0 1
Temporal interval of DV .198 .399 0 1 .314 .465 0 1
eWOM volume measure .475 .500 0 1
eWOM positive ratings .177 .382 0 1
eWOM negative ratings .177 .382 0 1
eWOM valence value .703 .175 .23 .96
Omitted variable: lagged DV .690 .463 0 1 .779 .416 0 1
Omitted variable: valence .274 .447 0 1
Omitted variable: volume .103 .305 0 1
Functional form: multiplicative .071 .257 0 1 .092 .290 0 1
Estimation method: OLS .599 .491 0 1 .653 .477 0 1
Endogeneity .307 .462 0 1 .336 .473 0 1
Heterogeneity .324 .469 0 1 .310 .463 0 1
Manuscript status .805 .397 0 1 .882 .323 0 1
5We estimate the intraclass correlation coefficients (r
very high (ranging from .5 for omission of advertising to .8 for omission of distribution), leading us to exclude the dura-bility variable. In addition, because the correlation between eWOM platform expertise and trustworthiness (eWOM motivation) was more than .8 in the valence model and the expertise of eWOM platform variable was not significant, we excluded it from further analyses. Furthermore, the omit-price variable had correlations greater than .7 with other variables in the volume and valence models and was insignificant in both models; thus, we also excluded it in the final models.
Second, we considered various plausible interaction effects among product characteristics, industry characteris-tics, platform characterischaracteris-tics, and eWOM metrics in both volume and valence models. However, due to strong multi-collinearity caused by adding certain interaction effects, we could only retain interactions between eWOM valence mea-sures and product or industry characteristics in the final valence model; we had to drop all interaction terms from the volume model. Furthermore, we applied the residual centering procedure (e.g., De Jong, De Ruyter, and Wetzels 2005; Hennig-Thurau, Houston, and Heitjans 2009; Lance 1988) to rule out any remaining collinearity potentially caused by adding interaction terms in the valence model. An inspection of the final models’ variance inflation factors (4.5 in the volume model and 3.8 in the valence model) indicates that multicollinearity is not a problem in our analyses.6
Third, we applied several methods to check the stability of our results in the final volume and valence models. Only 10 (3) of 171 (171) correlations between key factors in the volume (valence) model were greater than .5, and no corre-lation was greater than .7. We performed sensitivity analy-ses by omitting each of the factors with at least one correla-tion greater than .5, one at a time, as proposed in previous meta-analyses (e.g., Bijmolt, Van Heerde, and Pieters 2005). Doing so did not change our findings. Moreover, we randomly sampled observations from each data set and esti-mated multiple volume and valence models. The coefficient estimates were stable in all cases in both volume and valence models.7
Fourth, we performed a residual analysis of errors to determine whether the assumptions of HLM are satisfied (Hox 2002; Singer and Willett 2003). The residual plot did not show significant violations.8In summary, our extensive robustness checks rule out multicollinearity and ensure the stability of our model and results.
Results and Discussion
Univariate Analysis of eWOM Elasticity
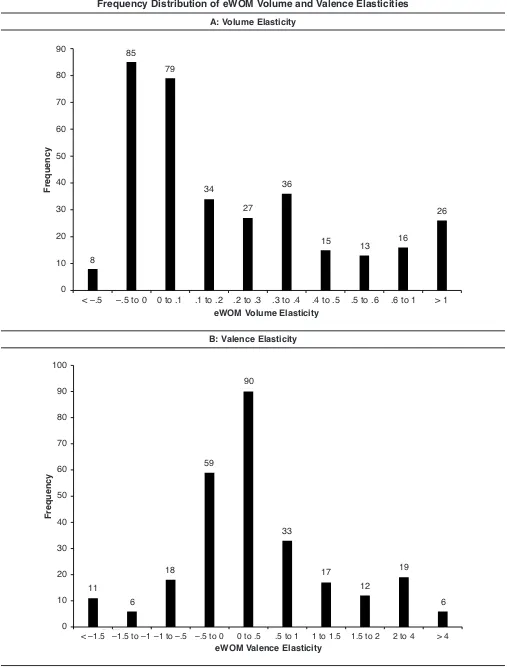
In Figure 2, Panels A and B, we present the frequency dis-tributions of the eWOM volume and valence elasticity
esti-mates, respectively. There are 339 (271) eWOM volume (valence) elasticities with magnitudes ranging from –1.44 (–5.86) to 3.08 (7.73). The overall mean eWOM volume and valence elasticities in our meta-analysis are .236 (Mdn = .096, SD = .526) and .417 (Mdn = .147, SD = 1.491). There were 15 (25) studies reporting negative volume (valence) elasticities, and these results were usually derived from studies conducted in the context of experiential products (books, music, or movies). In the existing eWOM literature, online consumer reviews can influence product sales through awareness effects of volume, persuasive effects of valence, or both (Duan, Gu, and Whinston 2008; Liu 2006). As the results show, the mean of eWOM valence elasticities is much higher than that of eWOM volume elasticities, which highlights the importance of persuasiveness com-pared with the informative role of eWOM in changing con-sumer behavior and market outcomes. Furthermore, as shown in Figure 2, Panels A and B, the distribution of valence elasticities seems closer to normal, whereas the dis-tribution of volume elasticities seems bimodal. Using the HLM model, we analyze the effect of various factors that may drive this observation.
Effects of Influencing Factors
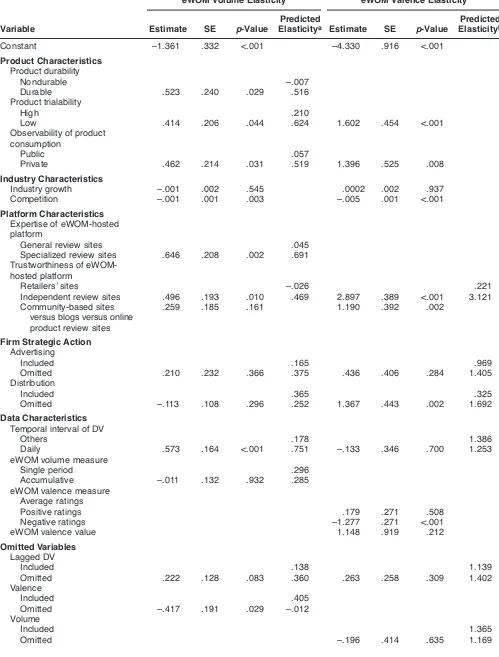
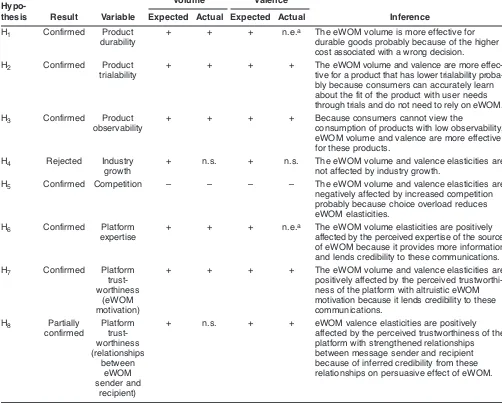
Effects of contextual factors. Table 4 presents the results of the HLM regression for the meta-analysis. We used two fit statistics to verify model fit: (1) Akaike information cri-terion (AIC) statistics and (2) deviance (–2 log-likelihood ratio). The final volume model (model with factors: deviance = 312, AIC = 357) has a better fit than the null volume model (intercept-only model: deviance = 372, AIC = 379), as does the valence model (model with factors: deviance = 796, AIC = 856; intercept-only model: deviance = 978, AIC = 984). Consistent with H1a, we find that eWOM volume elasticities (b = .523, p < .05) are greater for durables than for nondurables. We also find that both eWOM volume and valence elasticities (respectively, b = .414, p< .05; b= 1.602, p< .001) are greater for products with low trialability than for those with high trialability, which confirms H2aand H2b. In addition, our results show that for private (vs. public) goods, eWOM volume elas-ticities (b = .462, p < .05) are higher, as are the valence elasticities (b= 1.396, p< .01). This finding provides sup-port for H3aand H3b.
Regarding the influence of industry characteristics on eWOM effect, we find that the industry growth has no impact on eWOM volume and valence elasticities, which is con-trary to H4aand H4b. However, the results indicate that both eWOM volume and valence elasticities (respectively, b = –.001, p< .01; b= –.005, p< .001) are lower with a greater level of competition, in line with the effects hypothesized in H5aand H5b. Thus, our findings show that information over-load, which can be driven by increase in product choices, reduces eWOM elasticity.
With respect to the effect of platform characteristics, we find that eWOM volume elasticities are greater by .646 (p< .01) when estimated with reviews on specialized review sites than when estimated with reviews on general review sites, in support of H6a. Moreover, consistent with H7aand 6We thank an anonymous reviewer for leading us to conduct
this process.
< –.5 8
85
79
34
27
36
15
13 16
26
–.5 to 0 0 to .1 .1 to .2 .2 to .3 .3 to .4 .4 to .5 .5 to .6 .6 to 1 > 1 90
80
70
60
50
40
30
20
10
0
eWOM Volume Elasticity
F
re
q
u
e
n
c
y
FIGURE 2
Frequency Distribution of eWOM Volume and Valence Elasticities
A: Volume Elasticity
B: Valence Elasticity
< –1.5
11
6
18
59
90
33
17
12
19
6
–1.5 to –1 –1 to –.5 –.5 to 0 0 to .5 .5 to 1 1 to 1.5 1.5 to 2 2 to 4 > 4 100
90
80
70
60
50
40
30
20
10
0
eWOM Valence Elasticity
F
re
q
u
e
n
c
TABLE 4
Estimation Results of HLM
eWOM Volume Elasticity eWOM Valence Elasticity
Predicted Predicted Variable Estimate SE p-Value Elasticitya Estimate SE p-Value Elasticityb
Constant –1.361 .332 <.001 –4.330 .916 <.001 Product Characteristics
Product durability
Nondurable –.007 Durable .523 .240 .029 .516 Product trialability
High .210
Low .414 .206 .044 .624 1.602 .454 <.001 Observability of product
consumption
Public .057
Private .462 .214 .031 .519 1.396 .525 .008 Industry Characteristics
Industry growth –.001 .002 .545 .0002 .002 .937 Competition –.001 .001 .003 –.005 .001 <.001
Platform Characteristics Expertise of eWOM-hosted platform
General review sites .045 Specialized review sites .646 .208 .002 .691 Trustworthiness of
eWOM-hosted platform
Retailers’ sites –.026 .221 Independent review sites .496 .193 .010 .469 2.897 .389 <.001 3.121 Community-based sites .259 .185 .161 1.190 .392 .002
versus blogs versus online product review sites
Firm Strategic Action Advertising
Included .165 .969 Omitted .210 .232 .366 .375 .436 .406 .284 1.405 Distribution
Included .365 .325 Omitted –.113 .108 .296 .252 1.367 .443 .002 1.692
Data Characteristics Temporal interval of DV
Others .178 1.386 Daily .573 .164 <.001 .751 –.133 .346 .700 1.253 eWOM volume measure
Single period .296 Accumulative –.011 .132 .932 .285 eWOM valence measure
Average ratings
Positive ratings .179 .271 .508 Negative ratings –1.277 .271 <.001 eWOM valence value 1.148 .919 .212
Omitted Variables Lagged DV
Included .138 1.139 Omitted .222 .128 .083 .360 .263 .258 .309 1.402 Valence
Included .405 Omitted –.417 .191 .029 –.012 Volume
H7b, we find that both eWOM volume and valence elas-ticities (respectively, b= .496, p< .05; b= 2.897, p< .001) estimated with reviews on independent review sites are greater than those estimated with reviews on retailers’ sites. Furthermore, only valence elasticities are greater for plat-forms with strengthened consumer relationships (b= 1.19, p < .01), in support of H8b; volume elasticities are insensitive to different platform categories, whether they are community-based sites, blogs, or online product review sites. This implies that the relationships between message sender and recipient influence the persuasive effect, rather than the awareness effect, of eWOM. In contrast, the awareness effect prevails when products are expensive and complex (i.e., durables) or when reviewer expertise is accounted for (i.e., on specialized review sites).
Effects of other factors. In terms of firm strategic actions, counterintuitively, we do not find any effects on either volume or valence elasticity estimates from the omis-sion of marketing-mix variables, with the exception of (omission of) distribution on the valence elasticity (positive
and significant; b= 1.367, p< .01). We attribute these find-ings to the nature of the products studied. A large majority of the product categories are associated with uniformly heavy advertising (e.g., cell phones, movies, consumer electronics) and pricing (movies), which may drive this result.
Among data characteristics, our results indicate that the temporal interval of the dependent variable affects eWOM volume elasticities but not valence elasticities. Specifically, eWOM volume elasticity estimates increase by .573 (p < .001) when estimated with daily rather than weekly or monthly sales data. This is intuitively appealing because several forms of eWOM have a relatively short life cycle, and consumers are more likely to be influenced by what is “trending” than by the qualitative aspects of the conversa-tion (valence).
Notably, the measure of eWOM volume—that is, whether it is cumulative or single period—does not have any effect on volume elasticity estimates. A potential reason for this finding is that eWOM generates a strong carryover TABLE 4
Continued
eWOM Volume Elasticity eWOM Valence Elasticity
Predicted Predicted Variable Estimate SE p-Value Elasticitya Estimate SE p-Value Elasticityb
Model Characteristics Function form
Others .315 1.504 Multiplicative –.335 .284 .237 –.020 –1.735 .657 .008 –.231 Estimation method
Others .390 1.098 OLS –.165 .148 .264 .225 .377 .305 .216 1.475 Endogeneity
Accounted for .257 1.076 Not accounted for .111 .113 .326 .368 –.688 .225 .002 .388 Heterogeneity
Accounted for .207 1.096 Not accounted for .259 .163 .112 .466 .800 .276 .004 1.896 Other Factors
Manuscript status
Unpublished .051 .843 Published .298 .232 .199 .349 .568 .391 .146 1.411 Interaction Effects
Product trialability ¥ –1.772 .681 .009 .693 Positive ratings
Observability of consumption ¥ –.907 .654 .166 .192 Positive ratings
Industry growth ¥ .013 .004 <.001 Positive ratings
Competition ¥Positive ratings .011 .007 .119
Product trialability ¥ –3.412 .681 <.001 –2.456 Negative ratings
Observability of consumption ¥ –.963 .654 .141 –2.957 Negative ratings
Industry growth ¥ .021 .004 <.001 Negative ratings
Competition ¥Negative ratings .026 .007 <.001 aCalculation of predicted elasticities is adapted from Bijmolt, Van Heerde, and Pieters (2005; Table 2).
effect (e.g., Liu 2006; Trusov, Bucklin, and Pauwels 2009), which may negate the recency effect on consumer decision making. The contrast between the impact of aggregation of dependent and independent variables on eWOM elasticities is striking.
Furthermore, we find that models using negative ratings in place of mean ratings are associated with much lower valence elasticities (b = –1.277, p < .001). This notable finding may indicate risk aversion by consumers, who react more negatively to bad product reviews. This in turn leads to lower elasticities, an effect that would be masked when using mean ratings.
Our results also show that volume elasticities are posi-tively affected when a lagged dependent variable is omitted but negatively affected when valence information is excluded in the volume models (b= .222, p< .1; b= –.417,
p < .05, respectively). Thus, the inclusion of a lagged dependent variable in eWOM volume models seems neces-sary to avoid a positive bias, and the inclusion of valence as an explanatory variable is associated with an improvement in volume elasticity estimates. In contrast, the omission of a lagged dependent variable or volume information does not affect estimates of valence elasticities.
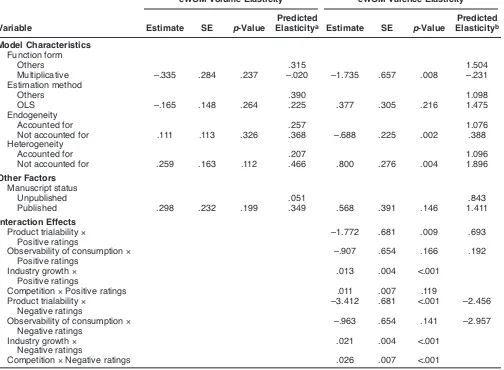
With regard to the model characteristics, in general we find that the valence models are more sensitive to issues such as functional form, endogeneity, and heterogeneity adjustment than are volume models. Indeed, we find that volume models are not affected by functional form (multi-plicative or others), estimation method (OLS or others), or whether endogeneity or heterogeneity is explicitly accounted for. Valence models, in contrast, tend to produce lower elas-ticities when estimated with multiplicative models (b = –1.735, p< .01) or when endogeneity is not accounted for (b= –.688, p< .01), but they produce greater elasticities (b= .8, p < .01) when estimated with models without hetero-geneity concerns. We find no publication biases in either eWOM volume or valence elasticity estimates.
Finally, we find several notable interaction effects to be significant. Our results show that positive/negative ratings are more impactful in high-growth industries and less impactful for low-trialability products. We find positive interactions between industry growth and both positive and negative ratings (respectively, b= .013, p< .001; b= .021,
p< .001) and between competition and negative ratings (b= .026, p < .001). However, we find negative interactions between product trialability and positive and negative rat-ings (respectively, b = –1.772, p < .01; b = –3.412, p < .001). Thus, polarized ratings are more impactful in turbu-lent industries either because they attract consumers from the long tail, especially in online contexts (Brynjolfsson, Hu, and Simester 2011), or because in such conditions, all publicity is good publicity. As indicated previously, most of the studies that find negative elasticities are in the context of the book and movie industries, providing credence to the idea that poor ratings can result in sales, especially because the marginal cost of these products is low. Finally, we find that consumers discount polarized eWOM ratings for prod-ucts that cannot be tried before consumption. Next, we dis-cuss the various implications of these findings.
Implications and Future Research
Discussion
Table 5 provides an overview of our key results. By includ-ing separately collected product, industry, and eWOM plat-form variables in addition to the standard variables used in meta-analysis and then modeling them separately on eWOM volume and valence elasticities, we not only iden-tify important factors driving eWOM elasticities but also arrive at a rich set of academic and managerial implications.
Academic contributions. From an academic perspective, our research makes contributions to both theoretical and empirical approaches used to analyze eWOM effectiveness. From a theoretical perspective, our contributions are three-fold. First, we provide a generalized impact of eWOM vol-ume and valence on sales after accounting for a large num-ber of contextual, empirical, and strategic factors. By doing so, we synthesize extant research on eWOM elasticity and also provide a comparison between elasticities of eWOM and other marketing-mix variables (shown in Table 6).
Second, our analysis resolves existing conflicts in this literature on the effectiveness of eWOM valence and vol-ume metrics by identifying product, industry, and platform characteristics that can influence eWOM elasticity. Specifi-cally, and as noted previously, several studies have found either a very small effect or a notable lack of impact of valence on sales (e.g., Duan, Gu, and Whinston 2008; Liu 2006). Our model results demonstrate that valence elas-ticities will be lower for high-trialability, publicly con-sumed goods that are rated on retailer sites; they will also be lower when negative ratings are used as an explanatory variable. In addition, valence elasticities are much more sensitive to model and data characteristics, as noted previ-ously. By showing that the effect of eWOM metrics on sales is contingent on product, industry, and platform characteris-tics, we highlight a more nuanced explanation for observed heterogeneity in eWOM elasticity. Future research (which we discuss in detail subsequently) should expand on the various contingencies that might affect the relationship between these two factors.
Third, we use a cost–benefit of information search argu-ment to develop our hypotheses, thereby providing greater insights into when eWOM volume and valence metrics affect sales. This, combined with our technique of modeling eWOM volume and valence separately, also overturns several find-ings from the previous meta-analysis (Floyd et al. 2014). Specifically, and in contrast to previous findings, we demon-strate that (1) product durability, trialability, and observabil-ity can each affect elasticities; (2) increased competition lowers volume and valence elasticities; (3) the impact of platform variables is asymmetric between eWOM volume and valence elasticities; and (4) the inclusion of negative ratings (vs. average ratings) drastically affects valence mod-els, as do model form, endogeneity, and heterogeneity.