THIS REPORT CONTAINS ASSESSMENTS OF COMMODITY AND TRADE ISSUES MADE BY USDA STAFF AND NOT NECESSARILY STATEMENTS OF OFFICIAL U.S. GOVERNMENT POLICY
Date: GAIN Report Number:
Approved By:
Prepared By:
Report Highlights:
Post forecasts that South Africa will export about 2.0 million tons of corn in the 2017/18 MY, drawing on a relatively large carry-over stock from the 2016/17 MY. In the 2016/17 MY, South Africa
produced a record 17.5 million tons of corn and exports are expected to reach about 2.5 million tons. On the other hand, due to the drought in the Western Cape Province, the major wheat producing area in South Africa, wheat imports are expected to almost double in the 2017/18 MY to 1.9 million tons. In the 2016/17 MY, South Africa imported 1.0 million tons of wheat and wheat products.
Post:
Pretoria
Dirk Esterhuizen Kyle Bonsu
The supply and demand for wheat and corn in South Africa
Grain and Feed Update
South Africa - Republic of
Executive Summary
According to the Crop Estimate Committee (CEC) farmers planted 491,600 hectares of wheat in the 2017/18 MY, which is only three percent lower than the 508,365 hectares planted in the 2016/17 MY. However, due to extreme drought in the Western Cape Province, wheat production is expected to drop by 13 percent to 1.7 million tons. Two-thirds or 326,000 hectares of South Africa’s wheat area was planted in the Western Cape Province. As a result, post estimates that South Africa’s wheat and wheat products imports will almost double in the 2017/18 MY to 1.9 million tons.
Lower local corn price levels has been putting downward pressure on the area to be planted with corn in 2017, for the 2017/18 MY1, after a record corn crop of 17.5 million tons was recorded in the 2016/17 MY. Hence, post forecasts that around 2.4 million commercial hectares of corn will be planted in 2017, which is nine percent less than the area planted in the 2016/17 MY. Under normal climatic conditions
and taking into account the subsistence farming sector, South Africa’s corn crop for the 2017/18 MY
could reach 12.0 million tons.
Post estimates South Africa will export about 2.5 million tons of corn in the 2016/17 MY. An
oversupplied regional market after a favorable agricultural season and a weak global market for white
corn limits South Africa’s export opportunities, which will leave a relatively large carry-over stock, especially in white corn, for the 2017/18 MY. As a result, post estimates that South Africa will export 2.0 million tons of corn in the 2017/18 MY.
US$1 = Rand 14.20 (10/26/17)
[1]
The marketing years (MY) used in the text refers to the USDA marketing years in the PS&D table, and do not necessarily correspond with the marketing years used by the South African grain industry.
Production
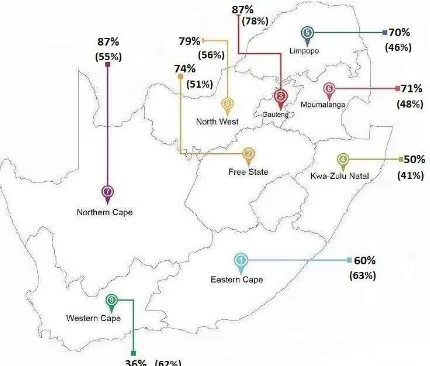
The CEC released its third forecast for wheat production in South Africa on October 26, 2017. According to the CEC, farmers planted 491,600 hectares of wheat in the 2017/18 MY, which is only three percent lower than the 508,365 hectares planted in the 2016/17 MY. However, due to extreme drought in the Western Cape Province, total wheat production in South Africa is expected to drop by 13 percent to 1.7 millon tons. Two-thirds or 326,000 hectares of South Africa’s wheat area was planted in the Western Cape Province. Wheat production in the Western Cape Province is expected to drop by 32 percent, from 1.1 million tons the previous season to 749,800 tons in the 2017/18 MY. Figure 1
indicates the average dam levels for the different provinces in South Africa. In the Western Cape Province average dam levels are currently only 36 percent of capacity, compared to 62 percent in the previous year. Conditions are not expected to improve in the short-term since the Western Cape Province falls in a winter rainfall area with only limited rain occuring during the summer season (September to March).
Figure 1: South Africa’s average dam levels: week ending 16 October 2017 (last year’s figures in brackets)
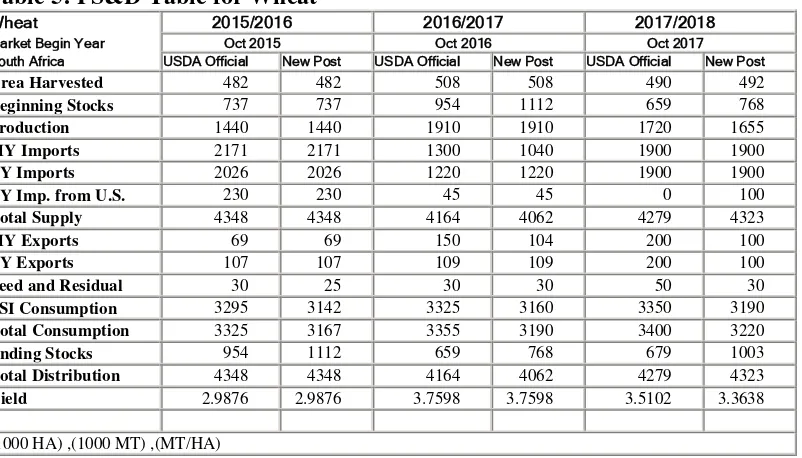
The following table indicates the area planted and production figures of wheat in South Africa for the 2015/16 MY (actual), 2016/17 MY (actual) and 2017/18 MY (estimate).
Table 1: Area planted and production of wheat in South Africa
MY Area
(hectares)
Yield (tons/ha)
Production (1,000 tons)
2015/16 (actual) 482,150 3.0 1,440
2016/17 (actual) 508,365 3.8 1,910
2017/18 (estimate) 491,600 3.4 1,655
Source: The Crop Estimates Committee (CEC)
Consumption
Annual wheat consumption in South Africa has increased on average by only about one percent per annum the past five years, mainly due to slow economic growth and the availability of cheaper alternatives like corn and rice. Corn, the staple food for many South Africans, also showed price inelasticity after retail prices almost doubled over the past two years, due to the drought, but the per
capita demand stayed constant. With the prices of corn products decreasing after last year’s drought,
post does not foresee major shifts in wheat consumption in the 2017/18 MY. Hence, wheat demand in the 2017/18 MY is expected to reach 3.22 million tons (also refer to Table 2). The South African Grain Information Services (Sagis) finalized domestic wheat consumption for the 2016/17 MY at 3.19 million
tons, in line with post’s previous estimate of 3.20 million tons and marginally higher than the 3.17
million tons consumed in the 2015/16 MY.
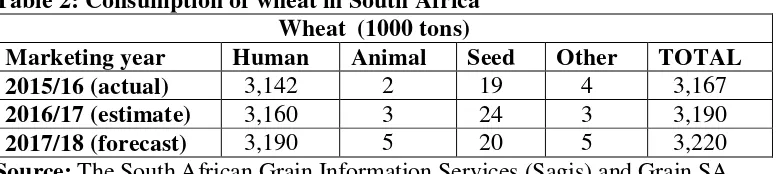
In Table 2, the consumption of wheat in South Africa is illustrated for the 2015/16 MY (actual), 2016/17 MY (estimate) and 2017/18 MY (forecast).
Table 2: Consumption of wheat in South Africa Wheat (1000 tons)
Marketing year Human Animal Seed Other TOTAL
2015/16 (actual) 3,142 2 19 4 3,167
2016/17 (estimate) 3,160 3 24 3 3,190
2017/18 (forecast) 3,190 5 20 5 3,220
Source: The South African Grain Information Services (Sagis) and Grain SA
Trade
Post forecasts that South Africa’s wheat and wheat products imports will almost double in the 2017/18
MY to 1.9 million tons, mainly due to a projected 13 percent decrease in local production as the result of the drought in the Western Cape Province.
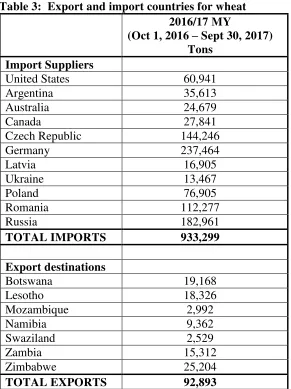
countries in the EU. This duty-free allowance was effective from February 1, 2017 to October 31, 2017, hence the strong imports of wheat from EU countries in the 2016/17 MY. The United States exported 60,941 tons of wheat to South Africa in the 2016/17 MY.
In the 2016/17 MY, South Africa’s exports of wheat and wheat products increased by 50 percent to 104,000 tons to neighboring countries due to the increase in production. South Africa’s wheat and wheat products exports are expected stay at the level of 100,000 tons in the 2017/18 MY.
Table 3: Export and import countries for wheat
Source: Sagis
Notes: These figures reflect wheat grain. Trade figures in the PS&D table include the trade in wheat flour and other wheat products like uncooked pasta and couscous.
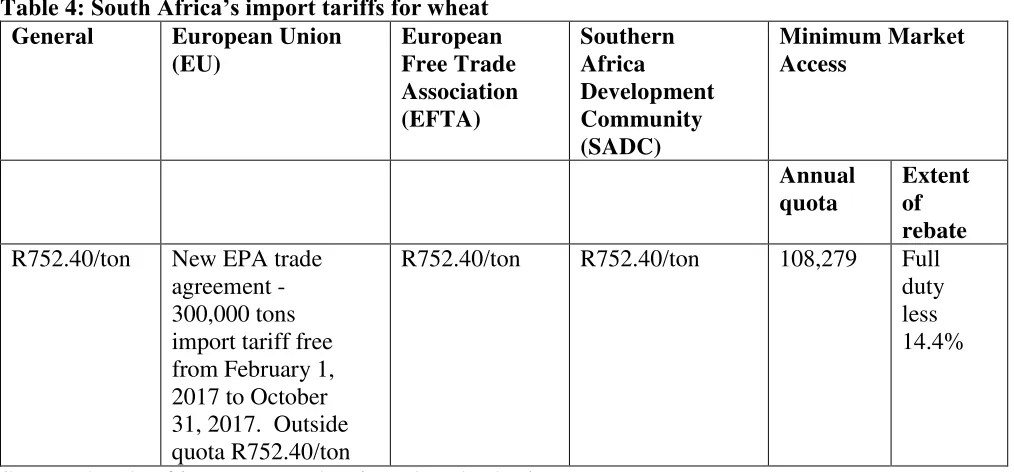
The current effective import tariff for wheat imports into South Africa is R752.40 per ton (US$53/ton). This tariff was announced on September 29, 2017 and is an increase of 98 percent from the previous tariff of R379.34 per ton that went into effect on September 8, 2017. The wheat tariff is calculated based on a variable formula designed to ensure that changes in the international market are constantly
accommodated. The formula is based on a reference price which is the 5-year average price of United
2016/17 MY
(Oct 1, 2016 – Sept 30, 2017) Tons
Import Suppliers
United States 60,941
Argentina 35,613
Australia 24,679
Canada 27,841
Czech Republic 144,246
Germany 237,464
Latvia 16,905
Ukraine 13,467
Poland 76,905
Romania 112,277
Russia 182,961
TOTAL IMPORTS 933,299
Export destinations
Botswana 19,168
Lesotho 18,326
Mozambique 2,992
Namibia 9,362
Swaziland 2,529
Zambia 15,312
Zimbabwe 25,204
States Hard Red Wheat No 2, plus adjustments for distortion factors (subsidies) in the global wheat market and subtraction of the average freight costs to South African shores. The reference price was set by the International Trade Administration Commission of South Africa (ITAC) at US$279 per ton in June 2017. The wheat tariff is then determined by calculating the difference between the 3-week moving average of the United States Hard Red Wheat No 2 and the reference price. If the difference is more than $10 for three consecutive weeks, the tariff is triggered. The import tariff is then calculated according to the difference between the two dollar prices.
An annual quota of 108,279 tons of wheat was also announced last year that could enter South Africa at a rebate of 14.4 percent on the full duty (see also Table 4).
Table 4: South Africa’s import tariffs for wheat
General European Union
(EU)
R752.40/ton New EPA trade agreement -
R752.40/ton R752.40/ton 108,279 Full duty less 14.4%
Source: South African Revenue Services (SARS), Sagis
Prices
Local wheat prices moved closer to import parity levels since April this year due to the drought in the Western Cape Province (see also Figure 2). Table 5 indicates the local wheat prices of October 17, 2017 as traded on the South African Future Exchange (Safex). Currently, wheat prices are trading at around R4,200 per ton (US$295/ton). Local wheat prices are expected to keep on trading close to import parity levels to reflect an expected lower wheat crop in the 2017/18 MY.
Table 5: Local prices for wheat
Futures prices (as of 10/17/2017)
Commodity 2017/10 2017/12 2018/03 2018/05
Figure 2: The trend in the SAFEX price for wheat since January 2016
Table 5: PS&D Table for Wheat
Wheat 2015/2016 2016/2017 2017/2018
Market Begin Year Oct 2015 Oct 2016 Oct 2017
South Africa USDA Official New Post USDA Official New Post USDA Official New Post
Area Harvested 482 482 508 508 490 492
Beginning Stocks 737 737 954 1112 659 768
Production 1440 1440 1910 1910 1720 1655
MY Imports 2171 2171 1300 1040 1900 1900
TY Imports 2026 2026 1220 1220 1900 1900
TY Imp. from U.S. 230 230 45 45 0 100
Total Supply 4348 4348 4164 4062 4279 4323
MY Exports 69 69 150 104 200 100
TY Exports 107 107 109 109 200 100
Feed and Residual 30 25 30 30 50 30
FSI Consumption 3295 3142 3325 3160 3350 3190
Total Consumption 3325 3167 3355 3190 3400 3220
Ending Stocks 954 1112 659 768 679 1003
Total Distribution 4348 4348 4164 4062 4279 4323
Yield 2.9876 2.9876 3.7598 3.7598 3.5102 3.3638
CORN
Production
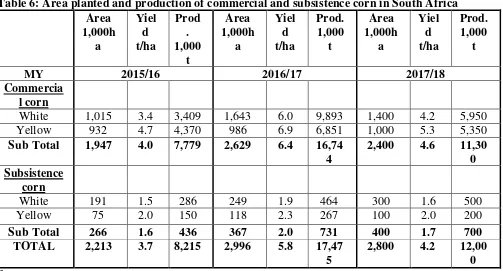
Lower local corn price levels will put downward pressure on the area to be planted with corn for the 2017/18 MY, especially for the white corn area, due to the record white corn crop for the 2016/17 MY. Hence, post forecasts a 15 percent drop, to 1.4 million hectares, in area planted of white corn by
commercial producers in the 2017/18 MY. The expected commercial yellow corn area planted should be at average levels of about 1.0 million hectares. As a result, post forecasts that around 2.4 million commercial hectares of corn will be planted in the 2017/18 MY, which is nine percent less than the area planted in the 2016/17 MY. Under normal climatic conditions and taking into account the subsistence
farming sector, South Africa’s corn crop for the 2017/18 MY could reach 12.0 million tons, which is 32 percent less than the record corn crop of 17.5 million tons produced in the 2016/17 MY (also refer to Table 6).
Post’s forecast on area planted for the 2017/18 MY is in line with theCEC’s “intention to plant survey”
that was released on October 26, 2017. According to the CEC survey, commercial farmers indicated that they will plant 2.5 million hectares of corn in the 2017/18 MY. The intention by commercial farmers is to plant 1.4 million hectares of white corn and 1.1 million hectares of yellow corn.
The CEC released its final production estimate for the 2016/17 MY summer crops on September 28, 2017. The CEC estimated the South African commercial corn crop at a historically high level of 16.7 million tons on 2.6 million hectares. This represents an increase of 115 percent from the 2015/16 MY’s commercial corn crop of 7.8 million tons. A record high commercial white corn crop of 9.9 million tons was produced, almost three times more than in the previous marketing year. The commercial yellow corn crop at 6.9 million tons is 57 percent higher than the previous season.
The CEC also released the final production estimates for the subsistence farming sector’s corn crop.
According to the CEC subsistence farmers planted 366,650 hectares of corn in the 2016/17 MY, 38 percent more than the 266,130 hectares planted in the previous marketing year. Corn production by the subsistence sector was estimated at 731,000 tons, 68 percent higher than the 435,740 tons produced in the 2015/16 MY. This means South Africa’s total corn crop for the 2016/17 MY was estimated at a
record 17.5 million tons on 3.0 million hectares, which is more than double the 2015/16 MY’s drought -reduced corn crop of 8.2 million tons.
Table 6: Area planted and production of commercial and subsistence corn in South Africa
South Africa’s economic growth is expected to continue to be sluggish in the next few years, due to
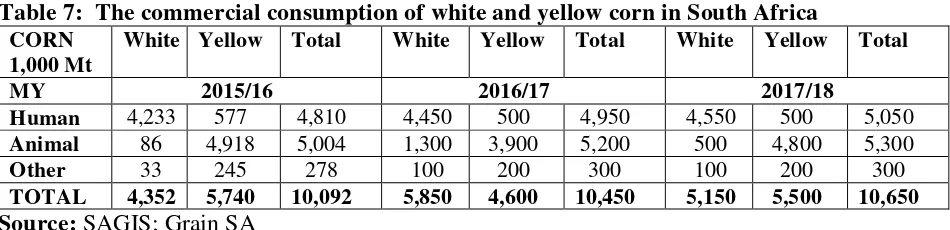
structural and policy constraints, which will likely limit the increase in the demand for animal protein and hence animal feed. As a result, the demand for corn feed is expected to increase marginally to 5.3 million tons in the 2017/18 MY. The human demand for corn, the staple food for many South Africans, especially for the lower to middle income groups, is expected to grow in correlation with population growth to 5.1 million tons. The per capita consumption of corn has stagnated at around 90kg per annum for the past 10 years. Thus, total commercial demand for corn is estimated to reach about 10.7 million tons in the 2017/18 MY (also refer to Table 7).
With higher rainfall that led to a record production year and thus relatively lower corn prices, the commercial demand for corn will increase by four percent to 10.5 million tons in the 2016/17 MY. Post expects that South Africa will use about 5.0 million tons of corn for human consumption and 5.2 million tons of corn for animal feed. Post also estimates that white corn usage for animal feed will increase to about 1.3 million tons as more yellow corn will flow to the export markets.
Table 7: The commercial consumption of white and yellow corn in South Africa CORN
1,000 Mt
White Yellow Total White Yellow Total White Yellow Total
MY 2015/16 2016/17 2017/18
Human 4,233 577 4,810 4,450 500 4,950 4,550 500 5,050
Animal 86 4,918 5,004 1,300 3,900 5,200 500 4,800 5,300
Other 33 245 278 100 200 300 100 200 300
TOTAL 4,352 5,740 10,092 5,850 4,600 10,450 5,150 5,500 10,650
Source: SAGIS; Grain SA
Note:Please note that consumption figures in the PS&D table also include corn utilized by the subsistence farming sector and commercial on-farm usages.
Trade
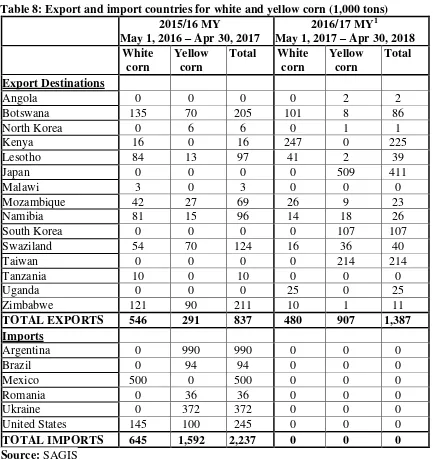
Post estimates that South Africa will export about 2.0 million tons of corn in the 2017/18 MY, drawing on a relatively large carry-over stock from the 2016/17 MY.
After the drought in the 2015/16 MY forced South Africa to import more than 2.2 million tons of corn, South Africa returned to being a net exporter of corn in the 2016/17 MY as a result of the historically high corn crop. In the first 24 weeks of the 2016/17 MY (May 1, 2017 to October 13, 2017), South Africa has already exported nearly 1.4 million tons of corn, which included 479,749 tons of white corn and 906,750 tons of yellow corn (see also Table 8). This means South Africa is on average exporting almost 60,000 tons of corn per week. White corn is mainly exported to Kenya (247,250 tons), as many parts of Kenya have been impacted by drought. The major markets for South Africa’s yellow corn are Japan (509,307 tons), Taiwan (213,926 tons) and South Korea (107,241 tons). However, post estimates South Africa will only export a total of 2.5 million tons of corn in the 2016/17 MY. An oversupplied regional market after a favorable agricultural season and a weak global market for white corn limits
Table 8: Export and import countries for white and yellow corn (1,000 tons)
Export Destinations
Angola 0 0 0 0 2 2
Note:1. Preliminary export and import data from May 1, 2017 to October 13, 2017
Prices
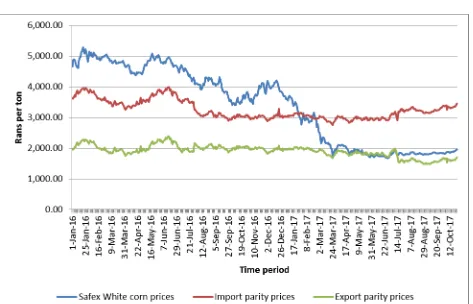
yellow corn and white corn prices are, respectively, 36 percent and 46 percent lower, indicating the
effect of the 2016/17 MY’s bumper crop on local corn prices. With the oversupply of corn in the local market, especially white corn, corn prices are likely to trade at export parity levels for the remainder of the 2016/17 MY.
Table 9: Local prices for corn
Futures prices as of 10/17/2017
Commodity 2017/10 2017/12 2018/03 2018/05 2018/07
White corn R1,876/t ($132/t)
R1,916/t ($135/t)
R1,964/t ($138/t)
R2,009/t ($141/t)
R2,065/t ($145/t) Yellow corn R1,974/t
($139/t)
R2,012/t ($142/t)
R2,055/t ($145/t)
R2,091/t ($142/t)
R2,132/t ($150/t)
Source: Sagis
Figure 4: The trend in yellow corn prices in South Africa since January 2016
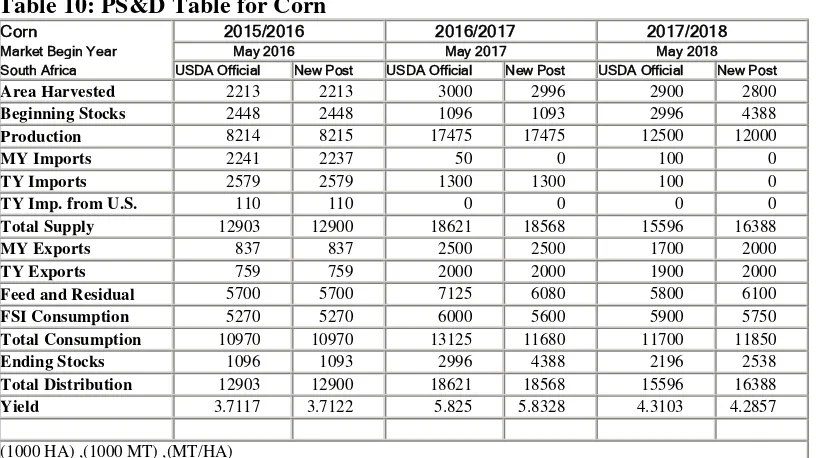
Table 10: PS&D Table for Corn
Corn 2015/2016 2016/2017 2017/2018
Market Begin Year May 2016 May 2017 May 2018
South Africa USDA Official New Post USDA Official New Post USDA Official New Post
Area Harvested 2213 2213 3000 2996 2900 2800
Beginning Stocks 2448 2448 1096 1093 2996 4388
Production 8214 8215 17475 17475 12500 12000
MY Imports 2241 2237 50 0 100 0
TY Imports 2579 2579 1300 1300 100 0
TY Imp. from U.S. 110 110 0 0 0 0
Total Supply 12903 12900 18621 18568 15596 16388
MY Exports 837 837 2500 2500 1700 2000
TY Exports 759 759 2000 2000 1900 2000
Feed and Residual 5700 5700 7125 6080 5800 6100
FSI Consumption 5270 5270 6000 5600 5900 5750
Total Consumption 10970 10970 13125 11680 11700 11850
Ending Stocks 1096 1093 2996 4388 2196 2538
Total Distribution 12903 12900 18621 18568 15596 16388
Yield 3.7117 3.7122 5.825 5.8328 4.3103 4.2857
(1000 HA) ,(1000 MT) ,(MT/HA)