Indo. J. Chem., 2008, 8 (3), 327 - 330
Suharso
327
* Email address : [email protected]
MECHANISM OF BORAX CRYSTALLIZATION USING CONDUCTIVITY METHOD
Suharso
*Department of Chemistry, Faculty of Mathematics and Natural Sciences, University of Lampung Jl. Soemantri Brojonegoro No. 1 Gedung Meneng, Bandar Lampung
Received 19 May 2008; Accepted 9 September 2008
ABSTRACT
The kinetics of crystal growth of borax has been studied by using conductivity method at temperature of 25 C and at various relative supersaturations. It was found that the growth rate increases with increasing supersaturation. At low concentration, growth occurs via a spiral growth mechanism and at high concentration birth and spread is the principal mechanism operating.
Keywords: borax; growth rate; crystallization; conductivity method.
INTRODUCTION
Fundamental studies of borax crystallization are very important for borax industry to improve the quality of product. In borax industry, borax from tincal is produced by a batch process. From this process, borax loss is about 45000 tons per year [1, 2]. One of the fundamental studies to solve this problem is investigation of the effect of concentrations on the growth rate of borax crystal.
The growth kinetics of borax crystal grown in a stirred vessel as a bulk experiment has been studied by Tai and Lin [3]. The crystal growth rates were obtained from desupersaturation curve of the solution. In this experiment, two types of impeller, Stainless-steel and Teflon-coated, were used. They found that the material of impeller did not influence crystal growth kinetic. The mass-transfer and surface-reaction coefficients increased with an increase in crystal size, and the surface reaction coefficient approached a constant when the size of seed crystal above 1,000 m.
Growth rate dispersion of the (010) face of borax crystals in flowing solution has been also studied by Suharso et al. [4]. One year later, Suharso [5] studied a mechanism of borax single crystal using in situ cell optical microscopy method and found that the growth mechanism of the (111) face of borax crystal at temperature of 20 °C is a spiral mechanism below relative supersaturation of 0.49 and a birth and spread mechanism above relative supersaturation of 0.49. Effect of cetyltrimethylammonium bromide CTAB on the growth rate and morphology of borax crystals has been also studied by Suharso et al. [6].
Conductivity measurement is one of the methods to determine the bulk growth rate. It has been used by several researchers. Gunn and Murthy [7] used conductivity measurement to investigate growth rate of barium sulphate, Wang et al. [8] and Priya et al. [9] investigated potassium dihydrogen orthophosphate crystal, Byrappa et al. [10] observed Li3B5O8(OH)2 crystal, as well as Assencia and Mahadevan [11]
observed ammonium dihydrogen orthophosphate crystal. The progression of gibbsite precipitation has also been determined by conductivity measurements [12-19].
This paper studies the mechanism of borax by using conductivity measurement from bulk experiments at temperature of 25 C and at various concentarations. This paper also studied the effect of supersaturations on the bulk growth rates of borax crystal.
EXPERIMENTAL SECTION
Solubility of borax in water
The driving force for crystallization is usually expressed as a supersaturation ratio, defined as [20]:
* A S
A
Where A and A* are the initial and the equilibrium solute concentrations. The solubility of borax in water has been reported by Nies and Hulbert [21] and Sparague [22].
Growth Solution Preparation
The growth solution was dissolved in 200 mL of Milli-Q water by heating up until 60 °C. The solution was covered and heated with stirring until all of the solid borax had dissolved and filtered through a 0.45
m filter membrane. The filtered solutions were placed into glass vessel with covered before used. After the temperature of growth solution was constant at 25 C, seed was added quickly to the solution.
Seed Preparation
Indo. J. Chem., 2008, 8 (3), 327 - 330 concentration as a function of time
This solution was covered and heated with stirring until all of the solid borax had dissolved and filtered through a 0.45 m filter membrane. The solution was cooled down into beaker glass with slowly stirred to hinder sticky crystals on the glass. The solid from this solution was filtered, washed with acetone, and dried at room temperature. The growth rate experiments were performed at 25 °C and at eight different relative supersaturations.
Conductivity Experiments-Bulk Experiments
Conductivity experiments were carried out in glass vessel. The glass vessel has tempering jacket, which was connected to a Grant W14 (Grant Instrument Ltd.) circulating water bath with digital thermometer (Fig. 1). In order to kept constant temperature, temperature of the growth solution was monitored by digital thermometer. The stirring rate was adjusted to 230 rpm. The volume of vessel was 400 mL and the amount of growth solution
Conductivity meter (HI 8733 Hanna Instruments) was used to measure changing conductivity. The experiments were stopped when the conductivity stabilized to a constant value (between one to three hours). The measurement results from conductivity meter were converted into concentration of borax.
RESULT AND DISCUSSION
Determination of Linear Growth Rate
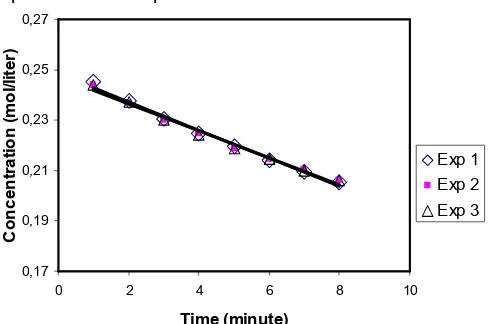
The growth rate of borax seeded precipitation can be determined from the graph of the borax concentrations as a function of time. The growth rate is equal to the slope of the line. Typical of the growth rate of borax seeded precipitation can be seen in Fig. 2. As shown in this figure, correlation coefficients are higher than 98% in all cases. The final growth rates are reported as mol L-1 min-1.
The number of repeated experiments and the calculated mean growth rates of the borax precipitation at different relative supersaturations and at temperatures of 25 °C are given in Table 1.
Effect of Supersaturation on the Growth Rate
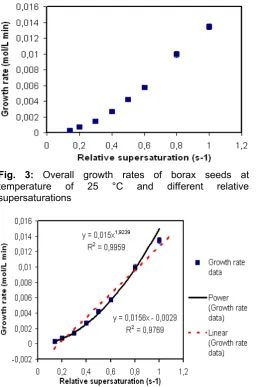
The effect of supersaturation on the bulk growth rate of borax crystal is shown in Fig. 3 and curve fitted can be seen in Fig. 4. From curve fitting calculation, the data fit best to power law model. The bulk growth rate equation as function of relative supersaturation can be written as:
GR = 0.015(s-1)1.92 correlation coefficient = 0.996
The experimental data obtained for the bulk growth rate can also be fitted to linear trend. The bulk growth rate equation as function of relative 25 °C, showing regions of different growth mechanisms
supersaturation on the linear trend may be written as:
Indo. J. Chem., 2008, 8 (3), 327 - 330
Suharso
329
Fig. 3: Overall growth rates of borax seeds at temperature of 25 °C and different relative supersaturations
Fig. 4: Growth rates of borax crystals as a function of supersaturation at temperature of 25 °C: Fitting of linear and power functions
The value of power, n, is calculated to be 1.92. This value is comparable with value reported by Tay and Lin [3], 1.75. If the power law equation is just considered to have equally well, this implies that theat bulk mechanism of borax grows via a spiral mechanism, which is not consistent with two-dimensional nucleation theories. Myerson [23] said that for two-dimensional nucleation theories, the critical size of nuclei is generally proportional with temperature and relative supersaturation. A two-dimensional nucleation will be formed at higher temperature or relative supersaturation with a smaller number of molecules, which provide new sources of steps and increases the rate of nuclei formation. This phenomenon can be explained by Liu, et al. [24] which followed by Lee and Parkinson [25]. This model is used to explain this phenomenon in the bulk growth rate of borax crystals.
Fig. 5: Plot of
5/6)
1
(
ln
s
GR
versus
)
1
(
1
s
If Visser [26] suggested plot of (s-1)ln s versus growth rate to separate different mechanism between spiral growth mechanism at low supersaturations and two-dimensional nucleation at high supersaturations, Liu et al. [24] and followed by Lee and Parkinson [25],
showed that by plotting the
5 6 ln1
GR s
versus
1 1
s , the birth and spread model rate equations,
both for mononuclear and polynuclear model, can be linearised, but not the growth rate equation for the spiral growth mechanism. The same with model proposed by Visser [26], this plot can give two different regions, if there are two different mechanisms. By using this plot, the data of growth rates from experiments are plotted.
Fig. 5 is a plot of ln 5/6 ( 1)
GR s
versus
)
1
(
1
s
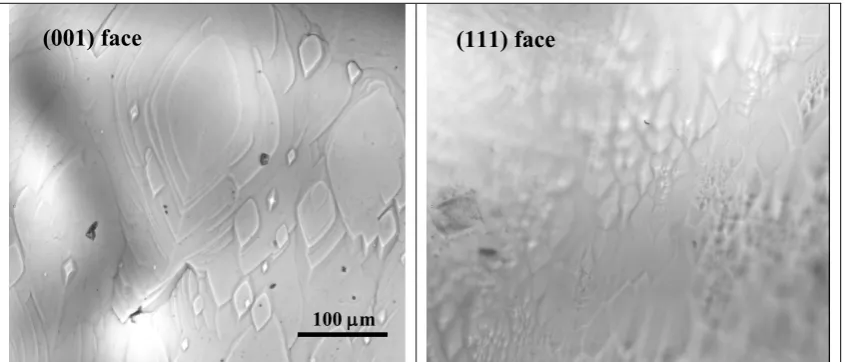
from equation growth rate of birth and spreadmodel, showing linear relationship above a critical relative supersaturation of 0.3. These indicate that above these levels of relative supersaturations, growth occurs by a birth and spread mechanisms. This mechanism is in agreement with visual observation showed in Fig. 6. Below relative supersaturation of 0.3, from the curve of the plot, the spiral growth models suggest the growth mechanisms.
Indo. J. Chem., 2008, 8 (3), 327 - 330
Suharso
330
Fig. 6:Ex situ optical microscopy image of birth and spread observed on the (001) and (111) face at approximately relative supersaturation of 0.75
CONCLUSION
The growth rates of borax crystals from bulk experiments were measured by using conductivity metre at various relative supersaturations. Relative supersaturation ranged from 0.14 to 1.00 at temperature of 25 °C. The effect of relative supersaturation on the bulk growth rate of borax crystal can be described as power law and linear model below:
GR = 0.015(s-1)1.92 correlation coefficient = 0.996 GR = 0.016(s-1) – 0.0029 correlation coefficient = 0.977
The mechanism of growth rate shows spiral growth mechanism at lower relative supersaturaion of 0.3 and polynuclear birth and spread model at higher relative supersaturation of 0.3.
REFERENCES
1. Boncukcuoglu, R., and Kocakerim, M.M., 1999,
Mineral Eng., 10: 1275-1280.
2. Boncukcuoglu, R., Yilmaz, M.T., Kocakerim, M.M., and Tosunoglu, V., 2002, Cement Concrete Res., 32: 35-39.
3. Tai, C.Y. and Lin, C.M., 1994, J. Chin. Inst. Chem. Eng. 25: 383-90.
4. Suharso, Parkinson, G.M., and Ogden, M., 2004,
Indo. J. Chem. 4: 145-148.
5. Suharso, 2005, JMS, 10: 101-106.
6. Suharso, Parkinson, G.M., and Ogden, M., 2007, J. App. Sci., 7: 1390-1396.
7. Gunn, D.J. and Murthy, M.S., 1972, Chem. Eng. Sci., 27: 1293-1313.
8. Wang, S.L., Fu,Y.J., Zhang,W.C., Sun,X., and. Gao, Z.S., 2000, Cryst. Res. Technol., 35: 1027-1034. 9. Priya, M., Padma,C., Freeda,T., Mahadevan, C., and
Balasingh, C. 2001, Bull. Mater.Sci., 24, 511-514. 10. Byrappa, K., Jayanthararaja, V.P., Shekar, K.V.K.
Rajeev, V., Hanumesh, V.J., Kulkarni, A.R., and Kulkarni, A.B.2004, J. Mater. Sci., 32(6): 1599-1602.
11. Assencia, A.A., and Mahadevan, C., 2005, Bull. Mater. Sci., 28(5): 415-418.
12. Nies, N.P., and Hulbert, R.W., 1967, J. Chem. Eng. Data, 12: 303-313.
13. Smith,P. and Woods,G.,1993, Light Metals,113-117. 14. Rossiter, D.S., Ilievski, D. Smith, P.G. and
Parkinson, G.M., 1996, Trans. Inst. Chem. Eng.,
74: 828-834.
15. Seyssiecq, I., Veesler, S. and Boistelle, R. 1996, J. Crystal Growth, 169: 124-128.
16. Cornell, R. M., Pannett, D. S. Sullivan, N. S. Clarke, P. C.and Bailey, C. M. 1999, Proceedings of the 5th International Alumina Quality Workshop
(Bunbury, W.A., Australia), 1: 153-161.
17. Seyssiecq, I., Veesler, S. Boistelle, R. and. Lamérant, J. M 1998, Chem. Eng. Sci., 53: 2177-2185.
18. Lee, M. and Parkinson, G. M. 1999, J. Crystal Growth, 198/199: 270-274.
19. Cornell, R.M., Pannett, D.S. Sullivan, N.S. Clarke, P.C.and Bailey, C.M., 1999, Proceedings of the 5th International Alumina Quality Workshop (Bunbury, W.A., Australia), 1: 153-161.
20. Mullin, J.W., 1993, Crystallization, 3rd Edn., Butterworth-Heinemann Ltd., Oxford.
21. Nies, N.P., and Hulbert, R.W., 1967, J. Chem. Eng. Data, 12: 303-313.
22. Sprague, R.W., 1980, In Mellor’s Comprehensive Treatise on Inorganic and Theoritical Chemistry, London and New York, Longman, 5: 254.
23. Myerson, A.S.E, 1993, Handbook of Industrial Crystallization, Stoneham, Butterworth-Heinemann. 24. Liu, X.Y., Maiwa, K., and Tsukamoto, K., 1997, J.
Chem. Phys., 106: 1870-1879.
25. Lee, M. and Parkinson, G. M., 1999, J. Crystal Growth, 198/199: 270-274.
26. Visser, R.A., 1982, Netherlands Milk and Dairy Journal, 36: 167-193.