ANALYSIS OF FINANCIAL PERFORMANCE IN THE GOVERNMENT OF NORTH SULAWESI
Riska Korompot1, Jessy Warongan2
1
Regional Finance and Asset Management Board, Jl. 17 Agustus No.69, Teling Atas, Wanea, Manado, 95119, Indonesia
2
Accountancy Profession Education, Faculty of Economics and Business, Sam Ratulangi University, Jl. Kampus Bahu, Manado, 95115, Indonesia
e-mail : [email protected]
ABSTRACT
The objective of this research was to determine the financial performance of North Sulawesi Provincial Government and was measured from the Independence Ratio, Effectiveness Ratio, Degree of Fiscal Decentralization Ratio, Harmony Ratio, and Growth Ratio. The results showed that the Independence ratio of North Sulawesi Province in 6 years from 2010-2015 has increased and included in the category of Participatory which means it is quite independent and has reduced the level of dependence on external parties and manage the existing funds such as Domestic Revenue as well as describe that the people of North Sulawesi is quite prosperous because it is able to participate in tax payments which is one of the largest regional income. The Effectiveness Ratio of Domestic Revenue shows effective criteria to the Regional Financial Performance, because based on the effectiveness ratio of Domestic Revenue in 6 years of research only last 2 years namely 2014 and 2015 which include in the category of Not Effective which means decreasing on the performance of local government of North Sulawesi province. The Decentralization Degrees for Government of North Sulawesi Province shows that they still has not fully fulfilled the total revenue with they own-source revenue. The Harmony Ratio represents more realization of operating expenditures than capital expenditures, this is not so good especially for developing regions such as North Sulawesi Province. The Growth Ratio shows an unstable number from 2010 to 2015. The instability is caused by the implementation of money follows functions which are considered not optimal yet, so the work that must be done by some Regional Work Unit at the same time according to expertise and the division is not going well.
Keywords : regional financial performance, APBD
1. INTRODUCTION
government becomes greater. But in fact, it has been twelve years since regional autonomy came into effect, while the financial capacity of some local governments is still heavily dependent on revenues from the central government.
Comparison between the components contained in the budget according to Halim (2004) was measured using several ratios developed based on financial data from the Regional Government Budget (RGB) such as independence ratio, effectiveness ratio, efficiency ratio, PEG (Price/earnings to growth) ratio, and harmony ratio. Based on the background, the issues discussed can be formulated, namely how is the financial performance of the Government of North Sulawesi viewed from Independence ratio, OLGR Effectiveness ratio, Fiscal Decentralization ratio, Harmony ratio and PEG ratio? The purpose of this study is to determine the financial performance of the Government of North Sulawesi seen from the Independence ratio, OLGR Effectiveness ratio, Fiscal Decentralization ratio, Harmony ratio and PEG ratio.
2. LITERATURE REVIEW 2.1. Government Accounting
Halim (2007: 1) states that local financial accounting in Indonesia is one of the areas in public sector accounting that has received great attention from various parties since the reformation of 1998. Government accounting is the technical mechanism and accounting analysis applied to the management of public funds in the state institutions and the ministries below (Mursyidi, 2009: 1).
2.2. Central and Regional Government Accounting 2.2.1 Central Government Accounting
Central Government Accounting System (CGAS/SAAP) is "a series of manual and computerized procedures ranging from data collection, recording, summarizing to reporting on financial position and financial operations of the central government." (Institutional Accounting System Module: p.1).
Central Government Accounting System (CGAS) applies to all central government organizational units and local governments accounting units in the context of implementation of deconcentration or co-administration and financing and calculation budget implementation. (Institutional Accounting System Module: p.4).
2.2.2 Local Government Accounting
The Local Government Accounting System (LGAS/SAPD) can be divided into the following two sub-systems:
1. Accounting system of Local Government Agencies (LGA/SKPD)
a. Local Government Agencies (LGA) is an accounting entity that is obliged to prepare financial statements and submit it to the regional head through RFAO. 2. Accounting system of Regional Financial Administration Officer (RFAO/PPKD)
Accounting system of Regional Financial Administration Officer (AS-RFAO) is divided into two integrated subsystems, namely:
a. AS-RFAO as a budget user (accounting entity) which will produce RFAO financial report consisting of BRR RFAO, RFAO balance sheet, and CaKKK RFAO.
2.3. Budget Concept
Mulyadi (2001:56) states that the budget is a work plan that is expressed quantitatively, measured in monetary units. Mahsun (2013:145) states that the budget is a financial planning for the future that generally covers a period of one year and expressed in monetary units.
2.4 Budget User Accounting System
By definition, the work unit is the power user/budget user of the goods that is part of an organizational unit that carries out one or more activities of a program. Budget Realization Report (BRR/LRA) is a report that is used to display the position of budget realization up to a certain period that has been realized. This BRR reflects the total income and expenditure of the Work Unit (SATKER) after deducting the withdrawal (Permendagri Number 13 of 2006). 2.5 Budget Realization Report
The Budget Realization Report reveals the financial activities of central/local governments that demonstrate compliance with the State Budget/Regional Government Budget. SAP (2010:31) states the Budget Realization Report presents an overview of the sources, allocations and uses of economic resources managed by the central/regional government within a reporting period.
The Budget Realization Report presents at least the following elements: a. Earnings-BRR;
b. State expenditure; c. Transfer;
d. BRR's surplus/deficit; e. Receipts-Financing; f. Expenditures; g. Net Financing;
h. The remaining budget (SiLPA/SiKPA). 2.6 Regional Financial Performance
According to Mohamad Mahsun (2012:25), performance is a description of the level of achievement of the implementation of an activity/program/policy in realizing the goals, objectives, mission and vision of the organization contained in strategic planning of an organization. In relation to the Regional Financial Performance, according to a research conducted by Oesi Agustina (2013:3), in the journal, the Regional Financial Performance is the level of achievement of a work in the area of regional finance which includes revenue and expenditure by using financial indicators established through a policy or statutory provision during a budget period. The performance form is the financial ratios formed from the element of Accountability Report of Regional/District Head in RGB calculation. There are several ways to measure the Regional Financial Performance, and one of them is by using the Regional Financial Performance ratio. Some of the ratios that can be used are: OLGR Effectiveness ratio, Regional Financial Efficiency ratio, Harmony ratio, Growth ratio, and Regional Financial Independence ratio.
a. OLGR Effectiveness Ratio
The OLGR Effectiveness ratio shows the ability of local governments to mobilize OLGR revenue as targeted (Mahmudi 2010:143). The OLGR Effectiveness ratio is calculated by comparing the realization of OLGR revenue with the previously budgeted revenue. Below is the formula of the ratio:
The Criteria of Ratio Effectiveness by Mohammad Mahsun (2012:187), are: 1. If the value is less than 100% (x <100%) it means that it is not effective 2. If the value is equal to 100% (x = 100%) it means balanced effectiveness. 3. If the value is more than 100% (x> 100%) it means that it is effective.
b. Fiscal Decentralization Degree
The decentralization degree is calculated based on the ratio between the amount of original regional revenue to total local revenue. This ratio indicates the contribution of OLGR to total local revenue. The higher the contribution of OLGR, the higher the ability of local governments to implement decentralization. Ratio is formulated as follows:
FDDR = OLGR R x 100% TR
FDDR : Fiscal Decentralization Degree Ratio
OLGR R : Original Local Government Revenue Realization T R : Total Revenue
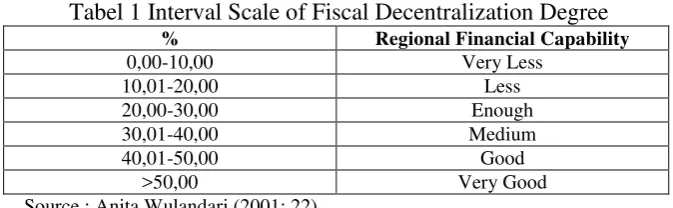
The Fiscal Decentralization Degree is the ability of local governments to increase local revenues to finance development. The degree of Fiscal Decentralization, especially the OLGR component compared to the TPD, according to the results of UGM's Fisipol team research using the interval scale is shown in the table below (Anita W, 2001: 22):
Tabel 1 Interval Scale of Fiscal Decentralization Degree
% Regional Financial Capability
0,00-10,00 Very Less
10,01-20,00 Less
20,00-30,00 Enough
30,01-40,00 Medium
40,01-50,00 Good
>50,00 Very Good
Source : Anita Wulandari (2001: 22)
Harmony illustrates how local governments prioritize their allocation of funds in their routine spending and development expenditures optimally. The higher the percentage of funds allocated for routine expenditure means that the percentage of investment expenditure (Development Expenditure) used to provide economic facilities and infrastructure will tend to be smaller (Halim 2007:236). There are two types of calculations in this Harmony Ratio, namely: Operating Expense Ratio and Capital Expenditure Ratio. Operating expenditure ratio is the ratio between total operational expenditure with total regional expenditure. This ratio informs the reader of the report on the portion of local expenditure allocated for operational expenditure. Operational expenditure are expenditures that for only consumed in one fiscal year, making it short-term and in certain respects routine or recurring. In general, the proportion of Operational Expenditure dominates the total regional expenditure, which is between 60-90%. High-income regional governments tend to have a higher share of operating expenditure than low-income local governments (Mahmudi 2010:164). Operating expense ratio is formulated as follows:
Capital Expenditure Ratio is the ratio between total capital expenditure realization with total regional expenditure. Based on this ratio, the report reader can know the portion of regional expenditure allocated for investment with the form of capital expenditure in the fiscal year concerned. Capital expenditure provides long-term and long-term benefits, which are also routine. In general the proportion of capital expenditures with regional expenditure is between 5-20% (Mahmudi 2010:164). Capital expenditure ratio is formulated as follows:
Capital Expenditure Ratio = Total Capital Expenditure x 100% Total Regional Expenditure
There is no definite benchmark on how much Operational Expenditure Ratio or Capital Expenditure to ideal RGB, because it is influenced by the dynamics of development activities and the amount of investment needed to achieve the targeted growth. However, as a region in developing countries the role of local governments to spur development implementation is still relatively large. Therefore, the relatively small ratio of Capital Expenditure (development) needs to be improved in accordance with regional development needs.
d. Growth Ratio
Growth ratio is useful to know whether the local government in the budget year or during some budget period are having experience growth of income or expenditure positively or negatively (Mahmudi 2010:138). This ratio measures how much the local government's ability to maintain and improve success that has been achieved before from one period to the next. Knowing the growth of each component of the source of income and expenditure, it can be used to evaluate which potentials need more attention (Halim 2007:241). Below is the formula for calculating the Growth ratio:
r = Pn – P0 P0
Information :
R = Growth Ratio
Pn = Total Regional Revenue/OLGR/Capital Expenditure/Operational Expenditure calculated in year n
P0 = Total Regional Revenue/OLGR/Capital Expenditure/Operational Expenditure calculated in year 0 (year before n)
e. Regional Financial Independence Ratio
Regiona Financial Independece Ratio (RFIR/RKKD) indicates the level of ability of a region in self-financing government activities, development and services to people who have paid taxes and levies as a source of income required by the region. The Regional Financial Independence Ratio is indicated by the amount of OLGR compared to the regional revenues originating from other sources (Transfer-Income) namely: Tax-sharing, non-tax revenue sharing of natural resources, general allocation and special allocation funds, emergency funds and loans (Halim 2007:L-5). The formula used to calculate the Independence ratio is:
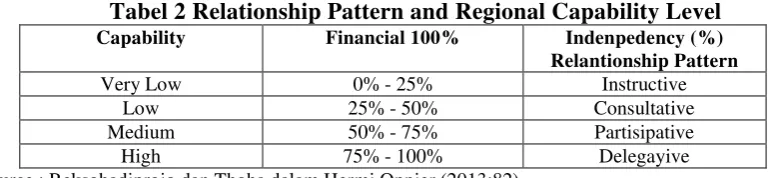
Table presented below is a guide in looking at the pattern of relationships with local capacity (from the financial side):
Tabel 2 Relationship Pattern and Regional Capability Level
Capability Financial 100% Indenpedency (%)
Relantionship Pattern
Very Low 0% - 25% Instructive
Low 25% - 50% Consultative
Medium 50% - 75% Partisipative
High 75% - 100% Delegayive
Source : Reksohadiprojo dan Thoha dalam Hermi Oppier (2013:82)
1) Pattern of instructive relations, which the role of the central government is more dominant than the autonomy of local governments (regions that are unable to implement regional autonomy).
2) Pattern of consultative relations, which central government intervention has begun to decrease as the region is considered slightly more capable of implementing regional autonomy.
3) Pattern of participative relationships, which the role of the central government has begun to decrease, considering the level of independence of the relevant region is close to being able to carry out the affairs of regional autonomy.
4) Pattern of delegative relations, which the interference of the central government is no longer exist because the region has been fully capable and independent in carrying out the affairs of regional autonomy.
3. RESEARCH METHODS
3.1. Types of research
This research is conducted using quantitative descriptive research method, that is by doing calculations to the financial data obtained to solve existing problems in accordance with the purpose of research.
3.2. Place and time of research
The research is conducted at the Office of the Regional Finance and Asset Management Board of North Sulawesi on 17th August street, Manado City, North Sulawesi and the time the study began was in January-May 2017. Objects studied are the Government of North Sulawesi through Local Government Financial Report of 2010-2015 budget year. 3.3. Data collection technique
3.3.1 Types of data
Data is a collection of information needed for decision making, and according to Kuncoro (2009), the types of data are divided as follows:
1. Quantitative data, ie data measured in a numeric scale (number).
2. Qualitative data, ie data that describes the actual condition (which relates to categorization, words characteristics and numbers).
3.3.2 Data sources
The data sources in this research is divided into two sources: 1. Primary data
2. Secondary Data
Secondary data is the supporting and supplementary data collection that is not undertaken alone by the author or research, obtained by researchers indirectly through media intermediaries. Secondary data is generally in the form of evidence, records or historical reports that have been compiled in publicated and unpublished documentary (documentary) files. Source of data used in this research is secondary data. Secondary data required is obtained directly from the Office of Regional Finance and Assets Management Board of Kotamobagu City to get the history of the overview of object under study.
3.6 Analysis Method
The method of data analysis used in this research is descriptive analysis method that is by collecting data, compiling, then interpreting and analysis by recovering the data obtained so as to give complete information about the problems encountered.
4. RESULT AND DISCUSSION
4.1. Research object description
North Sulawesi has a long historical background before becoming a province. In North Sulawesi's governmental history, as in other parts of Indonesia, North Sulawesi has undergone several changes in government administration, along with the dynamics of the administration of the nation. At the beginning of independence of the Republic of Indonesia, this area used to be a resident status which is also part of Sulawesi Province. The capital of Sulawesi Province at that time was Governor DR.G.S.S.J. Ratulangi.
In subsequent developments, an important momentum was recorded in gold ink in this region's history sheet, namely the UU No. 13 Year 1964 in September 23, 1964 establishing the status of the First Level Region of North Sulawesi as an autonomous region of Level I with Manado City as the capital.
The enactment momentum of UU No. 13 Year 1964 was then established as the birthday of North Sulawesi as First Level Region. Since then de facto areas of North Sulawesi extends from north to southwest, from the northern tip of Miangas Island in Sangihe Talaud Regency to Molosipat in the western part of Gorontalo Regency. The second level region that is included in North Sulawesi is; Manado, Gorontalo, Minahasa Regency, Gorontalo Regency, Bolaang Mongondow Regency, and Sangihe Talaud Regency. The first Governor North Sulawesi was F.J. Tumbelaka.
North Sulawesi Provincial Election Commission (KPU) assigned the pair Olly Dondokambey and Steven Kandouw as governor and vice governor of North Sulawesi elected period of 2016-2021 in plenary of governor and deputy governor election result on December 9, 2015.
4.2 Result
4.2.1 OLGR Effectiveness Ratio
Table 3. OLGR effectiveness ratio of North Sulawesi, 2010-2015
YEAR PERCETAGE CATEGORY
2010 107% EFFEKTIVE
2011 104% EFFEKTIVE
2012 106% EFFEKTIVE
2013 103% EFFEKTIVE
2014 104% NOT EFFEKTIVE
The OLGR Effectiveness Ratio represents the ability of local governments to realize the planned OLGR compared to the target set based on the real potential of the region. The higher the OLGR Effectiveness Ratio, the better the performance of local government.
Based on the table above, it can be seen that the highest percentage value is in 2010 that is equal to 107%, it means that in 2010 sector/public institutions in North Sulawesi performed well, so all the plans really happened. In 2011-2013, the OLGR effective ratio of North Sulawesi fluctuated by 3 basis points, decreased by 104% in 2011. Then in 2012, it increased of 2 basis points to 106% and in 2013 it decreased again by 3 basis points to 103%. There was a decline in 2011-2013. This decrease is still considered good because it is still above 100%. Different thing happened in 2014 where the percentage of OLGR effectiveness drops significantly that is equal to 95%. This is related to the phenomenon that occurred in 2014 that North Sulawesi experienced banjir bandang (flood) disaster, and it affects the performance of the public sector that suffered damage both physical and administration. Similarly, in the previous year, in 2015 the percentage of OLGR in North Sulawesi decreased by 93%, this is due to the long drought in the third quarter of 2015 and Governor's election.
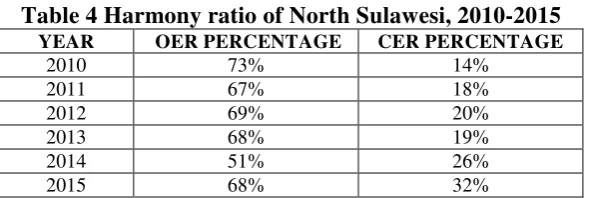
4.2.2 Harmony Ratio
Table 4 Harmony ratio of North Sulawesi, 2010-2015
YEAR OER PERCENTAGE CER PERCENTAGE
2010 73% 14%
2011 67% 18%
2012 69% 20%
2013 68% 19%
2014 51% 26%
2015 68% 32%
4.2.3 Growth Ratio
Table 5 Growth ratio of North Sulawesi, 2010-2015
YEAR OLGR total revenue, operational expenditure and capital expenditure showed an unstable trend or fluctuation that does not show a trend that continues to rise or continue to decline. This is certainly a homework for the North Sulawesi Revenue Service in terms of managing the sources of local revenue, especially taxes. Instability in terms of operating expenditures and capital expenditures is caused the implementation of money follows function or main tasks and functions to adjust to the budget plot that has been set. One solution to this problem is to remain focused on the money follows function. Growth of budget will be maximal if there is already a definite program and budget. The current government will apply the money follows priority pattern. In other words, the Government will prioritize the priority programs, and after that the budget will be set. If there is an activity program that is not included in the government priorities, the less budget will be set for the program.
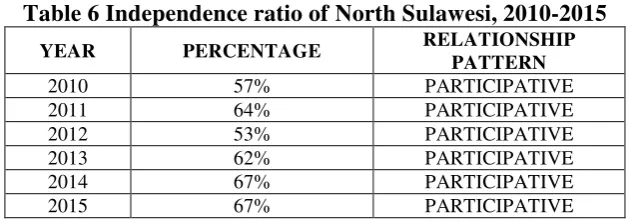
4.2.4 Indepedence Ratio
Table 6 Independence ratio of North Sulawesi, 2010-2015
pattern and still in the pattern of participative/moderative relationships where the role of central government has begun to decrease, considering the level of independence of region concerned is close to able to carry out the affairs of regional autonomy, meaning that the government of North Sulawesi can be categorized as capable to suppress regional dependence on external assistance lower. The opposite means as well as the level of community participation in regional development because the higher the Ratio of Regional Financial Independence, the higher the participation of the community in paying taxes and levies which are the main components of the Original Local Government Revenue. The higher the people pay the tax and levy area, the more it depicts that the level of welfare of the people of North Sulawesi is higher.
4.2.5 Decentralization Degrees Ratio
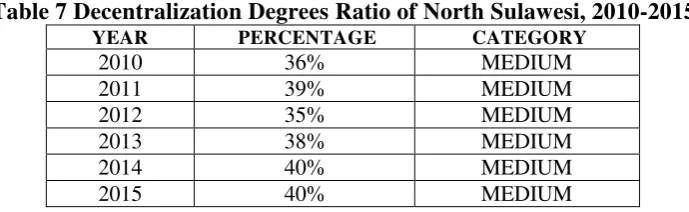
Table 7 Decentralization Degrees Ratio of North Sulawesi, 2010-2015
YEAR PERCENTAGE CATEGORY
2010 36% MEDIUM
2011 39% MEDIUM
2012 35% MEDIUM
2013 38% MEDIUM
2014 40% MEDIUM
2015 40% MEDIUM
From the calculation above it can be seen that from 2010 until 2015 there was no significant development on the Fiscal Decentralization degree of North Sulawesi. Each year shows the medium category. This means that North Sulawesi is still in a moderate condition in terms of placement of the Original Local Government Revenue portion of total regional revenue. It is ideal if the region has been able to allocate 100 percent of OLGR as a financial source in the implementation of development in the area. Currently, the Government of North Sulawesi manages several sources of local revenue such as cigarette taxes, vehicle taxes and vehicle refunds. There are some posts for retribution but tax posts still contribute more to local revenue.
5. CONCLUSION
Based on the results of the performance ratios and descriptions in this study, it can be concluded that the financial performance of North Sulawesi is in the middle level category.
1. OLGR Effectiveness Ratio shows effective criteria to the regional financial performance, because based on the effectiveness ratio of OLGR in 6 years of research consisting of year 2010 to 2013 has entered in the category of “Effective”. In 2014 and 2015, North Sulawesi entered the category “Not Effective” because there was a decrease in performance of the government of North Sulawesi. This is caused by the banjir bandang (flood) disaster that hit North Sulawesi in 2014 that caused many physical and administrative losses in the public service sector.
2. Harmonic Ratio shows more realization of operational expenditure than capital expenditure. This is not so good especially for developing area like North Sulawesi. Regions in developing countries should prioritize the development of the infrastructure or physical works that will surely support development.
4. The percentage of Independence ratio of Regional Financial Performance of North Sulawesi from 2010 to 2015 has increased and included in the category of “Participative” which means that North Sulawesi is quite independent and has successfully reduced the level of dependence on the external parties and has successfuly managed the existing funds such as OLGR. It also describes that the people of North Sulawesi are quite prosperous because North Sulawesi is already able to participate well in tax payments, which is one of the largest regional income.
5. The Decentralization degree shows that the Government of North Sulawesi is still cannot fully manage the total income with the OLGR of this region.
REFERENCES
Agustina, Oesi. 2013. Jurnal Analisis Kinerja Pengelolaan Keuangan Daerah dan Tingkat Kemandirian Daerah Di Era Otonomi Daerah: Studi Kasus Kota Malang (Tahun Anggaran 2007-2011). Jurusan Ilmu Ekonomi dan Bisnis, Universitas Brawijaya Halim, Abdul. 2007. Akuntansi Sektor Publik: Pengelolaan Keuangan Daerah. Edisi Ketiga.
Salemba Empat. Jakarta
Halim, Abdul. 2013. Akuntansi Keuangan Daerah. Edisi Keempat. Salemba Empat. Jakarta. Kuncoro, Mudrajat. 2009. Metode Riset untuk Bisnis dan Ekonomi. Edisi 3. Erlangga.
Jakarta.
Mahsun, Mohamad. 2013. Pengukuran Kinerja Sektor Publik. Edisi Pertama. BPFE Yogyakarta. Yogyakarta
Mahmudi. (2010). Analisis Laporan Keuangan Pemerintah Daerah Edisi Dua. Yogyakarta : UPP STIM YKPN.
Mulyadi.2001. Sistem Perancangan dan Pengendalian Manajemen. Salemba Empat. Jakarta Mursyidi. 2009. Akuntansi Pemerintahan di Indonesia. PT. Refika Aditama. Bandung.
Republik Indonesia. 2006. Peraturan Menteri Dalam Negeri Nomor 13 Tahun 2006 Tentang Pedoman Pengelolaan Keuangan Daerah.Jakarta.
Republik Indonesia. 2010. Peraturan Pemerintah Nomor 71 Tahun 2010 Tentang Standar Akuntansi Pemerintahan. Jakarta.
Rondonuwu, Giftovel. 2016. Analisis Kinerja Keuangan Pemerintah Provinsi Sulawesi Utara Tahun Anggaran 2009-2014. Thesis Program Magister Manajemen Universitas Sam Ratulangi Manado.