94
Longterm Performance Trends Analysis and
ManagingExpectation for Active Value
1(Case Study: PT Indocement Tunggal Prakarsa, Tbk
)
Perdana Wahyu Santosa
YARSI University and CAPITAL PRICE2
Jl. Letjen. Suprapto, CempakaPutih, Jakarta 10510, Indonesia Ph. +628128969319, Email: [email protected]
ABSTRACT
This research used financial ratio and managing expectations for active value about performance of PT IndocementTunggal Prakarsa, Tbk (INTP) as one of largest cement company with a strong brand image at Indonesia Stock Exchange (IDX). Unlike traditional corporate-performance metric, this study use growth value of matrix. INTP is well placed to meet Indonesia’s growing per capita of cement consumption. The financial data sources for this research are the audited annual reports of INTP2002-2008. The analysis focused on compounds annual growth rate (CAGR), profitability, total assets turnover, cost of capital, market value added & market risk and market perception map. This research also used growth value matrix to analysis the market perception of INTP in 2008 that combined current performance with future growth opportunity. The result of market perception mapping for 2008-2009 shows that INTP was just on market average of current performance index but the future growth opportunity was above the market average level. The conclusion explains that INTP has very good long-term fundamental performance’s trend and the company is indicated has strong capabilityto be excellent value manager in the future.
Keywords: Indocement, value matrix, current performance, growth opportunity, market perception.
INTRODUCTION
To get the optimal return from stockinvest-ment in the capital market like Indonesia Stock Exchange (hereafter, IDX), investors and invest-ment manager sneeddeeper analysis of company performance bythe correct method. At this time, most of stock analysis is published in research reporting by some big securities companies that onlyif havethe research division. Thiscondition, often create conflict of interest between the motivation securities company with investors, because the research findings that published have any motivation and special target. Research and/or analysis of the securitiestend to recommend executing buy, selling or holding to stock in the short term in accordance with its importance. Beside, most of research corncerning informational market only focus on some stocks which tend to the interesting ofeach securities company strategy.
_________________________________
1 Earlier version of this paper has been presented on
Inter-national Seminar and Conference at Faculty of Economics Jakarta State University, November 9th-10th, 2010, in Jakarta. 2 CAPITAL PRICE is research center for Capital Market, Portfolio
Investment, Corporate Finance and Economics in Jakarta.
To solve these assymetric information problems for the investors who have no ability to analyzeevery stock that they wanted, we conducted research for long-range trend of fundamental performance. Beside, we exploited all the aspects of
market perception withgrowth value matrix3
This research are conducted independently, to avoid the conflict of interest and usedmany financial analysis that recognized widely that created bysome analyst from McKinsey (Ludwig, Ringbeck & Schulte-Bockum, 2000) as known
(hereafter, GVM) for PT Indocement Tunggal
Prakarsa Tbk (INTP) also. The fundamental findings of INTP are very important values to help investors make any investment decisions and predict the future of INTP’s stock well. The market perceptionof INTP is information fusion from various fundamental factors and technical aspects in capital market that recorded in the form of
market capitalization (such as stock size). Market
Perception is expected become a strategic guidance investment forinvestor’s decision.
3Growth value matrix (GVM) is a managing expectation method
GVM. The other researcher, like Charitou et al. (2001) have a notion that earning performance, growth and market capitalization are factors that have an effect on stockreturn. In other hand, the analysis of fundamental performance on a long term that applicable to measure the consistency the growth of profitability, asset, cost of capital and future growth opportunity from INTP’s management (Sembel et al. 2009).
The INTP long-range performance analysis, around 5 year, the comphrehensive factors of company’s fundamental (emiten) can give some most important information especially, the trend of critical ratio. Beside, the another puposes of this study are give ability to investors to short-range return estimate from capital gain and deviden also for 1-2 years forward. The most important finance factors that must be analyzedare annual average growth (as known: compound annual growth rate, hereafter CAGR) sales, operating profit, net income, total equity and total assets (Santosa & Ertanto, 2009). Despitefully, profitability factor and capital structure of INTP may have very important indicators also, for investment manager to know the findings of this analysis about the trend of efficiency, productivity, asset turnover, leverage and cost of capital of INTP.
Important factor was how we can combine short-range performance by profitability with long-range growth expectation?. The increasing of market capitalization of INTP that was formedby present performances with expectation inthe future that make up market perception. The market perception of INTP depend on equity market performance company that entangle financial statement performance in the form of book and market value, especially. Whereas market capitalization INTP are influenced by its movement of the stock price as well as,stock outstanding.
The movement of INTP stock price were influenced by some fundamental factors, and determined by market perception on company also. Market Perception is based on current
perfor-mance analysis (current performance, hereafter
CP) and opportunity to grows in the future (future
growth opportunity, here after FGO) that will reflect the investor expectation to the future of INTP based on the market value added that make investors satisfied about the return performance, shortly. Stocks with very goodfinancial perfor-mance usually show the consistence in its growth especially sales, operating profit, net income, totalequity and total assets. Generally,always have
good market perception that called asexcellent
value manager. The market perception willgive positive image to thestockandwas collectedby
investment manager or investor until experience overvalued. However, if a stock gets negative market perception that its price will decrease under its the fair valuetoo far until experience of undervalued.
Problems identification related to consistency and stability of fundamental performance in the long-range and the the future growth expectationof INTP is focused onnecessary consideration for its stock at IDX. Financialanalysis and market perception in order to research objectivesare:
1. Long-range Analysis of fundamental
perfor-mance as track record ofINTP’s perforperfor-mance covers Compound Annual Growth Rate(CAGR) that related to 5 key fundamental company: Sales, Operating Profit, Net income, Total Assets and Total Equity.
2. Company’sprofitability analysis becomes
deter-minant of investment decision that cover Return on Equity (ROE), Return on Assets (ROA) and Total Assets Turnover (TAT). Long-range profitability of INTP reflects effectivity and efficiency of company management.
3. Long-term analysis of Cost of Capital, Return of
Invested Capital (ROIC) and Economic Value Added (EVA) of INTP are fundamental factors that considered by investors.
4. Analysis of Market Value Added (MVA) and
Market Risk (beta) and other factors related to equity market performance stock INTP.
5. Market perception constructed by 2 important
factors that are a. current performance and b).
future growth opprtunity with GVM method (Ludwig et al., 2000).
METHODOLOGY
Growth Value Expectation
A higher market capitalization is now an important corporate objective, both or drive perception of economic success and to help companies achieve their strategic goals. As a
metric for corporate performance, market
capitalization reflects both current performance
and future expectation (Ludwig et al., 2000). Growth of market capitalization is lionized because it can improve perception of company economy successfulness and it help company in achieving the objectives of its strategic also. As one of primary size long-range company performance, market capitalization is assessed to reflect financial performance at this time (current performance) and growth expectation in the future.
current performance and 2). residual value as the value of growth expectation. That is, develop long-range growth expectation are assumed more relevant for active management value. In the case of management of market capitalization growth and active management value, a large part of emitens in IDX have not yet conducted it systematically currently.
The fundamental performance measurement traditionally, like price-to-earnings ratio, market-to-book-ratio, and market value added are assessed have not yet reflected the information of growth expectation for the management and investor explicitly. As consequence, a large part of emitens that rely on approach value management tends to overrule opportunity growth expectation also management ability in risk management that faced in long-term survival (Ludwig et al., 2000).
To analyzeboth current performance and growth expectation used a kind of matrix to conduct stocks mapping inthe market perception matrix. Matrix is referred as a means of strategic diagnostic to explicitly reflect their importance. Primary assessment from GVM is ability the management in creating active value. Until diagnostic tool is “managing expectation for value”.
The GVM measure also elements overall performance (like PBV), profitability and corporate growth base on index of industry average or market. In other hand, GVM applicable to compare one stock with other easily, especially with their competitors. Aboddy& Liu (2002) found that traditional fundamental performance measure-ment becomes irrelevant especially at emerging market like IDX. Nevertheless, if measurement technique can be linked to profitability short-range with growth expectation in long-range, then analysis of company's financial performance becomes more comprehensive and significant. Bhusan (1989) explains that previous diagnostic technique for fundamental performance measure-ment is instructed became two important dimensions that were between its long-range analysis in the past and growth prospect in 5 years forwards.
GVM as a diagnostic tool that combine profi-tability (in short-run) with growth expectation (in long-run) base on all stocks, relatively. A growth value map is a diagnostic tool that can be used to assess strategic urgency and to point out the most promising strategic levers for creating value (Ludwig at al. 2000). Why the investors need this GVM method?. Traditional fundamental perfor-mance tools such as PER, MBV, MVA etcdon’t reflect the importance growth of expectation. As a result, investors often pursue value management
approach that neglect opportunities for growth or long-term survival.
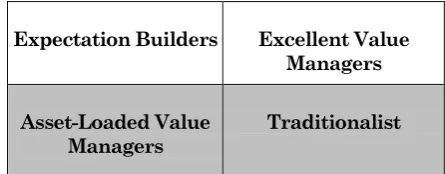
The financial performance is measured in accordance with index of current performance and index ofgrowth expectation, so it's can be grouped become four main cluster (Figure1), depending on the relative position of companies to a performance
benchmark such as the Eurostoxx 50, they will fall
into one of the four clusters:
Excellent Value Manager, the best position relatively that capital market expects excellent value managers to surpass their benchmarks in profitability and growth expectation. A broad spectrum of industries surpassed the bench-mark.
Expectation Builder, this position is not good enough where emiten has underperform profitability (CP) that because under average industry or competitors. Nevertheless, company will have very good future prospect where the growth expectation above the index average. The capital market expects relatively low profit from expectation builder but enormous growth expectations for them.
Expectation Builders Excellent Value Managers
Asset-Loaded Value Managers
Traditionalist
Source: Ludwig et al. (2000)
Figure 1. Growth Value Map
Traditionalist, Capital market shows low expec-tation in opportunity to grow of financial company in the future. However, on the other hand, emiten shows superior financial perfor-mance especially profitability. The traditionalis position depicts weak management aspiration, innovation and/or relationship with investor that createdundervalued of this type of stock.
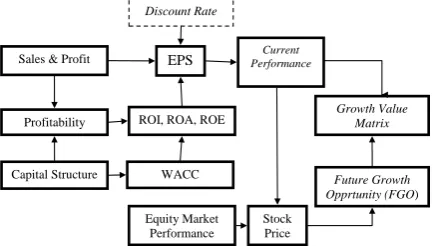
To get comprehensive analysis result that needed research framework related to analyse and measure the active value for management of INTP. Fundamental factors that must analysed in this researh are CAGR of some most important financial indicators like earnings & profit: sales, earnings, operating profit, income and capital structure: asset & equity. Five financial indicator sare referred as form of profitability level and ROIC and cost of capital (Francis and Schipper, 1999).
After net profit is obtained then earnings pershare (EPS) INTP can be calculated and divided by book value in order to got current performance (profitability) at this time. Whereas to calculate future growth opprtunity or growth expectation are needed data of stock price and normalized by book valuetoo.
Figure 2. Framework Methodology
Figure 2 describes that how the GVM is cosntructed by some financial ratios of funda-mental performance such as sales & profit, parofitability, capital structure, leverage, discount rate, market value (stock price), and book value. That figure explain why analyzing framework are developed to give to avoid the financial analysis error consequences of investors’s superior information. Supose that any special information available to the managers today will reach investors within just one quarter.
Sampling
Sampling method that used in this researchis purposive random sampling base on some consi-derations. Sampling process is conducted at random to the emiten of cement industry that listed atIDX at least in 5 the last years. The cement industry are chosen caused this industry 1) is national backbone of infrastructure development; 2) sensitive to change of economy indicators; 3) capital intense industry; 4) form of oligopoly market in control and 5) cement stock is known as liquid stock and become foreign investor wanted.
Design analysis that used in this research is financial statements analysis during period 2002-2008. In this research, used ratio analysis as elementary financial review. Analysis is conducted in comprehensive step like DuPont anaysis and the result are presented in the form of graph or charts from year to year (time series) in order to easy to understand. Research data that used is 1) audited financial company statement PT Indocement Tunggal Prakarsa, Tbk that and agreed and accepted by authority of IDX officially as public disclosure information professionally and respon-sible report. Audited financial statement period that analysed is 2002-2008 period. 2) stock price INTP and 3) discount rate that refers to BI rate.
RESULTS AND DISCUSSION
Compound Annual Growth Rate Analysis
During the 2002-2008, this cement company can improve sales with the average of growth
annualy (Compound Annual Growth Rate-CAGR)
as high as 13.15%. Whereas profitability its specialized operating profit CAGR is 11.25%. Nevertheless CAGR of net income company exactly still negative 1.13%. Annual average Growth (CAGR) of sales and operating profit relatively good and consistence until that prospect of company business good enough in the future. Nevertheless management of INTP faces some problems of production efficiency that must immediately overcome to optimal.
Table 1. Compound Annual Growth Rate INTP 2002-2008
CAGR CAGR
Sales 13.15% Total Equity 12.71%
Operating Profit 11.25% Total Assets -2.67%
Net Income -1.13%
CAGR of capital structure on 2002-2008 period, total assets and total equity each of 12.71% and -2.67%. Equity total growth is overrated compared to total asset under investment balance until identified negative effects relate to existence of problem on leverage and financial risk in the long-range.
Price Movement and the Volatility of INTP Stock Return 2002-2009
The movement of stock priceof INTP positively relate to the fluctuation of macro-economy indicators both national and international. The macroeconomy indicators that effect to price movement of INTP are especially inflation and BI rate becausethe INTP is stock in infrastructure sector and properties sector. This is due a large part of INTP financial activitie srelyoncement consumer that dependon rate of interés like construction credit, credit of house owner ship (mortgage) orapartment and other. The hig her interés level rate then stock price INTP will follo witwithcor relation around 72% even have significant inter dependency.
When level of BI rate reaches its highest, 9.5% on 4Q07, stock price of INTP get anew high in capital market history at Indonesia till IDR9,000,- pershare. Also on the contrary, PDB experiences of decreasing till 4.3% and BI rate downs till 6.5% because the global economy crisis at 3Q08 and 4Q08, make stock price slump till level below IDR3000, that is the lowest price in three last years.
Source: Indonesia Stock Exchange, 2009
Figure 3. Price Movement of INTP 2002-2009
Analysis of stock price movement of INTP can be divided into three framework that are Period 1: January 2002-January 2007; where this period shows the price movement tends to up trend significantly from IDR 800,- became IDR6000,- with high volatility. Period 2: January 2007-Januari 2008, that happened stock price increase very high from IDR6000,- to IDR9000,- pershare, in just around a year and Period 3: January 2008-Januari 2009, describe that since January 2008 to October 31th, 2008, price experienced downtrends up to 77.32%, at the same period, JCI (IHSG) experienced slump by 53,99% as global conse-quence of economy crisis.
Volatility of return in April 2003 averages around 63.07% then decreasing becomes around 34.87% at April 2007. Enter April 2008, return volatility of INTP till 53.22%. This Number is referred as higher compared with IHSG volatility around 37,40%. Market Risk (beta) stockof INTP was 1.14 in 2008.
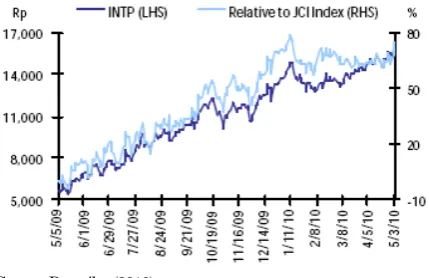
In the medio of 2009, price movement of INTP especially May 2009-May 2010 period was growing and show confidence of investor that reflects from the increasing of price significantly from IDR5200,- to IDR16.350,- pershares on May 4th, 2010. The increasing as high as 214.46% reached just in one year stock trading activity.
Stock of INTP gave very big contribution to maximazing asset/wealth of investors its by improvement of market capitalization, currently. Price movement of INTP relative to IHSG also show pattern in common with IHSG movement, until volatility of advantage level has high covariance with market return.
Source: Pasaribu (2010)
Figure 4. Price Movement of INTP and IHSG May 2009-Mei 2010
Increase stock price significantly is supported by some factors either external or internal like financial statement that excellent on 1Q10 that noted profit growth 56.40% yoy as high as IDR786 billion.
Trendsof Sales& Profit Analysis
Sales of 2008 are noted higher than in 2006 and 2007, although there is economic growth decreasing and weaken that it purchasing power as consequence global finance crisis in US and some west european countries such as UK, German, France, Greek, Spain and others (World Bank, 2010).
Source: Sembel at al. (2009)
Figure 5. Trend of Sales & Profit INTP 2002-2008
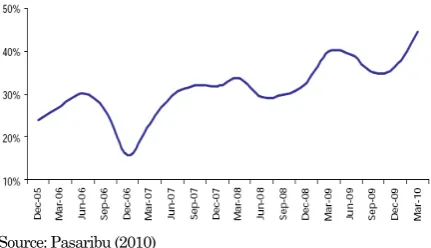
Nevertheless since 2005, net income increasingly with growth 537,53% and continued experience of improvement even estimated experience of increasingly at 2010-2012 (Cashmore, 2010). That is the level of company effectivity in costs management to convert sales becomes net income is predicted in better estmation (Tjandra, 2010). That sales performance was supported by increasing of cement demand as high as 21.4% or around 3 mn tons especially in Java market. EBITDA INTP was noted growth as high as 44,3% just than previous period also and pass the standard upper limit Heildelberg Group that is 33%. Improvement marjin EBITDA’s company is obtained from go down it energy expense as high as 4,8% at Rp. 192.500,- pertonalso (Cashmore, 2010). Thedecreasing cost energy is caused by down trend of energy commodity price because global crisisin US and West Europe and strengthten IDR to USD.
Source: Pasaribu (2010)
Figure 7. EBITDA of INTP December 2005-March 2010 Period
Energy expenses for INTP is significant as cost drivers because that cover around 48% from totalize COGS company (Pasaribu, 2010). Never-theless by start convalesce its global economy, threat of energy price increase will be happened especially at 3Q10 (Figure 7) until margin this highest EBITDA reach peak level for cement producer in Indonesia (Pasaribu, 2010).
Profitability Trend Analysis
During 2002-2007, return on equity (ROE) and return on assets (ROA) company experience of decreasing significantly, from 2002 to 2004 showed very low profitability performance. Enter 2005 to 2008, profitability INTP is better and experiences of significant improvement. Whereas,total assets turnover (TAT) of INTP consistently improvement since 2002 to 2008. Ratio TAT reflects measu-rement of company efficiency level in using its total asset to produce sales. Getting higher of ratio TAT that means the growing efficiencyof company in using its asset (Frykman & Tolleryd, 1999).
Source: Sembel at al. (2009)
Figure 8. ROE, ROA & TAT Trend of INTP 2002-2008
In general,it can be identified that INTP is a distinguished company as national producerof cement that can show good profitability perfor-mance, even predicted will continue improve net income lessens its financial risk. Trend of cement price during period 2004-2009 improve perfor-mance of profitability company, consistently. Onfigure 7, that since 1997 to 2001, INTP never recorded positive net income which are experience of except to loss 1999.
Equity Market Performances
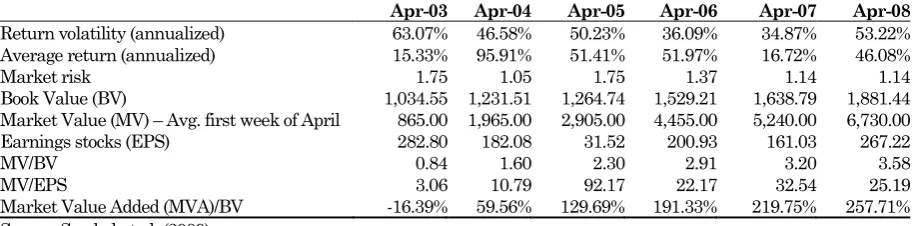
Result of ratio analysis of equity market performance INTP 2003-2008 related to return volatility, average return, market risk, book value, market value, EPS, MV/BV, MV/EPS and MVA/BV in general reports on Tabel 2.
Market Perception Mapping
Analysis of growth value matrix for stock INTP results that till 2008, market expectation to short term company profitability or current performance (CP) that is in average of non-financial market performance. Nevertheless, market expectation to prospect of company business growth or future growth opportunity (FGO) is the overweight (outperform) of average business growth other non financial companies.
Excellent value manager Expectation builder
Source: Sembel at al. (2009)
Figure 9. Market Perception Mapping of INTP 2008
These results of market perception mapping show that INTP have good enough short term profitability performance and outperforming in growth prospect that will promises in the future.
Trend of performance of financial fundamental that better continuosly according to business prospect in cement sector in Indonesia. This finding is very important that an increasingly significant part of active value management involves generating long-term growth expectation. A higher market capitalization is now important for INTP objectives, both to drive perception of economic success and to help company to achieve their strategic goals (Ludwig et al. 2000).
CONCLUSIONS
This study investigate and analysis the financial performance of the individual stock of PT Indocement Tunggal Prakarsa, Tbk, as known a largest cement producer in oligopoly market in Indonesia. In general, the pattern of return volatility of INTP was high enough relate to price movement during 2002-2008 period. The return volatility was higher than market volatility, so we can call that stock of INTP was a high risk asset at IDX. Preliminary analysis of financial performance starts with CAGR that find most of the five key financial factors are positive significantly except net income has negative growth in 2002-2008 period.
Specific analysis in sales and profitability shows that sales increas consistently and reach the highest level. This findings indicate to investors that INTP has good sales track record and high market share (after Semen Gresik). Strong sales volume in 2002-2008 suggests INTP is the risght track and with demand strong, the company was able to implement light price increase especially in the major market of Java has not recovered yet (Barus and Wong, 2010). This condition shall enhance profitability. Strong sales volume means INTP has greater ability to raise selling prices like Semen Gresik, as the market leader, has apparently been able to hike selling price by 3-5%
Table 2. Equity Market Performance of INTP
This table summarized the equity market performance of INTP following from April 2003 to April 2008. The trends of performance is represented by return volatility that describe the fluctuation of stock’s return which measured by standard deviation. The average return was average return quarterly (3 months).
Apr-03 Apr-04 Apr-05 Apr-06 Apr-07 Apr-08
Return volatility (annualized) 63.07% 46.58% 50.23% 36.09% 34.87% 53.22%
Average return (annualized) 15.33% 95.91% 51.41% 51.97% 16.72% 46.08%
Market risk 1.75 1.05 1.75 1.37 1.14 1.14
Book Value (BV) 1,034.55 1,231.51 1,264.74 1,529.21 1,638.79 1,881.44
Market Value (MV) – Avg. first week of April 865.00 1,965.00 2,905.00 4,455.00 5,240.00 6,730.00
Earnings stocks (EPS) 282.80 182.08 31.52 200.93 161.03 267.22
MV/BV 0.84 1.60 2.30 2.91 3.20 3.58
MV/EPS 3.06 10.79 92.17 22.17 32.54 25.19
Market Value Added (MVA)/BV -16.39% 59.56% 129.69% 191.33% 219.75% 257.71%
at the reatail level. INTP, however has used this opportunity to increase selling prices by only 1% (Pasaribu, 2010).
Major market, Java has yet recover. Java accounts for around fifty percent of total domestic demand with remaining balance coming non Java market. Java ranks second in terms of ts growth contribution at 2%, just behind Sumatera’s 3,7%. This is great opportunity for INTP to achieve the company’s goals especially to increase profitability and CAGR of net income.
Capital market finds that INTP position in growth value matrix (GVM) is between expectation builders and excellent value managers, that means investor expect INTP to surpass their benchmark in profitability and growth in the future. The growth expectation of company far outperformed the 82 related to non financial companies. This very good result for capital market. However, the profitability of INTP relatively low in the short term but has enormous growth expectation in the future.
REFERENCES
Aboddy, J. Hughes and J. Liu. 2002. “Measuring Value Relevance in a (possibly) Inefficient
Markets”. Journal of Accounting Research
40 (September): 965-986.
Barus, Felicia & Ferry Wong. 2010. “Indonesia
Property: Robust 2H09 Pre-Sales”. Macquaire
Equity Research. Asia Specialist, Indonesia.
Bhusan R. 1989. “Collection of Information About Publicly Traded Firms: Theory and Evidence”,
Journal of Accounting and Economics 11: 183-206.
Cashmore, Nicholas. 2010. Indocement: Firing di
atas All Cylinders, CLSA-Asia Pacific Market. Indonesia Materials. Jakarta.
Charitou, A., C. Clubb and A. Andreo. 2001. “The Effects of Earnings Performance. Growth, and Firm Size di atas Usefullness of Cash Flows and Earnings in Explaining Security Returms: Empirical Evidence for the UK”,
Journal of Business Finance and Accounting
(June/July): 563-594.
Francis, J and K. Schipper. 1999. “Have Financial
Statements Lost Their Relevance?”. Journal
of Accounting Research (Auntum): 31-52.
Frykman, David & Jakob Tolleryd. 2003. Corporate
Valuation: An Easy Guide to Measuring Value, Prentice-Hall-Financial Times. Besar Britain. UK.
Ludwig, Hiltrud, JurgenRingbeck& Jens Schulte-Bockum. 2000. “Managing Expectation for
Value”. The McKinsey Quarterly. No. 4:
12-14.
World Bank. 2010. Global Economic Prospect: Crisis. Finance and Growth 2010. diunduh in 22 Januaries from http://researchrecap.com
Pasaribu, Chandra, S. 2010. Indocement Tunggal Prakarsa: Strong Domestic Sales. Cement Sector, 1Q10 Results. Equity Research,
Danareksa Securities. Jakarta.
Santosa, Perdana W. and Deddy Ertanto. 2009. Analisis Fundamental PT Indocement Tunggal Prakarsa. Tbk: Penggunaan Aset
Semakin Optimal, Investor Daily. Markets
& Corporate. 7 Decembers. p. 11.
Sembel, Roy, Perdana W. Santosa & Yanthi Hutagaol. 2009. Capital Market Trends 2008/2009: Indonesia Stock Exchange, Research Bundle of Fundamental Analysis,
CAPITAL PRICE. Jakarta.
Tjandra, Stanley. 2010. Cement Sector: The Return