EVALUATION OF FINITE ELEMENT MESH ARRANGEMENTS
AND STRESS INTENSITY FACTOR CALCULATION METHODS
FOR OPENING MODE FRACTURE OF CRACKED-CEMENTED
MATERIALS
Pontjo Utomo
Lecturer, Department of Civil Engineering, Tadulako University, Palu, Indonesia
(Currently Ph.D Student, Department of Civil Engineering, Curtin University of Technology, Perth, Australia) Email: [email protected]
Hamid R. Nikraz
Associate Professor, Department of Civil Engineering, Curtin University of Technology, Perth, Australia
ABSTRACT
Fracture mechanics is a branch of mechanics, which deals with the cracked body. Every construction material that currently in use inevitably is not flawless. The pre-existing crack may grow to cause structure failure due to low stress, which acts to a structure. Stress intensity factor (K) is a single parameter in fracture mechanics, which can be used to examine if a crack, would propagate in a cracked structure under particular loading condition. Finite element method is used to analyze the cracked body to provide the displacements data around the crack tip (at quarter point elements) due to load prescribed, for stress intensity factor determination. Two methods of stress intensity factor calculation, Quarter Point Displacement Technique (QPDT) and Displacement Correlation Technique (DCT), were evaluated. A series of standard fracture testing were undertaken to provide the fracture load data (Pf), which coupled with the stress intensity factor analytical
formula to calculate fracture toughness. The results showed that under a particular mesh arrangement, the result of finite element analysis could deviate from the analytical formula calculation result. The QPDT method is suitable for compact tension specimen but DCT seemed to be not. For cracked beam analysis, the QPDT and DCT calculations were in good agreement with the analytical formula as long as coupled with the appropriate mesh arrangement around the crack tip.
Keywords: finite element, stress intensity factor, fracture toughness, quarter point element, crack, fracture mechanics.
INTRODUCTION
Many accidents in past were caused by the collapse of structures, such as bridges, multi-storey buildings, ships and dams. Failure of structure was not only caused by poor design, but it was eventually found that it was also triggered by material deficiencies in the form of pre-existing flaws which could initiate cracks and fractures. Low stress fractures induced by small cracks are very similar to the brittle fractures of welded low-strength steel structures. This phenomenon has triggered the emergence of engineering fracture mechanics.
In structural design, the conventional design is mainly based on the tensile strength, yield strength and buckling stress, this design will completely fail to work if there is likelihood of cracks in the material used which can cause failure due to crack propa
Note: Discussion is expected before June, 1st 2007, and will be published in the “Civil Engineering Dimension” volume 9, number 2, September 2007.
Received 4 April 2006; revised 6 June 2006; accepted 30 July 2006.
gation. Regarding this, conventional design needs to be combined with engineering fracture mechanics,
which provides a framework to overcome the
inadequacies in the conventional design to deal with
the defect in the material.
The most important parameter in engineering fracture mechanics is stress intensity factor (SIF). It is the single parameter, which controls the stability of the crack. The tendency of a crack to grow is analyzed using stress intensity factor at one cracked body.
technique [1], J-integral [2], fictitious crack model [3], two-parameter fracture model [4], and the energy-based cohesive crack propagation model [5]. Most of these methods are viable tools in dealing with concrete structures. These methods are properly applicable in linear elastic fracture mecha-nics (LEFM) framework, as long as the size of the aggregate is much less than the structures [6].
In this paper, the study is limited to Mode I fracture mode (opening mode) and consists of two targets; the first is to find out the typical finite element mesh arrangement in dealing with opening mode of fracture problem and the second is to compare two techniques; Displacement Correlation Technique (DCT) and Quarter Point Displacement Technique (QPDT), for stress intensity factor calculation based on the data generated from the finite element analysis.
LITERATURE REVIEW
Concept of Stress Intensity Factor (K)
There are three types of fracture mode, which may be encountered in the field, Mode I is opening mode, Mode II is sliding mode and the Mode III is tearing mode (Figure 1).
Figure 1. Typical Modes of Fracture
Figure 2. Stresses Near The Tip of a Crack in an Elastic Material
Stress intensity factor (K) is the quantity that gives the magnitude of elastic stress field. The stress at the crack tip can be expressed as (Figure 2):
( )
known. KI is the stress intensity factor for mode I
fracture mode, subscript I stands for Mode I fracture mode.
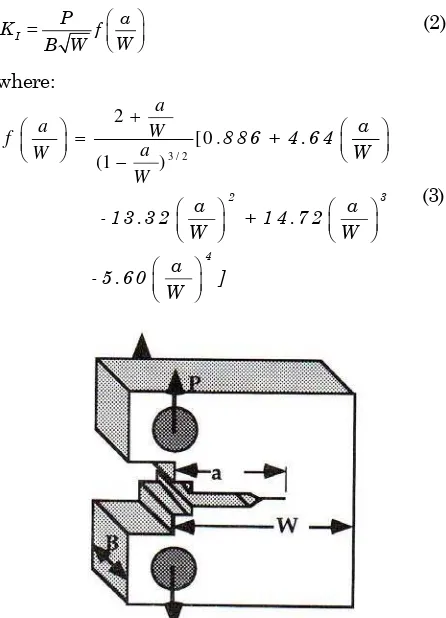
Mode I Stress Intensity Factor (KI) Calculation Formula (CT-Specimen)
According to [7], Mode I stress intensity factor for compact tension specimen (CT-Specimen, Figure 3) is calculated based on the following formula :
⎛ ⎞
Figure 3. Mode I Fracture Testing Specimen Geometry (CT-Specimen) [7]
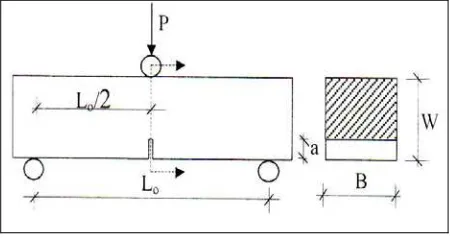
Mode I Stress Intensity Factor (KI) Calculation Formula for three-point bend specimen
The analytical formula [7] for three point bend specimen crack problem (Figure 4) is :
⎛ ⎞
Figure 4. Typical Geometry of Mode I Fracture Testing of Beam Specimen [7]
Crack extension will occur when K reaches a certain
value, which is called as fracture toughness (Kc).
Fracture toughness can be obtained by undertaking the standardized testing under a particular condition of fracture mode.
Quarter Point Element
Modelling the singularity at the crack tip is an essential part in predicting crack propagation using fracture mechanics, but being able to model the singularity is not sufficient, since stress intensity factor is the most important parameter in fracture mechanics to check if the crack propagates, the proper method should be available for this task to be done. Figure 5 illustrates the quadratic isopara-metric element which is used in this study to satisfy the stress singularity at the crack tip for stress intensity factor calculation [8]. Eight-node isopara-metric plane strain elements were chosen with the mid-side nodes of elements surrounding the crack tips moved to the quarter point of each element side, so that a square root singular deformation field at the crack tip could be achieved.
Stress Intensity Factor Calculation Methods
The Displacement Correlation Technique (DCT) [8] uses all four nodes on the crack faces of quarter point element (QPE), as can be seen in Figure 6. The stress intensity factors for Mode I :
(
)
⎡⎣(
) (
)
⎤⎦E/[2(1+ µ)] for plane strain, L=length of quarter point
element and u = quarter point node displacement toward u direction, v = quarter point node displace-ment toward v direction.
Figure 5. Formation of Triangular Crack-Tip Element From 8-Noded Quadratic Quadrilateral Element
The Quarter Point Displacement Technique (QPDT) is slightly different to the Displacement Correlation Technique, the Quarter Point Displacement Tech-nique only uses two adjacent nodes at the crack surface to calculate the stress intensity factors. According to Quarter Point Displacement Technique the stress intensity factors are as follows:
(
)
E/[2(1+ µ)] for plane strain, L=length of quarter point
element, v = quarter point node displacement toward v direction.
RESEARCH METHODOLOGY
Finite Element Analysis
Two types of standardized specimen were analyzed in this present study. Compact tension and three-point bend specimen were used for the analysis of
Mode I stress intensity factors (KI) for obtaining the
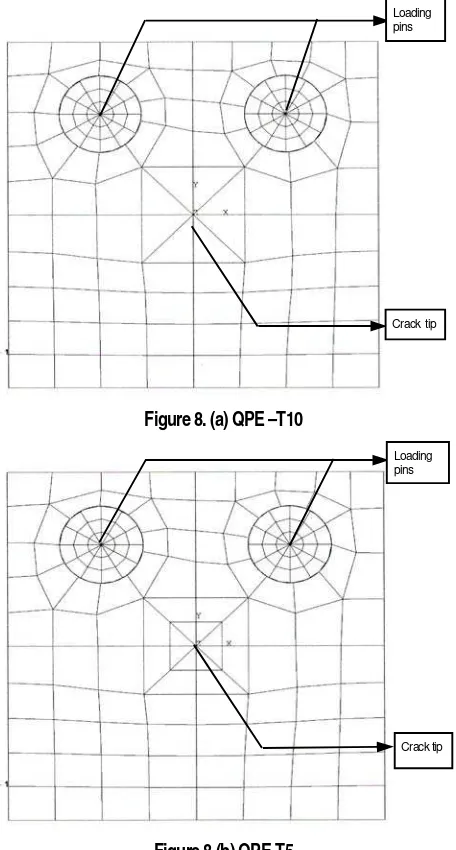
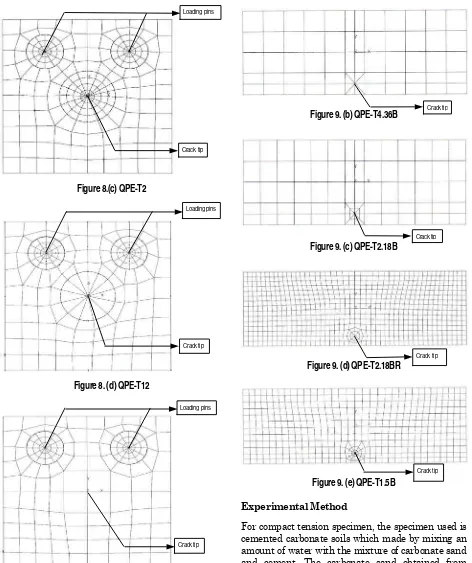
fracture toughness. The Illustration about the positions of quarter point nodes is depicted in Figure 7. The mesh configurations for Mode I stress intensity factors analysis are depicted in Figure 8 and 9. The compact specimen and beam specimen are modeled using plane strain in two dimensional finite element analysis. Figure 8a utilizes triangular quadrilateral elements around the crack tip. Figure 8b describes the usage of triangular quadrilateral elements around the crack tip, it has the same number of elements as Figure 8a, but with the smaller triangle size. The finer mesh is used in Figure 8c around the crack tip while the coarser one is in Figure 8d. Lastly, orthogonal mesh is used with the mid nodes moved to the quarter-point of the element in Figure 8e.
Figure 9a is a finite element mesh arrangement around the crack tip using orthogonal mesh whose mid nodes moved to the quarter point of the element. Figure 9b and Figure 9c are representing the use of triangular elements around the crack tip but with different sizes of quarter point elements. Figure 9d and 9e are explaining the use of triangular elements but have different number of elements around the crack tip.
In the finite element analyses that carried out in this study, the specimen was loaded by a unit load to get the displacements of the quarter point nodes around the crack tip, once these displacements obtained, they will be used for calculating stress intensity factors using either Quarter Point Displacement Technique or Displacement Correlation Technique.
Fracture toughness then calculated by multiplying the value of stress intensity factors with the fracture
loads (Pf), which obtained from the experiment.
Figure 7. Illustration of Quarter Point Nodes in Finite Element Mesh
Figure 8. (a) QPE –T10
Figure 8.(b) QPE-T5
Figure 8.(c) QPE-T2
Figure 8. (d) QPE-T12
Figure 8. (e) QPE-Sq10
Figure 9. (a) QPE –Sq4.36B
Figure 9. (b) QPE-T4.36B
Figure 9. (c) QPE-T2.18B
Figure 9. (d) QPE-T2.18BR
Figure 9. (e) QPE-T1.5B Experimental Method
For compact tension specimen, the specimen used is cemented carbonate soils which made by mixing an amount of water with the mixture of carbonate sand and cement. The carbonate sand obtained from Coogee beach (Western Australia) and as cementing agent, ordinary Portland Cement Type II is used. The degree of cementation in this present study is 50%; the weight of cement is calculated based on the weight of carbonate soil, the mixture that is applied in this research is adopted from [9]. The amount of water that added to all specimens was 20% of total weight of soil and cement. All specimens are cured within 14 days before testing. The specimens types are, compact tension specimens (5 specimens) for
fracture toughness determination (KIC), cylindrical
Loading pins
Crack tip
Crack tip Crack tip
Loading pins Crack tip
Loading pins
Crack tip Crack tip Crack tip
specimens (3 specimens) for Young’s modulus and
Poisson’s ratio test (E and µ) and three point bend
specimens, which adopted from [10].
Fracture testing for opening mode (Mode I) adopted from [11] (Compact Tension Specimen). Figure 10 shows the picture of test specimen which measures 72 x 72 x 36 mm with the pre-crack length of 36 mm from the top to the middle of the specimen. The apparatus that used for fracture testing consisted of two clevises holding two steel pins which slot in the specimen holes as depicted in Figure 11. The load was applied using Wykeham Farrance loading machine to cause tensile force to the crack tip. The load was measured by load cell and an LVDT was used for displacement measurement. All the data from fracture testing were recorded automatically using data logger.
For the purpose of fracture toughness determination, the beam specimen was formed to have dimension of 36.7 mm width, 33.5 mm height, 4.36 mm pre-crack
length and 100 mm span width (Lo) (Figure 12).
Figure 10. Actual Size of the Mode I Fracture Testing of CT-Specimen
Figure 11. Set up of Mode I Fracture Testing of CT-Specimen
Figure 12. Geometry of Beam Specimen Tested [10]
RESULTS AND DISCUSSION
Mode I fracture of CT Specimen
Based on the mode I fracture testing over CT Specimen made of cemented carbonate soil, the
fracture load (Pf) was 500 N for the specimen with
50% cement content. The elastic parameters were obtained from standard test for concrete cylinder, which resulted Young’s Modulus (E) of 28 GPa and Poisson’s ratio (µ) of 0.3.
Figure 13. Typical Failure Pattern of Mode I Fracture Testing (CT-Specimen)
The fracture toughness resulted from analytical
formula (equation 2) is 12 MPa m m , with the
fracture load of Pf = 500 N. It can be seen from Table
Displacement Correlation Technique were obtained by arranging the mesh as in QPE-T2, triangular quarter point element and relatively short quarter point element side (L = 2 mm), in this case, the mode I fracture toughness differences were 2.5% and 5% respectively for Quarter Point Displacement Technique and Displacement Correlation Technique, relative to the analytical solution. The most precise numerical analysis obtained was from rectangular quarter point element, which was calculated using Quarter Point Displacement Technique (0.41% difference) but it was not quite accurate for Displacement Correlation Technique (9.58% difference).
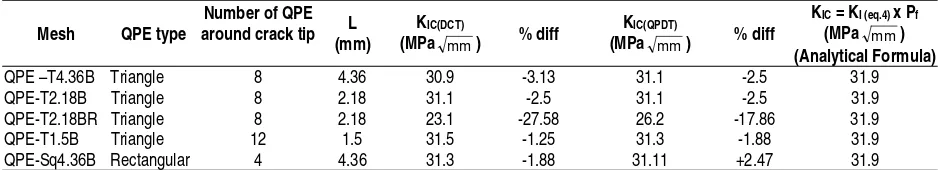
Mode I fracture three-point bend specimen
Mode I fracture testing over the beam specimen
resulted the fracture toughness of 31.9 MPa m m ,
calculated using analytical formula (eq. 4), where the
fracture load is Pf = 2450 N. The beam specimen
(three-point bend specimen) has E = 26.34 GPa and Poisson’s ratio (µ) of 0.2.
In general, the fracture toughness calculations using stress intensity factor derived from finite element analysis and analytical formula are reasonably in good agreement except the result which revealed from finite element analysis which used the mesh arrangement as depicted in Figure 9 (d), the elements are relatively uniform in size, which caused difficulty to reach converged stress intensity factor calculation. While the use of fine elements around the crack tip as in Figure 9 (e), which converged at the crack tip, resulted the closest fracture toughness calculation to the analytical formula result, either for
Displacement Correlation Technique or Quarter Point Displacement Technique. It seemed that the use of Displacement Correlation Technique and Quarter Point Displacement Technique for cracked-beam analysis were reasonably acceptable as long as combined with the appropriate mesh arrangement around the crack tip.
CONCLUSION AND RECOMMENDATION
Conclusion
It may be concluded from this present study that:
1. There is a tendency that Displacement
Correlation Technique and Quarter Point Displacement Technique are acceptable for cracked-beam analysis as far as coupled with the appropriate mesh arrangement. While Quarter Point Displacement Technique was more suitable for compact tension specimen.
2. The finer elements around the crack tip are recommended (converged from large to small element) for the accuracy of stress intensity factor calculation.
3. The use of rectangular elements around the crack tip is not recommended due to inconsistent result that might be resulted either calculated by Displacement Correlation Technique or Quarter Point Displacement Technique.
Recommendation
In this present study, the analysis is limited to the standardized specimens, further study is needed to simulate the crack in the actual structural member like beam, column and plate.
Table 1. Comparison of Mode I Fracture Toughness Obtained From Finite Element vs Analytical Formula (CT-Specimen)
Mesh QPE type Number of QPE around crack tip
L
Note: % diff = percentage of difference between finite element analysis and analytical formula results
Acknowledgement
Special thanks to Prof. Kwang Wei Lo and Dr. Min Min Zhao of National University of Singapore, due to their valuable support and advice.
REFERENCES
1. Henshell, R.D. and Shaw, K.G., Crack tip finite
elements are unnecessary, International Journal
for Numerical Methods in Engineering, 9, 1975, pp, 495-507.
2. Rice, J.R., A path independent integral and the approximate analysis of strain concentration by
notches and cracks, Journal of Applied
Mechanics, 35, 1968, pp, 379-386.
3. Hillerborg, A., Modeer, M., and Petersson P.E., Analysis of crack formation and crack growth in concrete by means of fracture mechanics and
finite elements, Cement and Concrete Research,
1976, pp, 773-782.
4. Shah, S.P. and Jenq Y.S., A two parameter
fracture model for concrete, Journal of
Engineering Mechanics, ASCE, 1985, pp, 1227-1241.
5. Xie, M. and Gerstle, W.H., Energy based
cohesive crack propagation modeling, Journal of
Engineering Mechanics, ASCE, 121, 1995, pp, 1349-1358.
6. Bazant, Z.P., Size effect in blunt fracture:
concrete, rock, metal, Journal of Engineering
Mechanics, ASCE, 110, 1984, pp, 518-535.
7. Tada, H., Paris, P., and Irwin, G.R., The Stress
Analysis of Cracks Handbook, 3rd edition, ASME
Press, New York, 2000.
8. Barsoum, R.S., On the use of isoparametric finite elements in linear fracture mechanics,
International Journal of Numerical Methods in Engineering, 10, 1976, pp, 25-37.
9. Boey, C.F. and Carter, J.P., Unconfined
compression testing of an artificially cemented carbonate soil, Research Report, University of Sydney, Sydney, 1989.
10. Rechstorisz, A., Bojtar, I., and Galos, M.,
Determination of Stress Intensity Factors On
Rock Specimens, Proc. 2nd International PhD
Symposium in Civil Engineering, Budapest, 1998, pp, 1-8.
11. American Society for Testing and Materials,