99
FTSE Bursa Malaysia EMAS Index from Year 2000 to 2009
Desmond Chang
School of Business, Assumption University of Thailand 592 Ramkhamhaeng 24 Bangkok 10240
E-mail: [email protected]
ABSTRACT
Benjamin Graham, also known as the “father of value investing” proposed that investment in the stock exchange can be a safe endeavor while receiving gains that outperform the market if the investor makes carefully thought out purchases. This study aims to determine if the use of some of Benjamin Graham’s stock selection criteria is able to generate returns that are significantly greater than the returns in the stock exchange of Malaysia, particularly, the comprehensive FTSE Bursa Malaysia EMAS Index. This study collected secondary data regarding fundamentals of companies listed in the FTSE Bursa Malaysia EMAS Index from the year 2000 to 2009. Five criteria were set up in this research based on one or a combination of price-to-earnings ratio, price-to-book value, current ratio and dividend yield. The listed companies were screened using those criteria. An equally weighted portfolio was created using the screened companies and their one-year and two-one-year returns calculated. The returns were compared to the market return. Hypotheses of this research were tested using t-test statistic to determine the significance of the data. This research found that most of the screening criteria used generated returns that were higher than the market return in almost every year they were tested in. Benjamin Graham’s stock selection criteria although have been conceived over 80 years ago is still applicable today in the Malaysian market. Further research can be conducted with different criteria with varying holding periods and in different markets.
Keywords: Benjamin Graham, value investing, stock market, stock return, earnings ratio, price-to-book value, current ratio, dividend yield
INTRODUCTION
According to Kahn & Milne (1997) investment activities in the early 1900s were limited to bonds as their returns are clearly stated. Without any guarantee of returns, common stocks were perceived as speculations.
As the father of fundamental analysis, Benjamin Graham believed that stock markets are not efficient. Graham & Zweig (2003) proposed that not overpaying for a stock is one of the safest methods one can use in investments. Therefore, excess returns can be had without significant risks through an investment paradigm called value investing.
Value investing as defined by Graham & Zweig (2003) is based on three characteristics of the financial markets. Firstly, the prices of financial securities are subject to erratic and significant movements. Secondly, despite these erratic movements, financial securities have fairly stable underlying values. These fundamental economic values can be measured by the investor who uses due diligence. In short, the value of the security may not be reflected in its current market price. Finally, the time to buy financial securities is when they are selling significantly below their intrinsic value or what they are really worth based on
assets of the company. Buying financial securities that have a market price below their intrinsic value provides safety for the value investor in the form of not over-paying for what those securities are worth.
In Graham & Zweig’s (2003) “The Intelligent Investor”, Graham outlined seven criteria for the defensive investor who seeks safety issues and does not actively monitor stock prices. The seven criteria are as follows:
1. Sufficient size of enterprise
2. An adequately strong financial condition 3. Earnings stability
4. Dividend record 5. Earnings growth
6. Moderate price-to-earnings ratio 7. Moderate ratio of price to assets
Arnold (2008) also found that investments based on a combination of value investing principles tend to outperform the market.
A low price-to-earnings ratio is an important criterion to use for the identification of a value stock. The ability of this criterion to generate returns that are higher than the market return is supported by the works of Basu (1977, 1983); Chan et al.(1991); Fama& French (1992);Athanassakos (2009);Truong (2009). Purchasing a stock with low price-to-earnings ratio can safeguard the investor from paying too much for a unit of earnings that the company generated.
Another criterion that determines a company’s value is price-to-book value. A price-to-book value of 1 would mean that the investor is just paying for the book value per share of the company. Therefore, this reduces risk to the investor for not paying for intangi-bles that cannot be accurately determined. Chanet al.(1991); Davis (1994); Piotroski (2000); Fama& French (2006); Athanassakos (2009); Dempsey (2010) found that common stocks with low price-to-book value earn higher returns.
Graham & Zweig (2003) believed that a company that constantly pays dividend is a safe investment. Lamont (1998) found that high dividend payout ratio can be used to forecast high returns.
Purchase of growth stocks is also known as glamour investing. Lakonishoket al. (1994) believed that investors tend to extrapolate earnings of companies too far into the future. Investors are willing to pay a high price in relation to earnings per share supported by a strong earnings forecast and bright growth outlook. This results in a high price-to-earnings ratio for growth stocks. As a form of contrarian investment that is contrary to growth investing, Fama& French (1998); Kwag& Lee (2006) also found that value investing tend to outperform growth investing.
Value investing criteria alone are not sufficient to select value stocks. The final element to value investing is the holding period. As the vicissitudes of stock prices have minimal effect on value investing, a long holding period works in favor of value investing. Works of Lakonishoket al. (1994); Rousseau &Rensburg (2004) support the fact that returns from value investing increases with an increase in holding period.
RESEARCH METHODOLOGY
Screening Rules
This research uses five screening rules to filter in stocks that meet value investing criteria defined in this
study. The main objective of this study is to determine if the use of some of Benjamin Graham’s stock selection criteria on their own can produce returns that are greater than the market return. The second objective is to compare if the use of a combination of Benjamin Graham’s stock selection criteria can produce returns that are greater than using them alone. As not all criteria can be practically imple-mented to select stocks in a low maturity market such as the stock exchange of Malaysia, one of the criteria was modified to suit the FTSE Bursa Malaysia EMAS. The criterion that a company should have a constant dividend yield was modified to become a dividend yield of at least the risk-free rate of the year in question. The reason for selecting the risk-free rate to compare with dividend yield is that even if the long term defensive investor cannot reap returns from stock price appreciation, he/she can still get a dividend that is at least the risk-free rate. This way, the investor does not lose out to risk-free investments like saving money in the bank. Unlike putting money in a savings account to get a fixed risk-free return, the defensive investor took risk to invest in the stock market but still obtained risk-free return with a potential for higher returns.
The following are screening rules that uses some of Benjamin Graham’s stock selection criteria individually and as a combination.
1. Price-to-earnings ratio of not more than 15. 2. Price-to-book value of not more than 1.
3. Price-to-earnings ratio of not more than 15, price-to-book value of not more than 1, and current ratio of at least 2.
4. Price-to-earnings ratio of not more than 15, price-to-book value of not more than 1, and dividend yield of at least the risk-free rate.
5. Price-to-earnings ratio of not more than 15, price-to-book value of not more than 1, current ratio of at least 2, and dividend yield of at least the risk-free rate.
Research Data and Portfolio Construction
The dividend yield data was compared to risk-free rate of the country which was obtained from Bank Negara Malaysia or the Central Bank of Malaysia. The figures used were the shortest risk-free rate of the country at the end of each year, which were the overnight interbank rates.
Index that existed in each year from the year 2000 to 2009. All data were collected at the end of every year. Companies with incomplete data were ignored. These lists were then screened according to the screening rules outlined in this research.
Stocks that meet this research’s screening rules were summed up to create an equally weighted portfolio for every rule. From the year 2000 to 2009, the researcher found between 11 and 238 stocks that meet the stock selection criteria which depends on the number of companies that were listed and the strictness of the criteria. The one-year returns of these five portfolios were calculated. Another five portfolios were created using the same screening rules. This time, the two-year returns were calculated. This process was repeated until the year 2009 where the one-year return was calculated as there is not enough data to calculate two-year returns for the year 2009 at the time this research was carried out.
To compute the total returns of the portfolios, the following formula was used:
(1) where,
To compute the one-year returns of the FTSE Bursa Malaysia EMAS Index, the following formula was used:
where,
D = dividend paid
P = price of stock at year end t = current year
The two-year returns were calculated using the following formula:
where,
D = dividend paid
P = price of stock at year end t = current year
Statistical Treatment of Data
Returns of the portfolios were compared to the returns of the market, namely, the FTSE Bursa Malaysia EMAS Index. This research will initially determine if the returns of the portfolios created from the screening criteria are higher than the market
return. If the returns are higher, their statistical significances were determined using t-test statistic. According to Walpole et al. (2002), a one-tailed t-test can be used to determine the statistical significance of hypotheses in this study.
In the case of hypothesis testing in the FTSEBM EMAS Index, since this research aims to test hypo-thesis on a single mean, the general detail of each hypothesis and its test equation are as follows:
Ho: Return of the portfolio is equal to or lower than
the return of the market
Ha: Return of the portfolio is significantly higher than
the return of the market
̅ √
where,
̅ = mean return of the sample = mean return of the stock index = standard deviation of the sample
= number of stocks in the sample
RESULTS AND DISCUSSIONS
In this part, the researcher discusses the main findings from the study. The detailed results can be found in Appendix.
For the first screening rule, the researcher found that the resultant portfolio produced significantly greater one-year returns than the market for 9 out of 10 years. The same screening rule produced signi-ficantly greater two-year returns than the market for 8 out of 9 years.
For the second screening rule, the researcher found that the resulting portfolio produced signi-ficantly higher one-year returns compared to the market for 9 out of 10 years. The same screening rule produced significantly higher two-year returns than the market for 8 out of 9 years.
Using the third screening rule, the researcher found that the resulting portfolio produced significantly higher one-year returns compared to the market for 8 out of 10 years. The same screening rule produced significantly higher two-year returns than the market for 7 out of 9 years.
When stocks were selected based on the fourth screening rule, the researcher found that the resulting portfolio produced significantly higher one-year returns compared to the market for 9 out of 10 years. The same screening rule produced significantly higher two-year returns than the market for 8 out of 9 years.
resulting portfolio produced significantly higher one-year returns compared to the market for 7 out of 10 years. The same screening rule produced significantly higher two-year returns than the market for 6 out of 9 years.
Using some of Benjamin Graham’s stock selection criteria as screening rule to select stocks to invest in, the researcher found that 79 out of 95 hypotheses generated significantly higher returns than the return of the FTSE Bursa Malaysia EMAS Index. Out of the 16 hypotheses that did not generate significantly higher returns than the market return, 15 hypotheses still generated higher returns than the market return. Only the two-year return in the year 2003 using criterion of a price-to-book value of not greater than one did not produce a return that is higher than the market return.
From this research, it can be seen that using some of Benjamin Graham’s stock selection criteria on their own such as a low price-to-earnings ratio and a low price-to-book value is sufficient to generate returns that are greater than the market return. This is advantageous for defensive investors that can acquire basic company fundamentals. However, adding more criteria to generate stricter screening rules open up more possibilities for even higher returns. Similar to Oppenheimer’s (1984) research, adding more criteria does not always produce higher returns.
CONCLUSIONS AND RECOMMENDATIONS
In this research, the highest returns came from the fourth screening rule which has a price-to-earnings ratio of not greater than 15, a price-to-book value of not greater than 1 and a dividend yield of at least the risk-free rate. This screening rule generated the highest returns from eleven out of nineteen portfolios created in this research. From this finding, it can be implied that investing based on this screening rule will generally provide returns that are higher than the return of the FTSE Bursa Malaysia EMAS Index.
In conclusion, evidence in this study suggests that Benjamin Graham’s stock selection criteria were not without merit. They have provided returns that are not only greater than market returns, but significantly so.
The only portfolio that did not produce a return that was higher than the market return was created using the criterion of a low price-to-book value in the year 2003 to select stocks that were held for two years. This could be due to significant market forces reported by BBC (2003) that unsettled the economy so badly that government intervention was needed to stimulate the economy. Based on this fact, the
researcher suggests that investors that do not intend to take unnecessary risks, to not invest in the stock market when the economy is turbulent. Otherwise, using some of Benjamin Graham’s stock selection criteria still produced returns that are higher than the return of the FTSE Bursa Malaysia EMAS Index.
As this research can benefit private investors, fund managers and academicians, more research can be extended on this research. Due to the scope and limitations of this research, there may occur some shortcomings that do not allow the investor to get the maximum possible long-term return.
Future researches can use different combinations of Benjamin Graham’s stock selection criteria to determine if greater returns can be found. Future researchers can fine-tune the screening criteria used in this research to obtain the maximum possible return from investing in the FTSE Bursa Malaysia EMAS Index.
As investors hope for better returns from the limited amount of capital they have, future researches can also be made on the percentage return of a portfolio using various screening criteria when compared to the market return. The ultimate aim would be to find the stock selection criteria that produce the maximum possible long-term return.
REFERENCES
Athanassakos, G. 2009. Value versus Growth Stock Returns and the Value Premium: The Canadian Experience 1985-2005.Canadian Journal of Administrative Sciences, 26(2): 109-121.
Basu, S. 1977. Investment Performance of Common Stocks in Relation to Their Price-Earnings Ratios: A Test of the Efficient Market Hypothesis. The Journal of Finance, 32(3): 663-682.
Basu, S. 1983. The Relationship between Earnings' Yield, Market Value and Return for NYSE Common Stocks. Journal of Financial Econo-mics, 12(1): 129-156.
BBC. 2003. May 21. Malaysia Unveils Sars Aid Package. BBC News. Retrieved from http:// news.bbc.co.uk/2/hi/business/3046237.stm.
Chan, L.K.C., Hamao, Y. & Lakonishok, J. 1991. Fun-damentals and Stock Returns in Japan, Ame-rican Finance Association. 46(5): 1739-1764.
Davis, J.L. 1994. The Cross-Section of Realized Stock Returns: The Pre-COMPUSTAT Evidence.
Dempsey, M. 2010. The Book-To-Market Equity Ratio as a Proxy for Risk: Evidence from Australian Markets.Australian Journal of Management, 35(1): 7-21.
Fama, E.F. & French, K.R. 1992.The Cross-Section of Expected Stock Returns.American Finance Association, 47(2): 427-465.
Fama, E.F. & French, K.R. 1998. Value versus Growth: The International Evidence. The Jour-nal of Finance, 53(6): 1975-1999.
Fama, E.F. & French, K.R. 2006.The Value Premium and the CAPM.The Journal of Finance, 61(5): 2163-2185.
Graham, B. & Zweig, J. 2003. The Intelligent Investor. Revised Edition. New York: Harper Business Essentials.
Kahn, I. & Milne, R.D. 1977. Benjamin Graham the Father of Financial Analysis. Virginia: The Financial Analysts Research Foundation.
Kwag, S. & Lee, S.W. 2006. Value Investing and the Business Cycle. Journal of Financial Planning, 19(1): 64-71.
Lakonishok, J., Shleifer, A. & Vishny, R.W. 1994. Contrarian Investment, Extrapolation, and
Risk. The Journal of Finance, 49(5): 1541-1578.
Lamont, O. 1998. Earnings and Expected Returns,
American Finance Association. 53(5): 1563-1587.
Oppenheimer, H.R. 1984. A Test of Ben Graham's Stock Selection Criteria. Financial Analysts Journal, 40(5): 68-74.
Piotroski, J.D. 2000. Value Investing: The Use of Historical Financial Statement Information to Separate Winners from Losers. Journal of Accounting Research, 38(3): 1-41.
Rousseau, R.. & Rensburg, P.V. 2004. Time and the Payoff to Value Investing. Journal of Asset Management, 4(5): 318-325.
Truong, C. 2009. Value Investing Using Price Earnings Ratio in New Zealand. University of Auckland Business Review, 12(1): 1-7. Walpole, R.E., Myers, R.H., Myers, S.L. &Ye, K.
2002. Probability and Statistics for Engineers and Scientists. Seventh Edition. New Jersey: Prentice-Hall.
Appendix:
Table 1. Results of one-year portfolios in the year 2000
Screening Rule
Number of Stocks
1-year return in year 2000
p-value Significant Market Portfolio
1 95 1.09% 14.75% 0.00001 Yes ***
2 76 1.09% 17.58% 0.00000 Yes ***
3 17 1.09% 20.10% 0.00545 Yes ***
4 26 1.09% 26.37% 0.00008 Yes ***
5 11 1.09% 26.02% 0.00990 Yes ***
*10% significance, **5% significance, ***1% significance.
Table 2. Results of two-year portfolios in the year 2000
Screening Rule
Number of Stocks
2-year return in 2000
p-value Significant Market Portfolio
1 95 -4.74% 22.94% 0.00006 Yes ***
2 76 -4.74% 20.87% 0.00250 Yes ***
3 17 -4.74% 43.02% 0.06054 Yes *
4 26 -4.74% 44.66% 0.01176 Yes **
5 11 -4.74% 62.64% 0.07964 Yes *
*10% significance, **5% significance, ***1% significance.
Table 3. Results of one-year portfolios in the year 2001
Screening Rule
Number of Stocks
1-year return in 2001
p-value Significant Market Portfolio
1 101 -5.77% 7.88% 0.00000 Yes ***
2 78 -5.77% 1.23% 0.00156 Yes ***
3 22 -5.77% 2.26% 0.02985 Yes **
4 28 -5.77% 8.19% 0.00022 Yes ***
5 15 -5.77% 4.86% 0.02510 Yes **
*10% significance, **5% significance, ***1% significance.
Table 4. Results of two-year portfolios in the year 2001
Screening Rule
Number of Stocks
2-year return in 2001
p-value Significant Market Portfolio
1 101 15.93% 50.45% 0.00000 Yes ***
2 78 15.93% 37.12% 0.00002 Yes ***
3 22 15.93% 47.98% 0.00170 Yes ***
4 28 15.93% 53.02% 0.00018 Yes ***
5 15 15.93% 51.60% 0.00879 Yes ***
*10% significance, **5% significance, ***1% significance.
Table 5. Results of one-year portfolios in the year 2002
Screening Rule
Number of Stocks
1-year return in 2002
p-value Significant Market Portfolio
1 145 23.03% 46.08% 0.00000 Yes ***
2 122 23.03% 41.70% 0.00000 Yes ***
3 41 23.03% 45.78% 0.00116 Yes ***
4 47 23.03% 45.83% 0.00072 Yes ***
5 30 23.03% 46.83% 0.00746 Yes ***
*10% significance, **5% significance, ***1% significance.
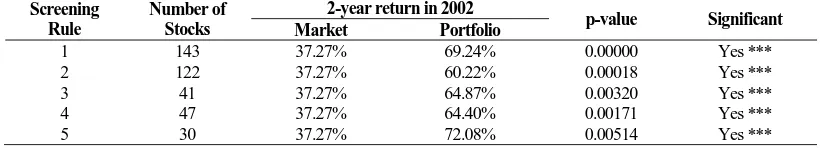
Table 6. Results of two-year portfolios in the year 2002
Screening Rule
Number of Stocks
2-year return in 2002
p-value Significant Market Portfolio
1 143 37.27% 69.24% 0.00000 Yes ***
2 122 37.27% 60.22% 0.00018 Yes ***
3 41 37.27% 64.87% 0.00320 Yes ***
4 47 37.27% 64.40% 0.00171 Yes ***
5 30 37.27% 72.08% 0.00514 Yes ***
Table 7. Results of one-year portfolios in the year 2003
Screening Rule
Number of Stocks
1-year return in 2003
p-value Significant Market Portfolio
1 146 11.57% 20.82% 0.00513 Yes ***
2 98 11.57% 21.07% 0.03178 Yes **
3 26 11.57% 21.13% 0.11485 No
4 31 11.57% 19.06% 0.06868 Yes *
5 13 11.57% 19.15% 0.16369 No
*10% significance, **5% significance, ***1% significance.
Table 8. Results of two-year portfolios in the year 2003
Screening Rule
Number of Stocks
2-year return in 2003
p-value Significant Market Portfolio
1 140 4.23% 8.14% 0.22644 No
2 91 4.23% 4.02% 0.51278 No
3 25 4.23% 5.12% 0.46349 No
4 31 4.23% 22.80% 0.16099 No
5 13 4.23% 10.00% 0.27154 No
*10% significance, **5% significance, ***1% significance.
Table 9. Results of one-year portfolios in the year 2004
Screening Rule
Number of Stocks
1-year return in 2004
p-value Significant Market Portfolio
1 144 -6.58% -4.16% 0.28464 No
2 93 -6.58% -3.91% 0.33668 No
3 26 -6.58% -4.41% 0.32467 No
4 35 -6.58% 10.16% 0.14074 No
5 16 -6.58% -5.47% 0.42235 No
*10% significance, **5% significance, ***1% significance.
Table 10. Results of two-year portfolios in the year 2004
Screening Rule
Number of Stocks
2-year return in 2004
p-value Significant Market Portfolio
1 139 16.74% 33.54% 0.00229 Yes ***
2 89 16.74% 35.50% 0.00999 Yes ***
3 26 16.74% 23.12% 0.24256 No
4 35 16.74% 39.70% 0.08637 Yes *
5 16 16.74% 39.70% 0.41282 No
*10% significance, **5% significance, ***1% significance.
Table 11. Results of one-year portfolios in the year 2005
Screening Rule
Number of Stocks
1-year return in 2005
p-value Significant Market Portfolio
1 182 24.96% 50.28% 0.00000 Yes ***
2 135 24.96% 50.13% 0.00000 Yes ***
3 44 24.96% 44.73% 0.00186 Yes ***
4 56 24.96% 43.73% 0.00189 Yes ***
5 28 24.96% 33.68% 0.08763 Yes ***
*10% significance, **5% significance, ***1% significance.
Table 12. Results of two-year portfolios in the year 2005
Screening Rule
Number of Stocks
2-year return in 2005
p-value Significant Market Portfolio
1 176 71.00% 138.00% 0.00000 Yes ***
2 130 71.00% 148.66% 0.00000 Yes ***
3 42 71.00% 106.46% 0.00445 Yes ***
4 55 71.00% 152.45% 0.00210 Yes ***
5 27 71.00% 84.57% 0.16143 No
Table 13. Results of one-year portfolios in the year 2006
Screening Rule
Number of Stocks
1-year return in 2006
p-value Significant Market Portfolio
1 186 36.84% 59.84% 0.00006 Yes ***
2 131 36.84% 69.35% 0.00007 Yes ***
3 42 36.84% 54.71% 0.03781 Yes **
4 40 36.84% 66.45% 0.03704 Yes **
5 16 36.84% 47.56% 0.26135 No
*10% significance, **5% significance, ***1% significance.
Table 14. Results of two-year portfolios in the year 2006
Screening Rule
Number of Stocks
2-year return in 2006
p-value Significant Market Portfolio
1 183 -20.13% -3.13% 0.00000 Yes ***
2 128 -20.13% -1.78% 0.00000 Yes ***
3 42 -20.13% -8.58% 0.01206 Yes **
4 40 -20.13% 12.33% 0.00004 Yes ***
5 16 -20.13% 1.43% 0.00123 Yes ***
*10% significance, **5% significance, ***1% significance.
Table 15. Results of one-year portfolios in the year 2007
Screening Rule
Number of Stocks
1-year return in 2007
p-value Significant Market Portfolio
1 181 -41.63% -31.55% 0.00000 Yes ***
2 92 -41.63% -28.34% 0.00000 Yes ***
3 35 -41.63% -31.27% 0.00039 Yes ***
4 39 -41.63% -24.65% 0.00017 Yes ***
5 18 -41.63% -30.45% 0.01214 Yes **
*10% significance, **5% significance, ***1% significance.
Table 16. Results of two-year portfolios in the year 2007
Screening Rule
Number of Stocks
2-year return in 2007
p-value Significant Market Portfolio
1 172 -13.28% 4.96% 0.00000 Yes ***
2 87 -13.28% 8.39% 0.00001 Yes ***
3 33 -13.28% 0.81% 0.00899 Yes ***
4 38 -13.28% 19.19% 0.00049 Yes ***
5 17 -13.28% 4.44% 0.00831 Yes ***
*10% significance, **5% significance, ***1% significance.
Table 17. Results of one-year portfolios in the year 2008
Screening Rule
Number of Stocks
1-year return in 2008
p-value Significant Market Portfolio
1 228 48.57% 72.08% 0.00000 Yes ***
2 176 48.57% 74.49% 0.00001 Yes ***
3 54 48.57% 72.88% 0.00110 Yes ***
4 100 48.57% 73.80% 0.00023 Yes ***
5 35 48.57% 71.29% 0.00088 Yes ***
*10% significance, **5% significance, ***1% significance.
Table 18. Results of two-year portfolios in the year 2008
Screening Rule
Number of Stocks
2-year return in 2008
p-value Significant Market Portfolio
1 190 81.18% 114.73% 0.00000 Yes ***
2 141 81.18% 121.26% 0.00000 Yes ***
3 42 81.18% 127.98% 0.00198 Yes ***
4 82 81.18% 127.76% 0.00001 Yes ***
5 28 81.18% 132.97% 0.00410 Yes ***
*10% significance, **5% significance, ***1% significance.
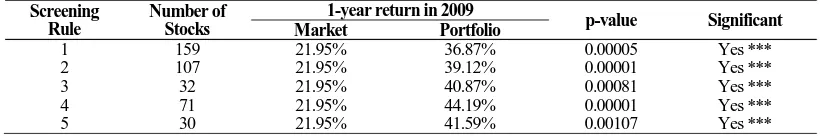
Table 19. Results of one-year portfolios in the year 2009
Screening Rule
Number of Stocks
1-year return in 2009
p-value Significant Market Portfolio
1 159 21.95% 36.87% 0.00005 Yes ***
2 107 21.95% 39.12% 0.00001 Yes ***
3 32 21.95% 40.87% 0.00081 Yes ***
4 71 21.95% 44.19% 0.00001 Yes ***
5 30 21.95% 41.59% 0.00107 Yes ***