Volume 27, Number 3, 2012, 293 – 302
INFRASTRUCTURE IMPROVEMENT AND ITS IMPACTS ON THE
INDONESIAN ECONOMIC PERFORMANCE
12Tony Irawan
Department of Economics
Faculty of Economics and Management – Bogor Agricultural University ([email protected])
Djoni Hartono
Graduate Program in Economics
Faculty of Economics and Business – University of Indonesia ([email protected])
Ferry Irawan
Fiscal Policy Office – the Ministry of Finance ([email protected])
Arief Anshory Yusuf
Faculty of Economics – Padjadjaran University ([email protected])
ABSTRACT
Indonesian government shows their big commitment on the improvement of infrastruc-ture which is reflected in some regulations and policies made. It is supported by many empirical evidences that show the importance of infrastructure improvement on the economic performance. This paper developed a Computable General Equilibrium (CGE) model to analyze the impacts of infrastructure on the Indonesian economy by introducing several types of infrastructure and discussing the impacts of it on the poverty level. The results suggest that improvement on any types of infrastructure is expected to increase the economic growth, raise the government revenue, raise the factors’ income and reduce the poverty level. Improvement on the public work of agriculture, land transportation and telecommunication are still being preferable options comparing to others. Interestingly, even though the public work of agriculture is usually located in rural areas, the model suggests that the improvement on this sector will result higher impact on the urban household rather than to the rural household.
Keywords: infrastructure, CGE, policy, poverty
1 This paper is funded by Fiscal Risk Management Center - Fiscal Policy Office of Indonesian Ministry of Finance. The
views expressed in this paper do not represent the institution where the authors are affiliated.
INTRODUCTION
Infrastructure has been one of the main focuses of Indonesian government nowadays. In 2006, government introduced the infra-structure improvement policy via the Decree of the Ministry of Finance No. 38/PMK.01/ 2006. Moreover, in order to minimize the im-pacts of global crisis to the national economy, Indonesian government implemented fiscal stimulus in which infrastructure stimulus is one of the programs.
Government believes that good infra-structure will support economic growth; and higher economic performance needs more infrastructures. Moreover, any project related to infrastructure mostly employs many people and then reduce unemployment rate. These arguments are not only a government’s per-spective but it has been confirmed by many empirical studies. Aschauer (1989) found that capital accumulation on public sector im-proved productivity of private sector in United States. His econometric model shows that ba-sic infrastructure such as road, airport, mass rapid transportation system, water and drain-age has positive and significant causal rela-tionship to the productivity level.
The positive relationship between infra-structure and productivity is also supported by Bonaglia et al. (2000). Using Italian data, Bonaglia et al. (2000) found that infrastructure does not only affect productivity but also the output and cost reduction. In term of types, improvement on transportation will give higher impact on the output comparing to the other types of infrastructure. Canning (1999) used panel data of fifty-seven countries in 1960 – 1990 to analyze the impacts of infra-structure on output. The study supports previ-ous findings that suggest the positive impacts of the infrastructure on output. In detail, Canning (1999) found that electricity and transportation have high marginal productivity level as much as capital and even higher in developed countries. Interestingly, the re-search also found that telecommunication has
the highest marginal productivity level com-paring to the other types of infrastructure which is quite different from Bonaglia et al. (2000) but much more similar to Sridar & Sridar (2004). Moreover, Sridar & Sridar (2004) emphasized that the impacts of tele-communication on economic performance will be much larger to developed countries than to developing countries.
Infrastructure is important to increase a country’s competitiveness. Having used the Senegal Social Accounting Matrix (SAM) and employed a Computable General Equilibrium (CGE) model, Dumont and Somps (2000) found that infrastructure have positive impacts on manufacture sector performance, both out-put and competitiveness. However, the mag-nitude of the impacts would depend on the size of the effect of infrastructure on domestic price and wage. Furthermore, different source of fund for infrastructure improvement will also determine the magnitude of impacts on output and competitiveness. The variety of sources of fund then becomes the focus of Estache (2007). Using a CGE model, Estache (2007) found that foreign aid could possibly result the Dutch Disease Effect. Consequently, the positive impacts of the infrastructure that is funded by foreign aid will be smaller than other source of fund since the Dutch Disease Effect phenomena will deteriorate the growth effect.
Esfahani & Ramirez (2002) added one more variable –institution- that will determine the impacts of the infrastructure on the eco-nomic performance. Since the country has institutions3 that have capability and credibil-ity in supporting the improvement on infra-structure, the investment will boost up and then result higher output growth.
Up to now, literatures analyzing the im-pacts of the infrastructure on the Indonesian economic performance are very limited. One of the studies on infrastructure was Parikesit
(2004) that analyses the impacts of road infra-structure investment on the economic and re-gional development. Parikesit (2004) em-ployed a CGE model using Vehicle Operation Cost (VOC) as input indicators; while eco-nomic growth, investment benefit ratio, and labor force absorption as output indicators in the database. The study reveals that road in-vestment in Java will have larger impact to economic growth than to other regions.
In conclusion, all the literatures above suggest that infrastructure has important role in creating better economic performance. However, the types of infrastructure that are needed to focus on as priority – due to its large impacts on the economy – will depend on the country itself. Setting priority will be impor-tant if the country does not have large flexibil-ity on their budget which commonly happened in developing countries such as Indonesia. In this paper, a CGE model is developed to ana-lyze the impacts of infrastructure on the Indo-nesian economic performance by introducing several types of infrastructure. It is expected that the model could give valuable information to the policy makers in setting the priority of infrastructure development; since the model could measure the impacts of particular types of infrastructure development on the Indone-sian economy. Moreover, the CGE model is completed by the poverty module to measure the impacts of infrastructure improvement on the poverty level.
The paper is started by the introduction on the section one. Section two presents the CGE model. Section three details the structure of the database and simulations. Section 4 veys the results and discussions. Finally, con-clusions are drawn in section five.
CGE MODEL
The origin of the CGE model developed in this paper was the standard model constructed by Lofgren et al. (2002). The standard model is designed for developing countries and has
some basic features. The model has included consumption of non-tradable commodities, specification of transaction cost, and two dif-ferent accounts for activities and commodities. The last feature is to analyse any production activity that produces multiple commodities and vice versa. In order to improve the stan-dard model, a poverty module that links the CGE result with modified household data is included.
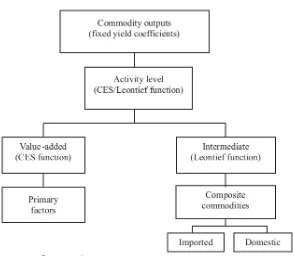
The concepts of the standard model that are used in this study will be briefly shown as follow. First, the production block. In this block, it is assumed that producer who is rep-resented by the activities will maximize their profit subject to production technology. In this model, production functions are assumed to be Nested Constant Elasticity of Substitution (CES) over composite commodity. At the top nesting, Output is defined as CES function or Leontief function of Intermediate Input and Value Added. In the second level, intermediate input is a function of imported and domestic commodities which are used in the fixed pro-portion (Leontief function) and value added is a CES function of primary factors (see figure 1). Total output that is produced by each ac-tivity (sector) is defined as:
a
where QAa represents quantity of activity; ada
is efficiency parameter in the CES production function; afa is CES production function
share parameter for factor f in activity a;
fa
QF
is quantity demanded of factor f fromactivity a; and a a
represents CES production function exponent. As previously mentioned, the model used Leontief function in order to capture the demand for intermediate input, hence:
.
ca ca a
Source: Lofgrean et al., (2002)
Figure 1. Functions in Supply Block
where QINTca is quantity of commodity c as
intermediate input to activity a; and
ica
caisintermediate input coefficient.
Second, the factor income block. In this block each activity will use the combination of the factors up to the point where marginal revenue is equal to its factors’ price. The fac-tors might be different across production activities due to the segmentation of market and the factors’ mobility. There are some options of factors market closure that can be chosen – depend on the needs of the analysis. This model follows the default closure in which supply of factors and activity-specific wage are assumed fixed.
Third, the consumption block. In this block institution is defined as households, enterprises, government and rest of the world. The type of households that are used in the model follows the Indonesian SAM disaggre-gation. The households earn income from the
production factors and transfer from other institutions. Then, the household use their income for consumption purposes, paying taxes, saving and transferring to other institu-tions, hence:
h ID
i
ih
h shrtr MPS
EH 1 1
1TYh
YIhEXR.trrowh
(3)where EHh represents consumption spending
for households; shrtrih is share of domestic
institution i in income of household h; MPSh is
marginal propensity to save for household;
h
TY is direct tax rate for household h; YIh is
income of household; EXR is exchange rate; and trrowh is transfer from household h to rest
con-sumption by enterprises that allocate their income to pay taxes, save and transfer to other institutions. Meanwhile, the government uses their income from taxes and transfer to con-sume commodities and to other institutions.
THE STRUCTURE OF DATABASE AND SIMULATIONS
This paper applied the Indonesian Social Accounting Matrix (SAM) 2005 as a database of the CGE model. Technically, all the equa-tions in the CGE model were formulated in order to model all the data in SAM table based on economic theories. Then, by using addi-tional information such as elasticity, CGE model could reproduce SAM table. In line with the structure of Indonesian SAM 2005, the model contains twenty-four sectors which are defined as activities/commodities. Seven-teen categories of production factors intro-duced: non labor (including land and capital) and the eight categories of labor (formal and informal agricultural worker; formal and in-formal manual worker; in-formal and inin-formal clerical worker; and formal and informal pro-fessional worker) for both rural and urban. Moreover, the model also contains twelve categories of institution, i.e. enterprise, gov-ernment and ten types of households4.
In general, SAM disaggregation does not specifically define the infrastructure sectors. Almost all infrastructures (i.e. road, public work of agriculture/irrigation, port, etc) are included in the construction sectors along with various services supporting the sectors. Among the twenty-four sectors, four sectors are chosen to represent the infrastructure. Those sectors are electricity, gas and drinking water sector, construction sector, land-trans-portation sector, and water, air transland-trans-portation and communication sector. The infrastructure improvement cannot be defined as the in-creasing of infrastructure related sector output
4For detail definition see Hartono & Resosudarmo
(2008).
– for instance land transportation sector – be-cause the value of output in SAM table does not necessarily mean the length of the road or quality of the road which is the best measure-ment of infrastructure. Basically, the value of output in SAM table means the total value of land transportation services – that are not only determined by the length of the road but also the quantity of vehicles operated. Due to those limitations, the infrastructure improvement is defined as higher productivity, reduction in transport cost, and larger capital stock. Why productivity, transport cost and capital stock? Take a re-look at the findings by Aschauer (1989), Bonaglia et al. (2000), and Canning (1999). Empirically, improvement on particu-lar infrastructure will impact positively on the productivity and reduce the transport cost. Moreover, Warr et al. (2009) also used shock on the transport cost to represent the infra-structure improvement on the CGE model for Thailand and Lao PDR. Aschauer (1989) shows that improvement on the infrastructure can be represented by the increasing of public capital stock by using a modified Cobb Douglas production function. Public capital stock is a part of total capital stock that exoge-nously will determine the level of output.
per-cents; (4) improvement on land transportation infrastructure–represented by the reduction in transport cost of land transportation sector by twenty-five percents; (5) improvement on water and air transportation infrastructure– represented by the reduction in transport cost of water and air transportation sector by twenty-five percents; (6) improvement on electricity infrastructure–represented by the increasing of capital stock in electricity sector by five percents; and (7) improvement on communication infrastructure–represented by the increasing of capital stock in water and air transportation sector by five percents.
RESULTS AND DISCUSSION
Before analyzing the results of tions, it is important to note that the simula-tions in this paper can be categorized into 3 groups, i.e. productivity, transport cost, and capital stock. Therefore, the differences be-tween the simulations result across groups will be incomparable. In the first group of the simulations–infrastructure improvement is represented in higher productivity–improve-ment on public work of agriculture is expected to impact positively on the national output than the improvement on any type of trans-portation infrastructure. It is expected that investing more money in public work of agri-culture by five percents will increase output approximately 0.7 percent. Moreover, im-provement on public work of agriculture is expected to result higher impacts to the gov-ernment income than to other options. Theo-retically, better infrastructure will increase productivity which, then, will raise output. As a result, the government income that is col-lected from taxes will increase as well. The result strongly supported the current Indone-sian government policy on infrastructure. Based on the National Summit 2009, Indone-sian government will focus on the develop-ment of types of infrastructure that are not commercially viable but economically feasi-ble. Public work of agriculture is one of the
types of infrastructure that is not commercially viable but significantly needed by many peo-ple especially farmers and has significant im-pacts on the economy.
In the second group of simulations, infra-structure improvement that is represented by the decreasing of transport cost, the highest impacts on national output and the government income is resulted from infrastructure im-provement on land transportation. Land trans-portation plays important role in the sian economy, especially in the West Indone-sia (Java and Sumatera). The distribution of nine basic commodities in the West Indonesia is significantly depending on the land trans-portation relative to air or water transtrans-portation.
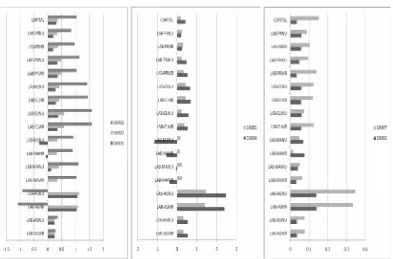
Below is the comparison on the results of the infrastructure improvement that is repre-sented by the increasing of capital accumula-tion. There are two scenarios defined: by in-creasing capital on electricity sector and tele-communication sector. Figure 2 suggests that infrastructure improvement on the communi-cation sector is expected to result higher eco-nomic growth and increase government in-come than the improvement on electricity sector. The result is reasonable since the pub-lication data shows that the number of mobile phone users increased significantly and even reached nearly half of total population in 2009. Moreover, internet users also increased sub-stantially by more than 40% than to the previ-ous year5.
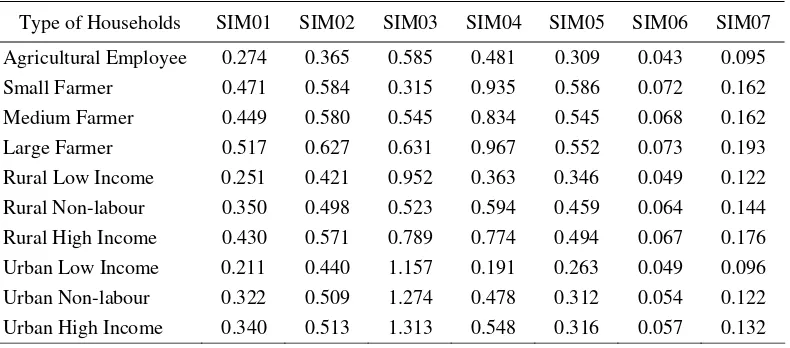
Here is the analysis on the impacts of in-frastructure on the factors’ income. Generally, most simulations will impact positively on the factors’ income (see Figure 3). In the first group of simulations, infrastructure improve-ment on public work of agriculture is expected will result larger positive impacts on factors’ income comparing to other scenarios; except for informal agricultural worker. Since it is assumed that the improvement on public work
5 Based on Association of Internet Services Providers
of agriculture will result higher productivity on agricultural sector, farmers become more efficient on its production process. Thus, farmers will need less informal agricultural workers. Figure 3 shows that better public work of agriculture will not only affect work-ers who are involved in the agricultural sector
but also give positive and even larger impacts to the non-agricultural workers. These findings imply that the improvement on public work of agriculture will result larger benefit to the off-farm workers (manual, clerical, and profes-sional workers) than to the on-farm workers (agricultural workers).
Figure 2. The Impacts on the Macro Economic Indicators
In terms of transport cost reduction, infra-structure improvement on land transportation will result bigger positive impacts on the fac-tors’ income than the improvement on water and air transportation. However, improvement on land transportation will impact negatively on the income of manual workers.
In the third group of simulations, infra-structure improvement on both electricity sector and telecommunication sector will im-pact positively on the factors’ income. How-ever the impact is very small in magnitude. It is expected that the increasing of capital by five percents will increase factors income by less than 0.4 percent for each category of fac-tors.
Table 1 shows the impacts of infrastruc-ture improvement on household’s income. In general, the improvement on public work of agriculture, land transportation and telecom-munication are still being preferable options within its group of simulations. Interestingly, even though public work of agriculture usually is located in rural areas, but the model sug-gests that the improvement on public work of agriculture will result higher impact to the urban household than to the rural household. As being mentioned before, the improvement on public work of agriculture is expected will
give more advantages to the off-farm workers than to the on-farm ones. As a result, urban household will receive more benefit than the others.
The infrastructure improvement on land transportation is expected will impact larger to the agricultural farmers (small, medium, and large farmer) than to the other households. These might be due to the high dependency of agricultural farmers on land transportation to distribute their crops. Lower transport cost due to better infrastructure on land transportation will increase profit that will be accepted by agricultural farmers.
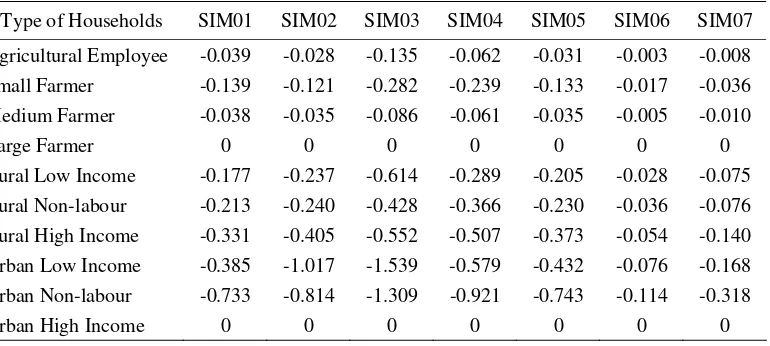
One of the strengths of the model that is used in this paper is the ability to measure poverty impacts due to the infrastructure im-provement. Generally, improvement on any types of infrastructure that are measured in productivity, transport cost and even capital accumulation is expected to reduce poverty level on all types of households. Note that poverty level for large farmers and urban high income should be zero. Again, the improve-ment on public work of agriculture, land transportation and telecommunication are still preferable options within its group of simula-tion (see Table 2).
Table 1. The Impacts on the Households’ Income (percentage change)
Type of Households SIM01 SIM02 SIM03 SIM04 SIM05 SIM06 SIM07
Agricultural Employee 0.274 0.365 0.585 0.481 0.309 0.043 0.095
Small Farmer 0.471 0.584 0.315 0.935 0.586 0.072 0.162
Medium Farmer 0.449 0.580 0.545 0.834 0.545 0.068 0.162
Large Farmer 0.517 0.627 0.631 0.967 0.552 0.073 0.193
Rural Low Income 0.251 0.421 0.952 0.363 0.346 0.049 0.122
Rural Non-labour 0.350 0.498 0.523 0.594 0.459 0.064 0.144
Rural High Income 0.430 0.571 0.789 0.774 0.494 0.067 0.176
Urban Low Income 0.211 0.440 1.157 0.191 0.263 0.049 0.096
Urban Non-labour 0.322 0.509 1.274 0.478 0.312 0.054 0.122
Table 2. The Impacts on the Poverty Level (percentage change)
Type of Households SIM01 SIM02 SIM03 SIM04 SIM05 SIM06 SIM07
Agricultural Employee -0.039 -0.028 -0.135 -0.062 -0.031 -0.003 -0.008
Small Farmer -0.139 -0.121 -0.282 -0.239 -0.133 -0.017 -0.036
Medium Farmer -0.038 -0.035 -0.086 -0.061 -0.035 -0.005 -0.010
Large Farmer 0 0 0 0 0 0 0
Rural Low Income -0.177 -0.237 -0.614 -0.289 -0.205 -0.028 -0.075
Rural Non-labour -0.213 -0.240 -0.428 -0.366 -0.230 -0.036 -0.076
Rural High Income -0.331 -0.405 -0.552 -0.507 -0.373 -0.054 -0.140
Urban Low Income -0.385 -1.017 -1.539 -0.579 -0.432 -0.076 -0.168
Urban Non-labour -0.733 -0.814 -1.309 -0.921 -0.743 -0.114 -0.318
Urban High Income 0 0 0 0 0 0 0
CONCLUSION
This paper, using a CGE model and SAM data for Indonesia, has elaborated a compre-hensive analysis on the impacts of infrastruc-ture on the Indonesian economy. In addition, this paper also analyzes the link between in-frastructures and the poverty. This study is expected to provide valuable information for policy makers to set priorities of the infra-structure development since the model could measure the impacts of particular types of in-frastructure development on the Indonesian economy.
It should be noted that the study has weaknesses in terms of defining the sectors, as seen in the electricity sector and telecommuni-cations. However, it is worth noting that only a few scholars and researchers have used the CGE model to discuss infrastructure issues in Indonesia. In general, the CGE model suggests that improvement on any types of infrastruc-ture is expected to result higher economic growth, higher government revenue, and higher factors’ income; meanwhile reduce the poverty level. By carefully taking into the ac-count weaknesses of the model, some specific conclusions that can be drawn are as follows. First, if higher productivity is used as a proxy of better infrastructure, the improvement on
public work of agriculture will be more eco-nomically preferable than the other options. Second, if infrastructure improvement is rep-resented as lower transport cost, the improve-ment on land transportation infrastructure will result higher positive impacts relative to the improvement on water and air transportation. Third, if improvement of infrastructure is rep-resented by the increasing of capital stock, investment in telecommunication sector is expected to result higher economic impacts than allocating more budget on the electricity sector.
REFERENCES
Annala, C.N., R.G. Batina, and J.P. Feehan, 2008. “Empirical Impact of Public Infra-structure on the Japanese Economy”. The
Japanese Economic Review, 59 (4),
419-437.
Aschauer, D. A., 1989. “Is Public Expenditure Productive?”. Journal of Monetary
Eco-nomics, 23, 177-200.
Bonaglia, F., Eliana. L., and Marcellino, M. 2000. “Public Capital and Economic Performance: Evidence from Italy”. Mimeo, Bocconi University.
Re-search Working Paper, World Bank, No. 2246.
Canning, D., and P. Pedroni, 1999. “Infra-structure and Long Run Economic Growth”. Presented in North American Summer Meetings of the Econometric So-ciety Conference.
Dumont, J.C., and S. Mesple, 2000. “The Im-pact of Public Infrastructure on Competi-tiveness and Growth: A CGE Analysis Applied to Senegal”. Working Paper. University of Laval, Quebec.
Esfahani, H.S., and M.T. Ramirez, 2003. “In-stitutions, Infrastructure, and Economic Growth”. Journal of Development
Eco-nomics, 70, 443-477.
Estache, A., J.F. Perrault, dan L. Savard, 2007. “Impact of Infrastructure Spending in Mali: A CGE Modelling Approach”.
Working Paper, University of Sherbroke,
No. 07-24.
Hartono, D., and B. P. Resosudarmo, 2008. “The Economy-wide Impact of Control-ling Energy Consumption in Indonesia: An Analysis Using a Social Accounting
Matrix Framework”. Energy Policy, April 2008, 36(4), 1404-1419.
Lofgren, H., R. L. Harris, and S. Robinson, 2002. “A Standard Computable General Equilibrium (CGE) Model in GAMS”. The International Food Policy Research Institute.
Perikesit, D., H. Purwanto, A. Wismadi, and D. Ardianta, 2004. “Assessing the Impacts of Road Infrastructure Investment on Eco-nomic and Regional Development”.
Pre-sented in the 6th IRSA International
Con-ference, Yogyakarta, 13-14 August 2004.
Sridhar, K.S., and V. Sridhar, 2004. “Tele-communications Infrastructure and Eco-nomic Growth: Evidence from Develop-ing Countries”. Working Paper. National Institute of Public Finance and Policy, New Delhi.
Warr, P., J. Menon, and A.A. Yusuf, 2009. “Regional Economic Impacts of Cross-Border Infrastructure: A General Equilib-rium Application to Thailand and Lao PDR”. ADB Working Paper Series on
Re-gional Economic Integration, No. 35.