DETECTING FORESTS DAMAGED BY PINE WILT DISEASE AT THE INDIVIDUAL
TREE LEVEL USING AIRBORNE LASER DATA AND WORLDVIEW-2/3 IMAGES
OVER TWO SEASONS
Y. Takenaka a, M. Katoh a, S. Deng a, K. Cheung a, *
a Institute of Mountain Science, Shinshu University, 8304, Minamiminowa-Village, Kamiina-County, Nagano 399-4598, Japan - (16as406j, mkatoh, deng, 13a2036k)@shinshu-u.ac.jp
Commission III, WG III/1
KEY WORDS: Pine wilt disease, Tree mortality, Airborne laser scanning, WorldView-2, WorldView-3
ABSTRACT:
Pine wilt disease is caused by the pine wood nematode (Bursaphelenchus xylophilus) and Japanese pine sawyer(Monochamus alternatus). This study attempted to detect damaged pine trees at different levels using a combination of airborne laser scanning (ALS) data and high-resolution space-borne images. A canopy height model with a resolution of 50 cm derived from the ALS data was used for the delineation of tree crowns using the Individual Tree Detection method. Two pan-sharpened images were established using the ortho-rectified images. Next, we analyzed two kinds of intensity-hue-saturation (IHS) images and 18 remote sensing indices (RSI) derived from the pan-sharpened images. The mean and standard deviation of the 2 IHS images, 18 RSI, and 8 bands of the WV-2 and WV-3 images were extracted for each tree crown and were used to classify tree crowns using a support vector machine classifier. Individual tree crowns were assigned to one of nine classes: bare ground, Larix kaempferi, Cryptomeria japonica, Chamaecyparis obtusa, broadleaved trees, healthy pines, and damaged pines at slight, moderate, and heavy levels. The accuracy of the classifications using the WV-2 images ranged from 76.5 to 99.6%, with an overall accuracy of 98.5%. However, the accuracy of the classifications using the WV-3 images ranged from 40.4 to 95.4%, with an overall accuracy of 72%, which suggests poorer accuracy compared to those classes derived from the WV-2 images. This is because the WV-3 images were acquired in October 2016 from an area with low sun, at a low altitude.
* Corresponding author
1. INTRODUCTION
Pine wilt disease is expanding in Japan, where it has recently been encroaching on high-altitude and high-latitude areas that had previously been unaffected. This disease is also expanding in East Asia and Western Europe (Abellira et al., 2011; EPPO, 2014). Pine trees infected with pine wilt experience a leaf color change, first to yellowish green and gradually changing from yellow to brown and gray. The extent of damage is therefore typically assessed by examining leaf color from the ground by visual observation. However, this method leads to underestimation, as has been revealed by studies using aerial photographs and satellite images (Osamu, 2010; Isao, 2009).
In this study, we performed crown delineation using an individual tree detection (ITD) method and a canopy height model (CHM) created using airborne laser scanning (ALS) data, which leads to higher accuracy than that obtained by satellite images alone. We then classified the data using a support vector machine (SVM) with the original WorldView (WV)-2/3 bands and intensity–hue–saturation (IHS) and remote sensing indices (RSIs). To classify the trees by the level of damage, it is essential to use both the original bands of the multispectral images and additional information (Waser et al., 2014). Therefore, we used IHS, a color space different from red–green–blue (RGB) and RSIs, as an explanatory variable combining the original bands. IHS and RSIs are also effective
in creating masks for unnecessary objects such as clouds, shadows, and artificial structures.
We then compared the classification accuracy of WV-2 taken in summer and WV-3 taken in autumn, and attempted to determine the increase in damage over time using satellite images from the two seasons.
2. MATERIALS
2.1 Study Area
The eastern area of Matsumoto, central Japan, was selected as the study site. The area of the site was approximately 31 km2. The southern part of the site is considered to have light pine wilt damage, whereas the northern part is considered to have serious damage. The elevation of the site ranges from 550 to 1200 m above sea level. The average precipitation is approximately 1000 mm per year, and the mean annual air temperature is approximately 11.8°C.
2.2 Remote Sensing Data
We used two types of remote sensing data, (1) airborne laser data to delineate tree tops and crowns and (2) satellite images to create masks and classify tree crowns.
The International Archives of the Photogrammetry, Remote Sensing and Spatial Information Sciences, Volume XLII-3/W3, 2017 Frontiers in Spectral imaging and 3D Technologies for Geospatial Solutions, 25–27 October 2017, Jyväskylä, Finland
This contribution has been peer-reviewed.
2.2.1 ALS data and preprocessing: ALS data were acquired in 2013 for nearly all forested regions within the study area. The point density of the collected point clouds was at least 4 points per m2. statistics and filters in ArcGIS 10.0.
2.2.2 WorldView-2/3 images and preprocessing: High-spatial-resolution digital imagery was acquired on June 10 and October 12, 2016, from a WV-2/3 satellite. These satellites collect eight bands of multispectral images and a panchromatic image. The resolution of these images was 1.8 m for multispectral and 0.45 m for panchromatic images.
The images were orthorectified using a 10-m DEM. The multispectral and panchromatic images were then pansharpened using Gram–Schmidt Pan Sharpening in ENVI 5.3. Finally, the WV-3 image was georectified to the WV-2 image.
3. METHODS
3.1 Delineation of Tree Tops and Crowns
The delineation of tree tops and crowns was performed using the CHM data. We first smoothed the CHM data with a Gaussian filter, and then searched for tree tops (local maxima). Finally, we delineated the tree crowns from a watershed algorithm using the obtained tree tops. The center of gravity of a tree crown was designated as a true tree top. In total, 896,453 tree crowns were detected in the study area.
3.2 Explanatory Variables
We extracted a total of 32 variables from each satellite image. These variables included the eight original multispectral bands of each satellite image, two types of IHS image, and 18 RSIs.
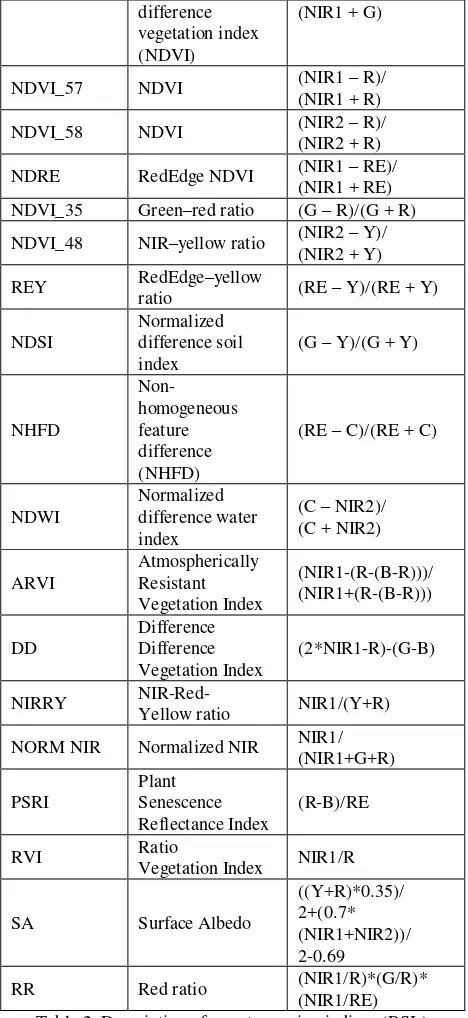
3.2.1 IHS creation: The RGB and RGNIR1 bands were color-transformed to IHS images, which have three channels: intensity (I), hue (H), and saturation (S). All RSIs were calculated from the eight multispectral bands of a satellite image using ENVI 5.3. All IHS images and RSIs used in this study are described in Tables 1 and 2.
Name Bands
Table 1. Description of intensity–hue–saturation (IHS) channels
Abbreviation Name Formula
GNDVI Green normalized (NIR1 – G)/
NORM NIR Normalized NIR NIR1/ (NIR1+G+R) Table 2. Description of remote sensing indices (RSIs)
3.2.2 Masking: The WV-2/3 images contained clouds, shadows, and several artifacts. Because these pixels do not require classification, we created a mask for superfluous pixels. We used the I channel from the RGB-derived IHS data to mask shadows and clouds. Next, we used non-homogeneous feature difference (NHFD) in the RSIs to create a mask of artificial structures. All threshold values for masks used in this study are provided in Table 3.
Summer Autumn
Shadows Intensity < 0.04 Intensity < 0.0675 Clouds 0.12 < Intensity 0.15 < Intensity Artificial
structures NHFD < 0.45 NHFD < 0.45 Table 3. Mask threshold values
The International Archives of the Photogrammetry, Remote Sensing and Spatial Information Sciences, Volume XLII-3/W3, 2017 Frontiers in Spectral imaging and 3D Technologies for Geospatial Solutions, 25–27 October 2017, Jyväskylä, Finland
This contribution has been peer-reviewed.
3.2.3 Extraction: We extracted the means and standard deviations of 32 explanatory variables for all tree crowns. We did not extract explanatory variables from tree crowns that were completely masked. When some tree crown pixels were included in the mask, we extracted explanatory variables only from parts of the tree crown that were not masked.
3.3 Classification
We classified the delineated crowns into nine classes using WV-2 taken in summer. The nine classes were bare ground,
Larix kaempferi, Cryptomeria japonica, Chamaecyparis obtusa, broadleaf trees, healthy pines, and pines damaged at slight, moderate, and heavy levels. A total of 6,523 training areas were created, and classification was then performed using the SVM model trained from these areas. Finally, only healthy pines and three levels of damaged pines were selected.
We then repeated this method to classify healthy pines and three levels of damaged pines with WV-2 images, using WV-3 taken in autumn. A total of 628 training areas were created, and classification was performed using the SVM model trained from these areas.
4. RESULTS
4.1 Classification Accuracy
Among the classification results, we discuss only healthy pines and damaged pines that were the subject of this research.
Table 4 shows the explanation of abbreviations in 4th chapter.
Abbreviation Name
4.1.1 Summer: Table 5 shows the confusion matrix for four classes, including healthy and damaged pines, from the trees classified into nine classes using WV-2 images.
The accuracy of the classifications using the WV-2 images ranged from 86.3 to 100%, with an overall accuracy of 98.3%. Heavy damaged pines were the most accurate among the damaged pine trees. Moderate damaged pines were the least accurate among the damaged trees. The classification accuracy of healthy pines were 100% of user accuracy and 99.8% of producer accuracy, and the accuracy was the highest in these 4 classes.
Table 5. WorldView (WV)-2 confusion matrix
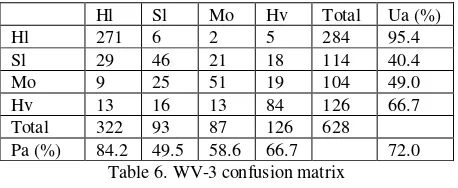
4.1.2 Autumn: Table 6 shows the confusion matrix for the same classes obtained using WV-3 images.
The accuracy of the classifications using the WV-3 images ranged from 40.4 to 95.4%, with an overall accuracy of 72%. Heavy damaged pines were the most accurate among the damaged pine trees. Slight damaged pines were the least accurate among the damaged trees. The classification accuracy of healthy pines were 95.4% of user accuracy and 84.2% of producer accuracy, and the accuracy was the highest in these 4 classes. Table 6. WV-3 confusion matrix
4.2 Difference Over Two Seasons
Table 7 shows the comparison between healthy pines and three levels of damaged pines between summer and autumn.
In this study, since the crown extracted using the same CHM data is used for classification, there is no change in the total amount of trees.
The number of healthy pine trees decreased in autumn. On the other hand, the number of slight, moderate and heavy damaged pine trees increased in autumn.
Number of trees Table 7. Differences in numbers of trees in each damage class
between two seasons
5. CONCLUSIONS
We classified pines in a region affected to varying degrees by pine wilt disease based on a CHM derived from ALS data and explanatory variables from the original WV-2/3 bands, IHS, and RSIs. Using high-resolution satellite images taken during two seasons within the same year, we observed the variation in pine wilt damage in pine trees within the study area. The classification results obtained for summer were more accurate regardless of whether the images were taken in summer or autumn.
Because the field survey data were not sufficiently verified for accuracy, we have only presented the confusion matrices. We used all explanatory variables in the model, and therefore did not select variables for their effectivity. We suggest that further studies will be able to improve on our methods.
The International Archives of the Photogrammetry, Remote Sensing and Spatial Information Sciences, Volume XLII-3/W3, 2017 Frontiers in Spectral imaging and 3D Technologies for Geospatial Solutions, 25–27 October 2017, Jyväskylä, Finland
This contribution has been peer-reviewed.
REFERENCES
Abellira, A., Picpaga, A., Mansilla, J.P., Aguin, O., 2011. Detection of Bursaphelenchus xylophilus, causal agent of pine wilt disease on Pinus pinaster in northwestern Spain, Plant Disease, 95(6), pp. 776.
EPPO, 2014. New outbreak of Bursaphelenchus xylophilus in Spain. Available online: https://gd.eppo.int/reporting/article-18 74 (15 July 2017).
Isao, S., 2009. Development of crown exploration system for pine wilt disease using high-resolution satellite images. Grants in aid for Scientific Research Report, Iwate University, Japan.
Waser, L.T., Küchler, M., Jütte, K., Stampfer, T., 2014. Evaluating the potential of WorldView-2 data to classify tree species and different levels of ash mortality. Remote Sens., 6(5), pp. 4515-4545
Osamu, N., 2010. Pinpoint prevention manual of pine wilt disease damaged trees using recent aerial photography technology - From finding highly accurate damaged trees to complete extermination – Forest Research and Management Organization Tohoku Research Center, Iwate, Japan.
The International Archives of the Photogrammetry, Remote Sensing and Spatial Information Sciences, Volume XLII-3/W3, 2017 Frontiers in Spectral imaging and 3D Technologies for Geospatial Solutions, 25–27 October 2017, Jyväskylä, Finland
This contribution has been peer-reviewed.