The Efficiency of Farmers Group Association on Strengthening
The Institutions of Community Food Distribution Program
Stage in Yogyakarta Special Region 2014
Eny Ivan’s*, Jangkung Handoyo Mulyo, Dwidjono Hadi Darwanto
Department of Agricultural Socio Economics, Faculty of Agriculture, Universitas Gadjah Mada Jln. Flora no. 1, Bulaksumur, Sleman, Yogyakarta 5528, Indonesia
*Corresponding author: [email protected]
ABSTRACT
In protecting and empowering the farmers, farmers group, and farmers group association (Gapoktan) from falling prices of grain and rice at harvest time and food accessibility problems, the government through the Ministry of Agriculture and Food Security Agency implemented the Strengthening the Institutions of Community Food Distribution Program (Strengthening-LDPM). This research was aimed to analyse the level of efficiency and to identify factors influencing the efficiency of Gapoktanin implementing the Strengthening-LDPM by involving 40 Gapoktan post-independence. The data used in this research were primary and secondary data, drawn from stockopname reports in 2014. This research used DEA (Data Envelopment Analysis) analysis, assuming that CRS (Constant Return to Scale) and VRS (Variable Return to Scale) using output-oriented assumptions. In addition, factors affecting the efficiency were analysed using multiple regression OLS (Ordinary Least Square). Based on DEA-CRS approach, as much as 37.5% Gapoktanwere efficient and 62.5% Gapoktanwere inefficient. Whereas with the approach of the DEA-VRS, 50% Gapoktanwere efficient and 50% Gapoktanwere inefficient. The average age of Gapoktan board, total volume of grain or rice sales, total volume of food reserve, and total loan interest affect significantly in increasing the efficiency of Gapoktan in running the strengthening-LDPM Program.
Received: 15
thNovember 2016 ; Revised: 9
thJanuary 2017 ; Accepted: 28
thAugust 2017
INTRODUCTION
Strengthening the Institutions of Community Food Distribution Program is one of the food security programs which is implemented by utilising farmers as the producer. This program was initiated by the Ministry of Agriculture and Food Security Agency to distribute the Social Assistance Fund from State Budget (APBN) to farmers group association (Gapoktan). Strengthening-LDPM aims to protect and empower farmers, farmers group, and/or Gapoktan from falling prices of grain and rice at harvest time, as well as problems of food accessibility.
Arifin (2007) stated that food security was not strong enough if the aspects of availability and acces-sibility were not matched by the aspect of stability. Therefore, the role of price incentive system (rice) and guaranteed prices for farmers at harvest time and guaranteed price affordability for consumers at growing season are still relevant to discuss. Dimensions
of food accessibility are explained by the large proportion of household expenditures on food; the higher it gets, the lower the food security is at households. Gapoktan serves as a gateway institution, connecting village farmers with external institutions, which is expected to drive the agribusiness activities, especially on the distribution unit and food reserves unit. In distribution unit, Gapoktan is expected to conduct purchase-sale of grain or rice by following the standard of the Government Purchase Price (GPP). On the other hand, the existence of Gapoktan is expected to shorten the marketing chain and also improve the feasibility of price received by farmers. In food reserve unit, Gapoktanis encouraged to be able to set aside their products to be kept as a food reserve that can be accessed by its members, especially during the lean season.
On national scale, the Strengthening-LDPM 2015 target was 358 Gapoktan, namely 203 Gapoktanin growth stage, 38 Gapoktanin development stage,
Keywords: DEA, Efficiency, Gapoktan, Strengthening-LDPM
Ilmu Pertanian (Agricultural Science)
Vol. 2 No. 1 April, 2017 : 035-041
and 117 Gapoktan in empowerment stage. The realisation of LDPM total funding amounted to 95.25%, with each stages as follows; 100% for Gapoktanin growth stage, 94.74% for Gapoktanin development stage, and 87.18% for Gapoktan in empowerment stage. According to the Food Security Agency Performance Report (Badan Ketahanan Pangan, 2016), the condition of food reserve in September 2015 in community food barns group amounted to 13,722,036 kg of grain and 1,586,160 million kg of rice. Based on the total value of grain procurement in the amount of 13,722,036 kg dried paddy, 2,529,551 kg dried paddy had been distributed to the members of Gapoktan, so the available stock at the warehouse group amounted to 11,222,201 kg dried paddy. Meanwhile, the total value of rice procurement amounting to 1.58616 million kg have been distributed to members of Gapoktanas many as 883,031 kg, bringing the total reserve stock of rice in Gapoktanbarns or warehouses amounted to 703,129 kg. Seeing these conditions, food needs in the producer region have been met by the Gapoktanitself.
Strengthening-LDPM program grows and develops in societies which have different human resources backgrounds, type and pattern of management, facilities and infrastructure, but given the equal amount of capital of Rp150 million in growth stage and Rp75 million in the development stage. Bailout is given as the stimulus which is expected to give a psychological impact that can affects the formation of prices of grain/rice in the market and to encourage the stabilisation of prices at the level of the wider region. Therefore, it takes a research to the extent of which Gapoktan can contribute in the success of the Strengthening-LDPM program in its region by measuring the efficiency of said Gapoktan.
This research aimed to measure the efficiency of each Gapoktan in Yogyakarta Special Regency which have reached the stage of post-empowerement in the run of Strengthening-LDPM Program. In addition, this research also aimed to determine the factors which could influence Gapoktanefficiency in running the Strengthening-LDPM Program.
MATERIALS AND METHODS
The research was conducted in Yogyakarta Special Region with the amount sample of 40 Gapoktantaken by census. The Gapoktanspreaded over four regency of Bantul, Sleman, Kulon Progo, and Gunungkidul. The data used were primary and
secondary data. Primary data were obtained through interview with the help of questionnaires and secondary data were obtained from the Agency For Food Security and Counseling of Yogyakarta Special Region (DIY).
This research used Data Envelopment Analysis (DEA) to measure the level of Gapoktanefficiency in running the Strengthening-LDPM Program. DEA was a non-parametric method to measure the efficiency of a business unit. DEA did not require a specification function for frontier production and avoid distribution assumption and inefficiency, could be used for multiple input and output, and could identify the best combination of each unit decision makers or companies or organizations (Coelli et al., 1998; Headey et al., 2010).
DEA basic model consisted of two models, i.e. Constant Return to Scale (CRS) and the Variable Return to Scale (VRS). CRS model was a model developed by Charnes, Cooper, and Rhodes (CCR). This model was typically used for companies operating at an optimal scale by applying the concept of Constant Return to Scale (CRS). Meanwhile, the VRS models were models developed by Banker, Charnes, and Cooper (BCC) in 1984. This model used the assumption that it did not require changes in the input and output of a DMU which happened in a linear fashion that allowed the increase and the decrease in the value of efficiency (Coelli, 1998). In other words, the assumption of this model was that the ratio between the input and output additions were not the same. The addition of X times input would not cause the output increased by Y times, could be smaller or larger than X times.
According Talluri (2000), DEA was a multifactor productivity analysis method to measure the relative efficiency of a set of homogeneous decision makers unit. If it was assumed that there are nDMU which had a number of input and output, the relative efficiency score of DMU based on the model proposed by Charnes et al. (1978) was as follows:
Annotation: k= 1 to s, j= 1 to m, i= 1 to n, mount of output k from DMU i, xji= amount of input jfrom DMU i, vk= weight of output k, uj = weight of input j.
The above formula could be converted into a linear form, as in the following program:
The above problem was to find n in the identification of efficiency of all the DMU with DEA calculations which used the CRS approach. Each DMU chose input and output in maximising its efficiency score. In general, a desirable criterion was the efficient DMU if they produced a score of 1. And if the score was less than 1, it meant that it was inefficient. As for DEA with the VRS approach mathematically the formula could be written as follows:
Annotation: yi=M x 1 vector from a number of output for DMU ke-i, xi=K x 1 vector from a number of input for DMU ke-i, Y=N x M matrix from a number of out-put for all DMU N, value and the capital round inout-put and output variables were used to calculate the X=N x K matrix from a number of input for all DMU N, λ=N x 1 vector of weights, θ=scalar.
The variables used in this research consisted of four input variables and four output variables. Input variables consisted of operating cost, incentive cost, amount of capital, and wetland area of the Gapoktan. Whereas, the output variable consisted of the total volume of food reserves, the value of sales, the purchase value, and the capital round. Input and
output variables were used to calculate the efficiency value of each Gapoktanusing DEA output-oriented approach in both CRS and VRS.
The main factors included in the analysis model which affected the Gapoktanefficiency in implementing Strengthening-LDPM consisted of managerial factors and economic factors. The managerial factors were the average of Gapoktanboard and the number of farmers group. The economic factors were the volume of grain or rice sales, the total volume of food reserves, and the total loan interest from food reserve unit. The regression analysis was applied to determine the factors which affected the efficiency by using multiple regression Ordinary Least Square (OLS), which could be formulated as follows:
Annotation: Y = efficiency level, β0 = intercept, β(1-5)= regression coefficient, X1 = the age average of the Gapoktanboard, X2 = amount of farmers group, X3 = total volume of grain or rice sales, X4 = total volume of food reserve, X5 = total of loan interest, e=error terms.
RESULT AND DISCUSSION
Efficiency of GapoktanBeneficiary of Strengthening-LDPM Program in Yogyakarta Special Region in 2014
Efficient Gapoktanin carrying out Strengthening-LDPM Program meant that the Gapoktanhad combined exisiting input and output to produce a maximum output. Gapoktanwas said to be relatively efficient if the obtained value of efficiency was equal to one and inefficient if the obtained value of efficiency was less than one. This research was carried out by observing 40 Gapoktan Strangthening-LDPM beneficiary who had reached the post-empowerement phase
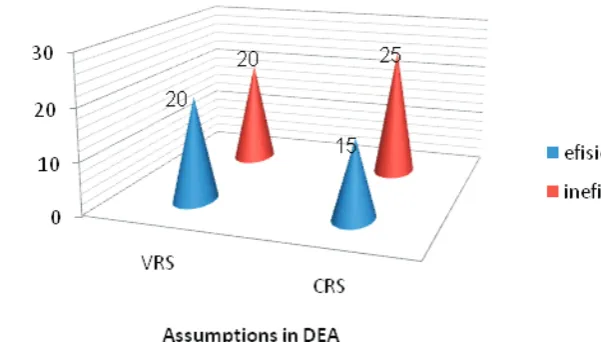
Figure 1. Efficiency Category of Gapoktan Beneficiary of Strengthening-LDPM Program Fund in Yogyakarta Special Region in 2014
Source : The Primary Data Analysis (2016)
which were first post-autonomy to fourth post-empowerement. The data used were the data which came from the stockopname, end of the year 2014 to be exact.
The average value of efficiency through DEA-CRS approach obtained was amounted to 0.753. This calculation results showed that 37.5% of Gapoktanhad been operating efficiently and 62.5% of Gapoktan operating inefficiently during 2014. Meanwhile through the DEA-VRS approach, the value of the average efficiency was equal to 0.811. This calculation result showed that 50% of Gapoktanhad been operating efficiently and 50% Gapoktanoperated on an inefficient scale in 2014 (Figure 1). The value of the lowest efficiency using CRS approach was amounted to 0.203 and while using VRS approach, it was amounted to 0.208. Both of these values were at the lowest efficiency at
Sumber Lestari Gapoktan which was located in Sumberadi Village, Melati, Sleman District.
Research by Ueasin et al. (2015) showed that out of 56 DMU as the sample, only one DMU was efficient, using the DEA-CRS or DEA-VRS approach. The average value of the VRS approach (0.800-0.890) had higher efficiency than the CRS approach (0.700 to 0.790). In a production efficiency case, research by Khoshroo et al. (2013) showed that from the analysis of efficiency using DEA-CRS approach, 18 DMU had been efficient and 23 DMU were inefficient. Meanwhile, by using DEA-VRS approach, it showed that 21 DMU had been efficient and 20 DMU were inefficient. This was because the VRS approach did not require changes in input and output of DMU occurred in a linear fashion, so that allowed the increase and
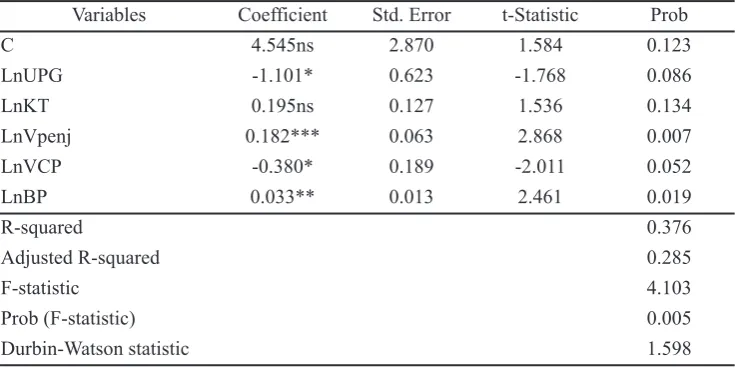
Table 1.DEA-CRS Model CCR version Estimation Result over Efficiency Influencing Factors of GapoktanImplementing the Strengthening-LDPM Program in Yogyakarta Special Region in 2014
Remarks: ***: significant on 99% confidence level (ttable : 2.750); **: significant on 95% confidence level (ttable : 2.042); *: significant on 90% confidence level (ttable : 1.697); ns: not significant. Source: Primary Data Analysis, 2016
Variables Coefficient Std. Error t-Statistic Prob
C 4.545ns 2.870 1.584 0.123
LnUPG -1.101* 0.623 -1.768 0.086
LnKT 0.195ns 0.127 1.536 0.134
LnVpenj 0.182*** 0.063 2.868 0.007
LnVCP -0.380* 0.189 -2.011 0.052
LnBP 0.033** 0.013 2.461 0.019
R-squared 0.376
Adjusted R-squared 0.285
F-statistic 4.103
Prob (F-statistic) 0.005
Durbin-Watson statistic 1.598
Figure 2. RTS Category of Gapoktan Beneficiary of Strengthening-LDPM in Yogyakarta Special Region in 2014
decrease in the value of efficiency (Wahyudi, 2014).
In calculation excess of efficiency using DEA-VRS approach; the position of Return to Scale (RTS) from observed DMU could be known. RTS position could be between the Increasing Return to Scale (IRS), Constant Return to Scale (CRS), or Decreasing Return to Scale (DRS). The calculation results showed that 60% of Gapoktan were at the constant return to scale. Which meant, if the input was added, as many as 60% farmer associations would get the same value equal to the number of the given input. Meanwhile, as much as 40% Gapoktanwere at the increasing return to scale. That was, if the input was added, as many as 40% farmer associations would get a much larger output with optimise the input to improve the efficiency value (Figure 2).
Research by Rotinsulu (2005) showed that the average value of efficiency in increasing returns to scale area carried out by DMU production with a capacity of less than 100 million passenger km per year. Meanwhile, DMU production with a capacity of more than 100 million passenger km per year in decreasing return to scale area.
Determining Factors of Gapoktan’s Efficiency in Yogyakarta Special Region
The variables used for the analysis of the factors affecting efficiency Gapoktanof Strengthening-LDPM program consisted of a managerial and economic variables. Merger of this two variables was aimed to see both of their influence. Previously, the calculation had been done separately between economic and managerial variable, but apprently it showed bad results. On the other hand, previous studies on the second stage related to the analysis of factors affecting the efficiency, many of which used managerial inputs. Therefore, this research wanted to find out what if the economic variable was also included as a variable input used to affect efficiency.
The classic assumption test well using CRS or VRS approach did not reveal any multicolinearity and heteroscedasticity. The correlation value between independent variables showed that a value below 0.8 and variance inflation factor (VIF) value below 10 indicated no multicolinearity (Ghozali, 2009). By using Park and Glejser test, the value of independent variable was not significant at the level of 0.001 and 0.05, which meant there was no heteroscedasticity (Ghozali, 2009). However, a significant number of independent variables used CRS approach more than VRS approach. On the other hand, the value of
adjusted square using CRS approach was higher than the value of the VRS and the standard error using the CRS approach as smaller than the VRS approach. Therefore, a discussion of the factors affecting the efficiency Gapoktanwould then be discussed using CRS approach.
Based on the results of multiple regression analysis (Table 1), it was statistically known that the determination coefficient value (Adjusted R2) was 0.285. This meant that as much as 28.50% of Gapoktanefficiency variation could be explained by the variations of the independent variables in the model. Adjusted R-square value obtained was not much different from the results of research conducted by Saleh (2012), which was only 20%. Statistical test results also showed the calculated F value of 4.103 with 0.005 of significant levele, meaning that simultaneous independent variables significantly affected the efficiency of the Gapoktan.
Partially, value of t-statistic which had a real probability was owned by the age average of Gapoktanboard variable with a confidence level of 95%, total sales volume of grain per rice with a confidence level of 99%, the total volume of food reserves of grain per rice with 95% confidence level, and the amount of loan interest from the food reserve unit with a 99% confidence level. Meanwhile, the amount of farmer group variable did not significantly affect the efficiency in implementing the Gapoktan Strengthening-LDPM Program.
Regression coefficient of the age average of Gapoktanboard had a significant value to Gapoktan efficiency at confidence level of 90% (tstatistic> ttable) with a negative sign. This meant the higher age of Gapoktan board would decrease the efficiency of Gapoktan. If every increase in the age of Gapoktan board was as much as 1 percent, it would decrease the value of efficiency by 1,101 percent in implementing the GapoktanStrengthening-LDPM Program. In this case, the age of the board was related to Gapoktan management capabilities as an organisation which empowered farmers in its management. Age was also related to the productivity performance of the farmers; a higher age was expected to cause the decreasing of productivity performance of both personal and group. It was proven in the field that there were many Gapoktan led by chairmen aged 50 and above. There was even someone at the age of 60 still served as chairman of the Gapoktan.
a positive sign. This meant that higher total sales volume of grain or rice in Gapoktanwould increase the efficiency of Gapoktan. If every increase in total sales volume of Gapoktanwas as much as 1 percent, it would increase the efficiency of Gapoktan in implementing the Strengthening-LDPM Program by 2.868 percent. In this case, more grain or rice sold would further accelerate the capital turnover. However, the constraints on the field were their method of payment using suspension systems which affected the smooth running of the turnover of capital, especially if Gapoktanconfronted with stockopname time. This was because at the time of the stockopname report, financial of Gapoktanfrom Strengthening-LDPM Program must be fully available in the form of cash, rather than goods which were being rotated to customers of Gapoktan.
Regression coefficient of the total food reserves volume had a significant value to the efficiency of Gapoktan at confidence level of 90% (tstatistic > ttable) with a negative sign. This meant that higher total volume of food reserves of grain or rice in Gapoktan would decrease the efficiency of Gapoktan. Every increase in the total volume of food reserves as much as 1 percent would lower the value of efficiency of Gapoktanin implementing the Strengthening–LDPM Program by 2.011 percent. In this case, the volume of food reserves which were piling up in Gapoktan warehouses in a long time could damage the quality of grain or rice. Therefore, in accordance with the guidelines for the implementation of the Gapoktan Strengthening– LDPM Program; it was needed to rotate food reserve at least three months. Volume of food reserves which had already been stored could be substituted for grain or rice from the distribution unit (exchanged), so the goods would always be renewed in Gapoktan warehouses.
Regression coefficient of food reserve unit loan interest had a significant value to the Gapoktan efficiency at confidence level of 95% (tstatistic > ttable) with a positive sign. This meant that higher loan interest obtained by Gapoktanwould increase the efficiency of Gapoktan. Every increase in total loan interest as much as one percent would increase the efficiency of Gapoktan in implementing the Strengthening-LDPM Program by 2.461 percent. In this case, the loan interest received by the Gapoktan would increase the total volume of food reserves so that there was an addition of the traded grain or rice volume.
CONCLUSION
Based on the results showed using DEA-CRS approach, 37.5 percent of Gapoktanwere efficient (0.753) and 62.5 percent of Gapoktanwere inefficient. Meanwhile, using the DEA-VRS approach, 50 percent of Gapoktan were efficient (0.811) and 50 percent were inefficient. According to the efficiency scale, 60 percent of Gapoktanwere in constant return to scale area and 40 percent were in increasing return to scale area. The age average of the Gapoktan board, total volume of grain or rice sales, total volume of food reserve, and total loan interest variables significantly affected in increasing e f f i c i e n c y o f G a p o k t a n i n r u n n i n g t h e s t r e n g t h e n i n g - L D P M P r o g r a m .
REFERENCES
Arifin, B. 2007. Diagnosis Ekonomi Politik Pangan dan Pertanian. Jakarta: PT Raja Grafindo Persada. Badan Ketahanan Pangan. 2016. Laporan Tahunan Badan Ketahanan Pangan Tahun 2015. [pdf] Jakarta: Kementrian Pertanian, Available at : bkp.pertanian.go.id/tinymcpuk/gambar/file/L AKIN_BKP_2016.com.pdf [Accessed 10 October 2016].
Charnes, A., W. W. Cooper, and E. Rhodes. 1978. Measuring The Efficiency of Decision Making Units. European Journal of Operational Research, 2: 429-444.
Coelli, T. J., D. S. P. Rao, C. J. O’Donnell and G. E. Battese. 1998. An Introduction to Efficiency and Productivity Analysis. New York, USA: Springer Second Edition, pp. 162.
Ghozali, I. 2009. Ekonometrika Teori Konsep dan Aplikasi dengan SPSS 17. Semarang: Universitas Diponegoro.
Headey, D., M. Alauddin, and R. D. Prasada. 2010. Explaining Agricultural Productivity Growth: An International Perspective. Agricultural Economics, 41: 1-14.
Khoshroo, A., R. Mulwa, A. Emrouznejadand, and B. Arabi. 2013. A Non-Parametric Data Envelopment Analysis Approach for Improving Energy Efficiency of Grape Product. Journal Energy,63: 189-194.
Rotinsulu, J. F. 2005. Analisis terhadap Nilai Tambah Ekonomik, Bobot Kinerja, dan Efisiensi Relatif PTPN I-XIV Periode Tahun 2002-2004. Tesis. Universitas Gadjah Mada. Saleh, Y., J. H. Mulyo, dan L. R.Waluyati. 2012.
Perdesaan (Studi Kasus di Kabupaten Bantul Tahun 2012). Jurnal Agro Ekonomi, 30 (2): 129-144.
Talluri, S. 2000. Data Envelopment Analysis Models and Extention. Decision Line,31(3): 8-11. Ueasin, N., S-Y. Liao, and A. Wongchai. 2015. The
Technical Efficiency of Rice Husk Power Generation in Thailand: Comparing Data Envelopment Analysis and Stochastic Frontier Analysis. The 7th International Conference on Applied Energy–ICAE2015. Journal Energy Procedia, 75: 2757-2763.