DOI 10.1007/s00374-003-0652-z O R I G I N A L P A P E R
Richard T. Conant · Johan Six · Keith Paustian
Land use effects on soil carbon fractions
in the southeastern United States.
I. Management-intensive versus extensive grazing
Received: 21 March 2003 / Accepted: 3 June 2003 / Published online: 29 July 2003 Springer-Verlag 2003
Abstract Changes in grassland management intended to increase productivity can lead to sequestration of sub-stantial amounts of atmospheric C in soils. Management-intensive grazing (MiG) can increase forage production in mesic pastures, but potential impacts on soil C have not been evaluated. We sampled four pastures (to 50 cm depth) in Virginia, USA, under MiG and neighboring pastures that were extensively grazed or hayed to evaluate impacts of grazing management on total soil organic C and N pools, and soil C fractions. Total organic soil C averaged 8.4 Mg C ha–1 (22%) greater under MiG; differences were significant at three of the four sites examined while total soil N was greater for two sites. Surface (0–10 cm) particulate organic matter (POM) C increased at two sites; POM C for the entire depth increment (0–50 cm) did not differ significantly between grazing treatments at any of the sites. Mineral-associated C was related to silt plus clay content and tended to be greater under MiG. Neither soil C:N ratios, POM C, or POM C:total C ratios were accurate indicators of differences in total soil C between grazing treatments, though differences in total soil C between treatments attributable to changes in POM C (43%) were larger than expected based on POM C as a percentage of total C (24.5%). Soil C sequestration rates, estimated by calcu-lating total organic soil C differences between treatments (assuming they arose from changing grazing management and can be achieved elsewhere) and dividing by duration of treatment, averaged 0.41 Mg C ha–1year–1 across the four sites.
Keywords Carbon sequestration · Pasture · Grazing management
Introduction
Land use and land changes are widely recognized as key drivers of global C dynamics (Houghton et al. 1999; Schimel 1995), but the role of grassland management has only recently received attention as a substantial potential C sink (Conant et al. 2001; Follett et al. 2001; Sampson et al. 2000). A recent literature review concluded that a variety of management practices including irrigation, fertilization, sowing improved grass and legume species, and improved grazing management all promote C sequestration in grasslands (Conant et al. 2001). High rates of C sequestration (0.1–3.0 Mg C ha–1 year–1) coupled with large areas responsive to improved man-agement suggest that 70 Tg C could be sequestered annually in Annex I (developed) countries as a result of changes in grassland management (Sampson et al. 2000). This is more than twice what is likely to be sequestered as a result of land use change (30 Tg C year–1; Watson et al. 2000).
Management-intensive grazing (i.e., MiG, or short rotation grazing) is widely believed to increase grassland forage production by ensuring more uniform forage removal and allowing a recovery period (Gammon 1978). A recent review found that MiG in dry rangelands does not influence forage production, but in more humid regions, forage production increased by 20–30% (Hole-check et al. 1999). There is a long history of using MiG to increase production (Haynes and Neal 1943; Hudson 1929) and in some areas, such as New Zealand and Australia, short rotation grazing is widely used (Gifford et al. 1992). Though pastureland is an important land resource in the southeastern United States, covering more than 12.6 Mha (12% of the total land area) supporting 6.5 million beef cattle and more than 990,000 dairy cows (Census of Agriculture 1992) in 1992, the use of MiG in the southeastern United States is not widespread (Conant R. T. Conant (
)
) · J. Six · K. PaustianNatural Resource Ecology Laboratory, Colorado State University,
Fort Collins, CO 80523-1499, USA e-mail: [email protected] J. Six
Department of Agronomy and Range Science, University of California,
et al. 2002) and potential impacts of MiG adoption on soil C have not been adequately researched.
Short-term changes in soil C in response to changes in grazing management are small relative to the amount of total soil C and may be difficult to detect by measuring bulk changes in soil C. Therefore, physical, chemical, and biological soil C pools have been isolated in an attempt to identify those soil C fractions likely to respond more rapidly than total C to changes in management (e.g., Bardgett and McAlister 1999; Haynes 2000; Sparling 1992). It has been shown that particulate organic matter (POM) C and N provide an early indication of changes in C dynamics and total soil C under different agricultural management practices (Cambardella and Elliott 1992; Six et al. 1999; Wander and Bollero 1999). Likewise, Franzluebbers et al. (2000) found 65% greater POM N content but only a 34% greater total N in a grazed versus hayed bermuda grass pasture and Burke et al. (1999) reported significant differences in coarse POM C and N (>500mm) but no significant differences in total C and N between grazed and ungrazed short grass steppe. Con-versely, the amount of non-POM, or mineral-associated (silt plus clay), C is largely constrained by soil mineral surface area (Hassink and Whitmore 1997). Thus, POM C may serve as a sensitive indicator of changes in soil C that may not be detectable due to inherent soil C variability and relatively small changes relative to total C pool size. The purpose of this research was to assess impacts of implementation of MiG on total organic soil C and N pools and soil C fractions. We collected samples from paired plots at four locations in Virginia for comparison of total organic soil C and N, POM C, and mineral-associated C. Since grasslands allocate substantial por-tions of primary production to lower soil depths, we evaluated differences in total organic soil C and N, and C fractions for surface soils and depth increments to 50 cm. We also evaluated the influence of soil texture on changes in soil C and effects of grazing management on root C stocks. Finally, we evaluated the regional potential for C sequestration due to changes in grazing management.
Materials and methods
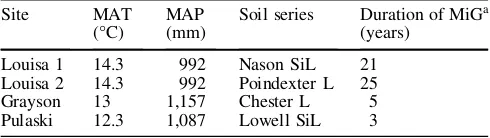
Comparative soil samples were collected from four MiG fields and from four extensively grazed, or hayed, fields in Virginia, USA, located either within the same farm or on a neighboring farm. Slope, aspect, and soil series were uniform across comparative sites, ensuring that land management was the primary factor influencing soil C content. Farm names were derived from the county in which they were located (Table 1). Louisa 1 (38.07N, 78.11W) consists of long term pasture sites on Nason silt loam soil (Typic Hapludult) at two neighboring farms. The field sampled on one farm was under MiG for 25 years preceding sampling while the field on the other farm was extensively managed. Plots at Louisa 2 (38.01N, 78.17W) were both located on the same farm and soil series (Poindexter loam; Typic Hapludalf), but were on fields managed differently. One field had been under MiG for 25 years and the other had been hayed since approximately 1950. Manage-ment intensive grazing was impleManage-mented 5 years prior to sampling at a farm in Grayson County. A neighboring farm (in Carroll County; 36.69N, 80.81W) with the same soil (Chester loam,
Typic Hapludult) and comparable topography had been an exten-sively managed pasture since conversion from forest in the 1950s. The Pulaski site (37.12N, 80.47W) consists of MiG (for the past 3 years) and extensively grazed fields on the same farm. Both fields are underlain by Lowell silt loam soil (Typic Hapludalf) and had been extensively grazed prior to implementation of MiG. Forage species are actively managed at all sites and consisted of orchard grass (Dactylis glomerata), which was the dominant forage cover at all sites, with some Kentucky bluegrass(Poa pratensis) and white clover (Trifolium repens).
Fields with different management were intensively sampled in order to detect differences between sites and also to enable measurement of changes in soil C over time with resampling in the future. Our sampling scheme was based on that used by the Canadian Prairie Soil Carbon Project (Ellert et al. 2001). Within each field three “microsites”, each consisting of six regularly aligned soil cores, were sampled in early spring of 1999. Microsites were always oriented in the same direction, the location of the northeastern-most core was measured using differential GPS, and a relocatable Skotchmark EMS magnetic ball marker (3 M Corpo-ration, Austin, Tex.) was buried at 1-m depth to enable future relocation and resampling.
A Giddings hydraulic soil coring rig was used to collect 6.5-cm diameter soil cores to a depth of 0.5 m. Soil samples were split into four segments (0–10, 10–20, and 20–50 cm), returned to the laboratory, and weighed. Surface litter and aboveground vegetation were separated and quantified. Samples were passed through an 8-mm mesh sieve by gently breaking the soil along the plane of least resistance; all visible root material was removed by hand-picking during the 8-mm sieving. Soils were then air-dried and composited by depth within each microsite (i.e., composites consisted of soil from six individual cores). Bulk density was calculated using volume of sample collected and the weight of soil in the sample; sample weight of fresh samples was corrected for soil moisture and root and rock content.
Composited samples were then sieved to pass a 2-mm sieve, oven-dried at 60 for 72 h, and ground to fine powder using a ball mill (Cianflone Scientific Instruments, Pittsburgh, Pa.). Particulate organic matter and soil particle size distribution were determined according to the method described by Cambardella and Elliott (1992). Briefly, 30 g of 2-mm sieved soil was shaken overnight (18-h) in 100 ml 0.5% hexametaphosphate solution to disperse the soil. The dispersed soil was sieved through a 53-mm sieve and the sand-sized organic material (i.e., POM) retained on the sieve was thoroughly rinsed, transferred to aluminum pans, oven-dried (50C), and weighed. The clay content was then determined by the hydrometer method and silt content by difference. Soil C and N concentration was determined for total soil, POM fraction, and root and surface litter with a LECO CHN-1000 autoanalyzer (LECO Corporation, St. Joseph, Mich.). Addition of strong acid to a subset of samples indicated that carbonates were not present; thus soil C hereafter is used for organic soil C. Mineral-associated C was determined by difference between total C and POM C.
Planned-comparison analysis of variance with Scheffe’s means comparison test was used to test for grazing treatment effects on total soil C, N, root C, litter C, and C in POM and mineral-associated fractions at all four sites. Linear regression was used to evaluate the importance of soil texture on changes in total soil C,
Table 1 Climatic (MAT mean annual temperature, MAP mean annual precipitation) and edaphic characteristics for four compar-ative grazing sites in Virginia, United States
Site MAT
(C)
MAP (mm)
Soil series Duration of MiGa (years)
POM C, and mineral-associated C. Statistical analyses were carried out at all depths and for values summed for the top 50 cm. All statistical tests were performed with SAS (SAS 1985) and differences were considered significant whenP<0.05.
Results
Changes in total and particulate organic matter C by depth
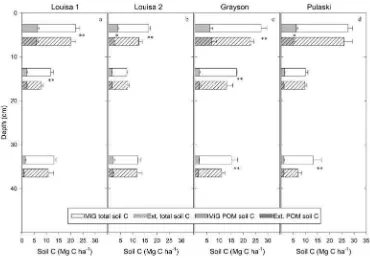
Total soil C was influenced by management at all sites and differences varied across depth increments at the different sites (Fig. 1). Total soil C in the top 10 cm was significantly (P<0.05) greater for MiG than the exten-sively grazed or hayed treatments for three out of the four sites (Fig. 1). Total soil C was greater under MiG than extensive grazing for the 10- to 20-cm increment at the Louisa 1 and Grayson sites and for the 20- to 50-cm increment at the Grayson and Pulaski sites. Total soil C content in the 0- to 10-cm increment normalized per unit depth (i.e. Mg C ha–1 cm–1) was between two and five times that in the 10- to 20-cm and 20- to 50-cm increments, respectively. On average, 50% of the differ-ence in total soil C (for the top 50 cm) between grazing treatments occurred in the top 10 cm; 30% of the difference occurred in the 10- to 20-cm increment and the remainder (20%) in the 20- to 50-cm increment. Patterns for soil N were not substantially different than those observed for soil C (data not shown).
Particulate organic matter C was significantly (P<0.05) different in the top 10 cm between the management treatments at the Louisa 2 and Pulaski sites (Fig. 1). In contrast to some of the observed differences in soil C contents at depth, all differences in POM C at depth were insignificant (P>0.05). Particulate organic matter C
as a portion of total soil C declined with depth, averaging 31% for the 0- to 10-cm increment, 16% for the 10- to 20-cm increment, and 13% for the 20- to 50-20-cm increment. Particulate organic matter C in the top 10 cm was an average of 18% greater under MiG than extensive grazing or hay removal for the four sites, though POM C was less for the MiG treatment at the Grayson site. Interestingly, differences in POM C and soil C between MiG and extensively grazed or hayed treatments in the 0- to 10-cm surface layer do not correspond across all sites. At Louisa 1 and Grayson, a significant difference in soil C but not in POM C was observed (Fig. 1). At Louisa 2, both soil C and POM C significantly differed, but at Pulaski only POM C differed significantly.
Carbon in roots (0–10 cm) tended to be greater under extensively grazed, or hayed, sites than MiG sites, with significant (P<0.05) differences at two of the sites (Table 2). Average root C (and biomass) values for MiG sites ranged from 26% to 54% of those observed for paired extensively grazed or hayed sites. Root C was substantially greater for the two Piedmont sites (Louisa 1 and Louisa 2). Surface litter was significantly less (P<0.05) under MiG than extensively grazed pasture at two sites (Table 2). Surface litter under MiG at these two sites was 89% and 86% less than under extensive grazing for the Louisa 1 and Grayson sites, respectively. The same trend was apparent at the other two sites though differences were smaller and insignificant. Surface litter was always very small compared to total soil C, consisting of, at most, 1% of total soil C in the top 10 cm. Particulate organic matter C comprised between 23% and 31% of total C in the top 10 cm and differences between grazing treatments were insignificant with the exception of the Grayson site (Table 2). However,
Fig. 1a–d Particulate organic matter C (shaded portion of bars) and total C (average with 95% confidence intervals) for three depth increments (0–10, 10–20, and 20–50 cm) at four sites in Virginia, United States.
differences in total POM C content between grazing treatments were occasionally significantly (P<0.05) dif-ferent for the 0- to 10-cm increment (see later), but never for the 0- to 20- or 0- to 50-cm increments. Differences in POM C (0–10 cm) between grazing treatments accounted for 43% of differences in total soil C at the three sites for which POM C was greater with MiG (Louisa 1, Louisa 2, and Pulaski).
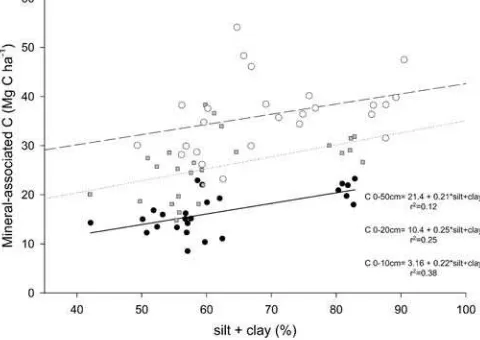
Mineral-associated C content was directly related to the silt plus clay content top 10 cm (r2=0.38; Fig. 2). Similar relationships between mineral C content and silt plus clay content occurred for all depth increments, though coefficients of variation were lower at lower depths and when depth increments were combined (i.e., 0–20 and 0–50 cm). Relative to inter-site differences, silt plus clay contents were relatively consistent within site, but were still somewhat variable. Mineral-associated C comprised a significant, but variable, portion of the difference in total soil C between treatments, averaging 74% across the four sites for the top 10 cm.
Whole profile total C and N and POM C
Total soil C for the top 50 cm was significantly (P<0.05) greater for MiG pastures than for extensively grazed pastures at all three sites with extensively grazed pastures (Table 3). Total soil C averaged 48.3 Mg C ha–1for MiG pastures and 39.5 Mg C ha–1 for extensively grazed, and hayed, pastures, resulting in a 8.8 Mg C ha–1 or 22% greater soil C content under MiG pastures (Table 3). Total
soil C was greater at both of the sites located in the Northern Appalachian Ridges and Valleys Major Land Resource Area (MLRA; Grayson and Pulaski Counties) than those located in the Piedmont MLRA (Louisa 1 and Louisa 2) for both management treatments. In the Northern Appalachian Ridges and Valleys MLRA total soil C averaged 53.2 and 44.0 Mg C ha–1 for MiG and extensively managed pastures, respectively, while total soil C in pastures located in the Piedmont MLRA
Fig. 2 Mineral-associated C versus silt plus clay content of the soil for the 0- to 10- (solid line, solid circles), 0- to 20- (dotted line,
gray squares), and 0- to 50-cm (dashed line, open circles) increments at four comparative grassland management sites in Virginia, United States
Table 3 Root C, total soil C, POM C, POM C as percent of total soil C, and soil C:N for the entire 0- to 50-cm increment for different management treatments at four grassland locations.
Asterisks within a column indicate significant differences (P<0.05) between management treatments
Site Management Root C
(kg C ha–1) Soil C(Mg C ha–1) Soil N(Mg N ha–1) POM C(Mg C ha–1) POM C(% of total) Soil C:N
Louisa 1 MiG 0.63* 46.6* 4.48 9.7 0.19 10.3
Ext. 1.27* 40.4* 4.08 8.5 0.19 9.9
Louisa 2 MiG 0.50* 36.2 4.32 7.3 0.19 8.4
Hay 1.20* 32.2 3.79 5.8 0.18 8.5
Grayson MiG 0.11 59.5* 5.83 10.0 0.16* 9.2
Ext. 0.24 45.1* 5.47 10.2 0.21* 9.5
Pulaski MiG 0.09* 50.9* 6.49* 9.0 0.16 8.8
Ext. 0.35* 42.8* 4.75* 7.4 0.16 7.9
Table 2 Soil silt and clay con-tents (% mass), root C, litter C, particulate organic matter C (POM C) as percent of total soil C, and soil C:N for the 0- to 10-cm increment for different management treatments at four grassland locations.Asterisks within a columnindicate sig-nificant differences (P<0.05) between management treat-ments (MiG management-in-tensive grazing,Ext. extensive)
Site Management Silt (%)
Clay (%)
Root C
(kg C ha–1) Litter C(Mg C ha–1) POM C(% of total) SoilC:N
Louisa 1 MiG 49 7 0.58* 0.05* 31 10.1
Ext. 30 12 1.08* 0.45* 29 9.4
Louisa 2 MiG 46 9 0.43* 0.28 24 9.4
Hay 47 13 1.00* 0.38 20 9.5
Grayson MiG 48 11 0.07 0.04* 23* 9.7
Ext. 41 9 0.27 0.29* 30* 10.6
Pulaski MiG 72 10 0.07 0.13 23 9.4
averaged 41.4 and 36.1 Mg C ha–1 for MiG and extensively managed pastures, respectively.
Differences in soil N (top 50 cm) between MiG and extensively grazed, or hayed, pastures followed the same pattern as differences in soil C (Table 3). Soil N under MiG for the sites in Grayson and Pulaski counties were significantly (P<0.05) greater than under extensive grazing (Table 3). Differences between grazing treat-ments were smaller for N than for C, averaging 14% (0.76 Mg N ha–1).
Root C for the top 50 cm was significantly greater under extensive grazing/haying than MiG at three of the four sites (Table 3), averaging 162% more across all four sites. Particulate organic matter C tended to be slightly greater under MiG, but differences were not significant at any site. Particulate organic matter C as a percent of total C was lower for MiG at the Grayson site, but values were nearly identical under different management treatments at the other three sites. Soil C:N ratios for the top 50 cm were not significantly different between management treatments at any of the sites, though those at the Louisa 1 sites were significantly higher than those at the Louisa 2 site (Table 3).
Discussion
Changes in soil C fractions
Though differences in soil C between management treatments were significant at three of the four sites (for both 0- to 10- and 0- to 50-cm increments), changes in POM and mineral-associated C were significant for the surface soil at only two of the four sites and not significant for the entire sample depth at any sites. Indeed, POM C as a portion of total C was greater under extensive grazing than MiG at one site (Grayson) though both total and POM C were lower. Particulate organic matter C comprises a considerable portion of soil C that decomposes slowly (turnover times in the order of decades; Cambardella and Elliott 1992), is negatively impacted by tillage (Cambardella and Elliott 1992; Chan 1997; Wander and Yang 2000), and could serve as a useful component of a general soil quality index (Gre-gorich et al. 1994). Though the composition and behavior of POM C make it (or the POM:total C ratio) a potential indicator of changes in total C in many situations (Burke et al. 1999; Franzluebbers et al. 2000; Wander et al. 1998), variability in POM C measurements rendered differences insignificant at three of the sites, and POM C was not a good indicator of changes in total soil C under different types of grazing management. However, the portion of the difference between grazing treatments at three of the four sites that is attributable to changes in POM C (43% on average; 0–10 cm) is larger than might be expected based on the amount of total C that is POM (24.5% on average).
Particulate organic matter C content is strongly related to root C inputs (Gale and Cambardella 2000; Wander
and Yang 2000). Therefore, POM C likely comprises a smaller fraction of total soil C at depth due to lower root C inputs which were observed at all sites. Based on these observations, it might be expected that increases in root biomass would precede increases in total soil C. Data from these sites, however, demonstrate the opposite: grazing treatments with lower root C stocks (MiG) had more soil C. This suggests that root turnover and the conversion of litter to soil organic matter was more rapid under MiG, possibly due to plant physiological responses to grazing, changes in soil microclimate, or some other physical or biological response to MiG. Changes in rates of root turnover without corresponding increases in POM C could arise from an increase in the portion of root-derived C inputs to the soil that would not be identified as POM C, such as a shift to finer roots or more root exudates. Alternatively, root dynamics could change so that root-derived C inputs could be measured as POM C but may be readily decomposable and may remain as POM C for a short period of time.
Stabilization of soil organic C by association with mineral soil—silt and clay—particles, is directly related to the silt plus clay content of the soil in a variety of ecosystems (Hassink 1997; Six et al. 2002). At our study sites, the amount of mineral-associated C differed between grazing treatments by nearly 2 Mg C ha–1, yet the higher values observed under MiG were still only about 60% of the amount that could potentially be associated with silt and clay particles present (Hassink 1997; Six et al. 2002). Therefore, these soils may be below their capacity to stabilize soil C by association with mineral particles. These soils may have retained some potential to stabilize soil C in organo-mineral complexes due to past cultivation or the erosive nature of these soils, particularly those in the Piedmont region. If the capacity of silt and clay particles to stabilize C in these soils is not saturated, these soils may be sequestering atmospheric C, regardless of management, at a rate proportional to the rate of stabilization of mineral-associated C.
Changes in total C and C sequestration
limited number of published studies examining the impact of various MiG strategies on soil C suggest that short duration, high intensity grazing leads to the greatest soil C content among different grazing treatments while contin-uous grazing at high intensity results in the lowest soil C contents (Manley et al. 1995; Wood and Blackburn 1984). However, MiG can lead to changes in species composi-tion followed by species-driven decreases in soil C (Dormaar et al. 1997); changes in species composition in response to grazing are common in the semiarid region where these three studies took place (Conant and Paustian 2002). Conversely, species composition in southeastern pastures, comprised mostly of introduced species (Hove-land 2000), is likely to be largely independent of grazing management and, therefore, soil C responses to grazing management are likely to be driven by changes in C inputs to soil due to changes in net primary production (NPP) and biomass allocation.
A surrogate for potential C sequestration rate can be calculated by dividing the difference in soil C between treatments (within a site) by duration of different types of management. When this is done, sequestration rates are very high for the most recently converted sites (Grayson and Pulaski) and smaller for the sites with the longest history of different management (Louisa 1 and Louisa 2). As has been observed at other locations (Conant et al. 2001), these results suggest that C sequestration rates decrease over time, though it must be noted that the largest absolute differences in soil C were observed at the sites that most recently underwent divergent management. Treatment duration-weighted estimates of sequestration rates averaged 0.41 Mg C ha–1 yr–1 for the four sites. However, C sequestration rates estimated for the Grayson and Pulaski sites (2.9 and 2.7 Mg C ha–1 year–1, respectively) are among the highest rates observed following any type of grassland management (Conant et al. 2001). While forage production at the Pulaski site is considerably greater under MiG at these two sites (Glenn Johnson, personal communication), it seems unlikely that estimated soil C sequestration rates could be sustained for a very long period of time. It may be that sites selected for implementation of improved management practices may have been more productive initially and likely had more soil C. Future resampling of the same plots will reveal actual C sequestration rates. Nevertheless, implementa-tion of MiG appears to lead to significant increases in soil C content and sequestration of atmospheric C in soils.
While the benefits of MiG have been documented (Holecheck et al. 2000), it is not widely practiced in the southeastern USA (Conant et al. 2002). Considerable rates of C sequestration with adoption of MiG calculated here coupled with large areas of pasture land (12.6 Mha in 1997; USDA 2002), most of which is grazed extensively, suggest that regional C sequestration could be consider-able. There are notable financial, behavioral, and other barriers to the implementation of MiG systems, but detailed productivity data collected at the Pulaski sites show significantly more efficient use of pasture land and increased farm income for the MiG pasture compared to
the extensively managed pasture. Ongoing research evaluating associated costs and benefits may lead to broader adoption of MiG and sequestration of atmospher-ic C in soils.
AcknowledgementsWe wish to thank Nasheed Smith, Jen Carter, and Sarah Moculeski for assistance in processing and analyzing soil samples. Thanks also to Rick Feete, Alan Graybeal, Gerry Rider, Billy Wayson, and Irvin White for graciously allowing us to collect soil samples in their pastures. Glenn Johnson was instrumental in identifying willing producer participants. Thanks to Jim Hammons, Mark Alley, and the Department of Crop and Soil Environmental Sciences at Virginia Polytechnic Institute and State University for field assistance and use of their Giddings rig. Jeannine Freyman, Louis W. Heidel, and Jim Sawyer assisted with collection of soil samples. This research was funded by grant 826499-01-0 from the Environmental Protection Agency and grant DE-FG03-00ER62997 from the Department of Energy. The comments of three anonymous reviewers are appreciated.
References
Bardgett RD, McAlister E (1999) The measurement of soil fungal:bacterial biomass ratios as an indicator of ecosystem self-regulation in temperate meadow grasslands. Biol Fertil Soils 29:282–290
Burke IC, Lauenroth WK, Riggle R, Brannen P, Madigan B, Beard S (1999) Spatial variability of soil properties in a shortgrass steppe: the relative importance of topography, grazing, mi-crosite, and plant species in controlling spatial patterns. Ecosystems 2:422–438
Cambardella CA, Elliott ET (1992) Particulate soil organic-matter changes across a grassland cultivation sequence. Soil Sci Soc Am J 56:777–783
Census of Agriculture (1992) Ag Census data and software. Department of Commerce, Washington, D.C.
Chan KY (1997) Consequences of changes in particulate organic carbon in vertisols under pasture and cropping. Soil Sci Soc Am J 61:1376–1382
Conant RT, Paustian K (2002) Potential soil carbon sequestration in overgrazed grassland ecosystems. Global Biogeochem Cycles 16:art. no. 1143
Conant RT, Paustian K, Elliott ET (2001) Grassland management and conversion into grassland: effects on soil carbon. Ecol Applic 11:343–355
Conant RT, Paustian K, Elliott ET (2002) Pasture land use in the southeastern US: Implications for C sequestration. In: Lal R, Follet RF, Kimble JM (eds) Agricultural practices and policies for carbon sequestration in soil. CRC Press, Boca Raton, Fla., pp 423–432
Dormaar JF, Adams BW, Willms WD (1997) Impacts of rotational grazing on mixed prairie soils and vegetation. J Range Manage 50:647–651
Drew WB (1947) Floristic composition of grazed and ungrazed prairie vegetation in North-Central Missouri. Ecology 28:26–41 Ellert BH, Janzen HH, McConkey BG (2001) Measuring and comparing soil carbon storage. In: Lal R, Kimble JM, Follett RF, Stewart BA (eds) Measuring and comparing soil carbon storage. CRC Press, Boca Raton, Fla., pp 131–146
Follett RF, Kimble JM, Lal R (2001) The potential of US grazing lands to sequester soil carbon. In: Follett RF, Kimble JM, Lal R (eds) The potential of US grazing lands to sequester soil carbon. CRC Press, Chelsea, Mich., pp 401–430
Gale WJ, Cambardella CA (2000) Root-derived carbon and the formation and stabilization of aggregates. Soil Sci Soc Am J 64:201–207
Gammon DM (1978) A review of experiments comparing systems of grazing management on natural pastures. Grass Soc S Afr Proc 13:75–82
Gifford RM, Cheney NP, Noble JC, Russell JS, Wellington AB, Zammit C, Barson MM (1992) Australian land use, primary production of vegetation and carbon pools in relation to atmospheric carbon dioxide concentration. In: Gifford RM, Barson MM (eds) Australia’s renewable resources: sustainabil-ity and global change. IGBP Australia, Canberra, pp 151–187 Gregorich EG, Carter MR, Angers DA, Monreal CM, Ellert BH (1994) Towards a minimum data set to assess soil organic matter quality in agricultural soils. Can J Soil Sci 74:367–385 Hassink J (1997) The capacity of soils to preserve organic C and N by their association with clay and silt particles. Plant Soil 191:77–87
Hassink J, Whitmore AP (1997) A model of physical protection of organic matter in soils. Soil Sci Soc Am J 61:131–139 Haynes JL, Neal OR (1943) The effect of certain pasture practices
on runoff and production of protective cover. J Am Soc Agron 35:205–211
Haynes RJ (2000) Labile organic matter as an indicator of organic matter quality in arable and pastoral soils in New Zealand. Soil Biol Biochem 32:211–219
Holecheck JL, Gomez H, Molinar F, Galt D (1999) Grazing studies: what we’ve learned. Rangelands 21:12–16
Holecheck JL, Gomes H, Molinar F, Galt D, Valdez R (2000) Short-duration grazing: the facts in 1999. Rangelands 22:18–22 Houghton RA, Hackler JL, Lawrence KT (1999) The U.S. carbon budget: contributions from land-use change. Science 285:574– 578
Hoveland CS (2000) Achievements in management and utilization of southern grasslands. J Range Manage 53:17–22
Hudson AW (1929) Intensive rotational grazing of pastures: various aspects of the system in New Zealand. NZ J Agric Res 39:400– 408
Manley JT, Schuman GE, Reeder JD, Hart RH (1995) Rangeland soil carbon and nitrogen responses to grazing. J Soil Water Conserv 50:294–298
Sampson RN, Scholes RJ, Cerri C, Erda L, Hall DO, Handa M, Hill P, Howden M, Janzen H, Kimble J, Lal R, Marland G, Minami K, Paustian K, Read P, Sanchez PA, Scoppa C, Solberg B, Trossero MA, Trumbore S, Van Cleemput O, Whitmore A, Xu
D, Burrows B, Conant R, Liping G, Hall W, Kaegi W, Reyenga P, Roulet N, Skog KE, Smith GR, Wang Y (2000) Additional human-induced activities—article 3.4. In: Watson RT, Noble IR, Bolin B, Ravindranath NH, Verardo DJ, Dokken DJ (eds) Land use, land-use change, and forestry. Cambridge University Press, Cambridge, pp 180–281
SAS (1985) SAS user’s guide: statistics vers 5 edn. SAS Institute, Cary, N.C.
Schimel DS (1995) Terrestrial ecosystems and the carbon cycle. Global Change Biol 1:77–91
Six J, Elliott ET, Paustian K (1999) Aggregate and soil organic matter dynamics under conventional and no-tillage systems. Soil Sci Soc Am J 63:1350–1358
Six J, Conant RT, Paul EA, Paustian K (2002) Stabilization mechanisms of soil organic matter: Implications for C-satura-tion of soils. Plant Soil 241:155–176
Sparling GP (1992) Ratio of microbial biomass carbon to soil organic carbon as a sensitive indicator of changes in soil organic matter. Aust J Soil Res 30:195–207
USDA (2002) National resources inventory digital data. Natural Resource Conservation Service, Washington, D.C.
Wander MM, Bollero GA (1999) Soil quality assessment of tillage impacts in Illinois. Soil Sci Soc Am J 63:961–971
Wander MM, Yang Z (2000) Influence of tillage on the dynamics of loose- and occluded-particulate and humified organic matter fractions. Soil Biol Biochem 32:1551–1560
Wander MM, Bidart MG, Aref S (1998) Tillage impacts on depth distribution of total and particulate organic matter in three Illinois soils. Soil Sci Soc Am J 62:1704–1711
Watson R, Noble I, Bolin B, Ravindranath NH, Verardo D, Andrasko K, APps M, Brown S, Farqhar G, Goldberg D, Hamburg S, Houghton R, Jarvis P, Karjalainen T, Kheshgi H, Krug T, Kurz W, Lashof D, Lim B, Makundi W, Manning M, Marland G, Masera O, Murdiyarso D, Murray B, Persson R, Sampson N, Sathaye J, Scholes R, Schlamadinger B, Sombroek W, Prisley S, Stone J, Sukumar R, Valentini R (2000) Summary for policymakers. In: Watson RT, Noble IR, Bolin B, Ravin-dranath NH, Verardo DJ, Dokken DJ (eds) Land use, land-use change, and forestry. Cambridge University Press, Cambridge, pp 1–19