LAMPIRAN
Descriptive Statistics
N Minimum Maximum Mean Std. Deviation
Margin Bank(Y) 40 .218 .817 .56505 .118571
Resiko Pembiayaan(X1) 40 .113 .459 .18695 .095940
BOPO(X2) 40 .458 .993 .83234 .108938
Primary Ratio(X3) 40 .345 1.630 .86883 .213882
Opportunity Cost(X4) 40 .224 .727 .48621 .117741
Valid N (listwise) 40
One-Sample Kolmogorov-Smirnov Test
Unstandardized Residual
N 40
Normal Parametersa,,b Mean .0000000
Std. Deviation .07905839
Most Extreme Differences Absolute .096
Positive .096
Negative -.069
Kolmogorov-Smirnov Z .608
Asymp. Sig. (2-tailed) .853
Model Summaryb
Model R R Square
Adjusted R Square
Std. Error of the
Estimate Durbin-Watson
1 .745a .555 .505 .083454 1.429
a. Predictors: (Constant), Opportunity Cost(X4), BOPO(X2), Resiko Pembiayaan(X1), Primary Ratio(X3)
b. Dependent Variable: Margin Bank(Y)
ANOVAb
Model Sum of Squares df Mean Square F Sig.
1 Regression .305 4 .076 10.932 .000a
Residual .244 35 .007
Total .548 39
a. Predictors: (Constant), Opportunity Cost(X4), BOPO(X2), Resiko Pembiayaan(X1), Primary Ratio(X3)
Coefficientsa
a. Dependent Variable: Margin Bank(Y)
Coefficientsa
Model
Unstandardized Coefficients
Standardized
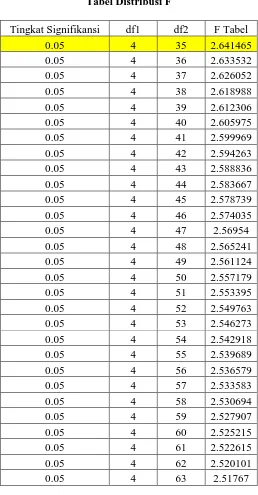
Tabel Distribusi F
Tingkat Signifikansi df1 df2 F Tabel
0.05 4 35 2.641465
Tabel Distribusi T
Derajat Bebas Tingkat Signifikansi T Tabel
35 0.05 2.030108
36 0.05 2.028094
37 0.05 2.026192
39 0.05 2.022691
Margin Bank Risiko Pembiayaan BOPO Primary Ratio Opportunity Cost
0.732 0.1919 0.8349 0.7599 0.717
0.493 0.1341 0.7538 0.7988 0.478
0.504 0.116 0.8259 0.8515 0.489
0.553 0.1378 0.711 0.854 0.538
0.541 0.3137 0.8897 0.7091 0.526
0.729 0.1125 0.8473 0.9407 0.714
0.5 0.321 0.458 0.9666 0.485
0.218 0.352 0.8969 0.3445 0.2242
0.572 0.1644 0.8204 0.8886 0.557
0.488 0.1289 0.8419 0.8437 0.473
0.528 0.1397 0.9196 0.9099 0.513
0.484 0.1402 0.8213 0.8037 0.469