REACTIVITY INSERTION ACCIDENT ANALYSIS OF KARTINI REACTOR
Tegas Sutondo
Staff of the Center for Technology of Accelerator and Material Process, BATAN, Yogyakarta e-mail : [email protected]
Received 12 April 2011, received in revised form 3 Mei 2011, accepted 4 Juni 2011
ABSTRACT
REACTIVITY INSERTION ACCIDENT ANALYSIS OF KARTINI REACTOR. A transient analysis of reactivity insertion accident of Kartini reactor during start up from the minimum critical condition has been performed to estimate the effect on the fuel temperature increase. Two cases of reactivity insertion limits had been assumed in this study i.e. the reactivity insertions were limited by the actuation of overpower trip system (110 %) for the 1st case and by manual scram when the
control rod reached the 100 % UP position, assuming the overpower trip system was failed to function for the 2nd case.
Adiabatic condition was assumed in this study, to get the most severe condition. The result shows that based on the assumed power level of trip setting for the 1st case, the total reactivity insertion was 0.82 $, corresponding to the reactor
period of about 2 s and causing the maximum fuel temperature increase of around 11 o
C or the maximum fuel temperature of 45 oC. For the 2nd case the total reactivity insertion at the trip point was 1.367 $, resulting in the maximum fuel temperature
increase of about 103 oC or maximum fuel temperatur of around 137 oC which is still far below the defined design limit of
1115 oC for transient condition and 700 oC for steady state as well. This result concludes that by limiting the available core
excess of reactivity at reasonably low, it could prevent the fuel from possible of undergoing an excessive temperature increase, during the postulated reactivity insertion accident
.
Keywords: Transient analysis, reactivity insertion, accident, reactor kartini, fuel temperature. ABSTRAK
ANALISIS KECELAKAAN PENYISIPAN REAKTIVITAS PADA REAKTOR KARTINI. Telah dilakukan analisis transient kecelakaan penyisipan reaktivitas pada reaktor Kartini saat start up dari kondisi kritis minimum, untuk memperkirakan pengaruhnya terhadap kenaikan suhu maksimum dari bahan bakar. Dalam kasus ini diasumsikan 2 batas penyisipan reaktivitas yaitu untuk kasus pertama, penyisipan reaktivitas dibatasi oleh reaktor scram akibat aktuasi sistem trip level daya ketika tingkat daya reaktor mencapai batas setting yang ditetapkan (110 %), sedang untuk skenario kedua diasumsikan bahwa sistem trip level daya tidak berfungsi, sehingga reaktor dimatikan secara manual ketika batang kendali telah mencapai posisi UP (100 %). Untuk mendapatkan kondisi yang memberikan dampak terparah maka diasumsikan kondisi adiabatik. Hasil analisis menunjukkan bahwa berdasarkan setting tingkat daya pada sistem trip pada kasus pertama maka diperoleh total penyisipan reaktivitas sebesar 0,82 $ yang sesuai dengan periode reaktor sekitar 2 s, dan hal ini menyebabkan kenaikan suhu bahan bakar maksimum sekitar 11 o
C. Untuk kasus kedua total penyisipan reaktivitasa ketika reaktor scram sebesar 1,367 $, yang memberikan kenaikan suhu teras rerata sebesar 103 o
C atau suhu maksimum bahan bakar sekitar 137 oC yang masih jauh di bawah batas disain untuk kondisi transient sekitar 1115 o C maupun untuk kondisi
tunak sekitar 700 o C. Disimpulkan bahwa dengan membatasi muatan bahan bakar atau reaktivitas lebih teras pada level
yang cukup rendah, maka hal tersebut dapat mencegah kemungkinan terjadinya kenaikan suhu bahan bakar yang berlebihan saat terjadi kecelakaan penyisipan reaktivitas yang dipostulasikan.
Kata kunci: Analisis transient, kecelakaan, penyisipan reaktivitas, reaktor kartini, suhu bahan bakar
INTRODUCTION
artini reactor is one of three research reactors in Indonesia having been operated since March 1979, and has undergone several times of fuel substitution and reshuffling. With the increase of fuel burn up and the changes in core configuration, it is necessary to reevaluate some safety related parameters as to assure the
compliance with the defined operational limit conditions (1, 2). This paper is part of the safety evaluation works of
Kartini reactor being performed aimed at updating the content of safety analyses report (SAR) document. One of important cases needs to be evaluated is the maximum fuel temperature under transient conditions following the
6987
postulated reactivity insertion accident to ensure the integrity of fuel clad. Such a case of accident has never been performed previously.
In this analysis the reactivity insertion accident was simulated by assuming the malfunction of the control rod’s driving system, occurred during rod worth calibration work of the most reactive rod, where the rod button was assumed to be stuck, while being pressed down from its minimum critical condition, with the other rods were in full out position. In this case it was assumed also that the reactor period trip system, limiting the reactivity insertion rate was failed to function, causing the rod to continue moving up until the action of the following two scenarios were in effect:
1. For the 1st case, the power excursion was stopped by the actuation of the overpower trip system, causing
reactor to scram with all of the rods dropped promptly into the core when the power level reached the setting point i.e. 110 % of the nominal power.
2. For the 2nd case, the overpower trip system was assumed to be failed to function, and the power excursion
was stopped by manual scram when the rod reached 100 % up position.
In order to get the most severe condition, an adiabatic approach had been assumed, resulted in the accumulation of heat in the fuel meat. Further the point reactor kinetic equation was used as the basis of the analysis and the analytical approach was used to solve the equations representing the two conditions.
Theoretical Background
Any rod withdrawal from a stable or critical condition would result in the increase of core reactivity that would then be used to increase the reactor power level to a higher, stable condition. The increase of power level would then result in the increase of the fuel temperature, which is proportional to the total energy generated and the heat capacity of the fuels in the core. In case of adiabatic condition, the total energy generated can be represented by the following equation:
T
E(t) = energy generated during the time span of t (watt-s)
P(t) = reactor power as a function of time (watt)
∆T = fuel temperature increase (oC)
C = Heat capacity of all fuels loaded in the core (watt-s/oC)
Based on the point kinetics equation, the general form of power excursion following the insertion of reactivity ρ from a critical condition can be represented as follows (3, 4).
where T1 and T2 = reactor period which can be represented as:
)
P(t) = reactor power (watt) as a function of time t
P0 = initial power level (watt)
β = βeff = effective delayed neutron fraction
ρ = reactivity as a function of time
l = prompt neutron life time (s)
t = time of insertion (s)
λ = decay constant of the delayed neutron precursors (1/s)
The reactivity insertion of the two accident scenarios being studied can be represented by three different models as follows.
1. Positive ramp reactivity insertion with total reactivity ρ < 1 $ 2. Positive ramp reactivity insertion with total reactivity ρ > 1 $
3. Negative step reactivity when reactor trip with total trip reactivity | ρ | >1 $
For the first case, where the rod movement was stopped by the overpower trip system, the total reactivity
inserted (ρ) will be less than 1 $ and hence the 2nd term of equation (2) can be neglected, resulted in the
Equation (4) can also be used for the condition after reactor trip, with a negative step reactivity insertion (| ρ
| >1 $). The reactor period for this case becomes
In this study, the insertion rate γ was assumed to be constant which was taken as the average of insertion rate of the rod being used, and hence the associated reactivity inserted as a function of time of withdrawal in this case will be ρ(t) = γ.t
For the second case, where the control rod moves up until the 100 % out position, the total reactivity
inserted will be equal to the core excess of reactivity available, which in this case ρ > 1$. Hence, the effect of
delayed neutron fraction (β) can be neglected meaning the 1st term of equation (3) can be wiped out. The power
excursion for this case can then be represented by in the following equation
t/T2
Since the prompt neutron lifetime l is so short (~ 10-5 s), the reactor power will then increase very quickly,
followed by the increase of fuel temperature, resulting in the negative feedback reactivity, which will then restrict the power excursion to a new equilibrium state. For the case of adiabatic condition, where the heat generated remains accumulated in the fuel, the “Fuchs – Hansen” model will be well applicable to estimate the total energy generated during transient, following the reactivity insertion (ρ).(3,4) Equation (7) represents the relationship of the energy balance with the reactivity insertion fort his model.
α Δρp
2C. =
E
(7)
with α = negative fuel temperature coefficient (dk/k oC).
Referring to equation (1) and (7) the average increase of core temperature (∆T) can then be determined as
follow:
α =E / C=2Δ
ρ
p T∆
(8)
and the maximum power associated with the reactivity insertion will be:
6987
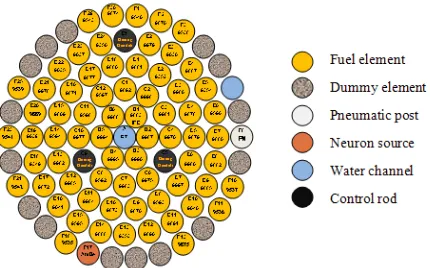
Kartini reactor is a typical design of TRIGA Mark II 250 kW which is then operated at reduced nominal power of 100 kW with 69 fuel elements distributed within ring B to ring F. Some graphite elements are placed at the outermost ring (ring F) to improve the core reactivity. Three control rods (B4C) are used to control the operation i.e. safety and shim rods occupied ring C5 and C9 respectively, and regulating rod placed at ring E1. Figure 1 presents the typical core pattern of Kartini reactor.
Figure 1. Typical core pattern of Kartini reactor
METHODOLOGY
The following described briefly several steps of work performed in this study.
1. Reactivity calibration to evaluate the reactivity of the 3 control rods and the associated core excess of reactivity available for the latest core configuration. The result can then be used to define the control rod to be used for the basis of analysis (i.e. the most reactive one) and the associated average reactivity insertion rate.
2. Determination the reactivity insertion and the associated power level as a function of time of withdrawal, based on the available kinetic parameters and the heat capacity of the standard TRIGA fuel, as presented in Table 1 below. The reactivity insertion limit, and the trip reactivity available for the two cases can then be determined based on the assumed scenarios.
3. Determination of the energy generated during the transient and the associated core average temperature increase for the two cases. The maximum fuel temperature can then be determined by applying the assumed power peaking factor of 2.38 (1) and the intitial temperature.
Table1. Kinetic parameters and the heat capacity of the standard TRIGA fuel(4)
Parameter Value
Reactor Kinetics Parameters
Decay constant: λ (s-1) 0.077
Effective delayed neutron fraction: β 0.007
Prompt neutron life time: l (s) 4.00E-05
Negative temperature reactivity coefficient: α (dk/k oC) 1.200E-04
Average prompt neutron life time: l (s) 6.00E-05
Heat Capacity: Cp
CP volumetric = 2,04 + 4,17x10⁻³ T (W-sec/cm3 oC)
T= fuel temperature ( oC ) : 2.18; T = 34 oC
CP for each fuel (vol = 383,32 cm3 ) (W-sec / oC), 8.363E+02
RESULTS AND DISCUSSION
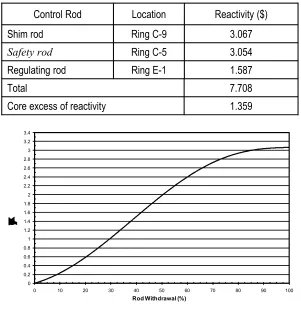
Table 2 presents the result of reactivity measurement of the 3 control rods for the latest core condition, and the associated core excess reactivity. The rod at C-9 (shim rod) seen to be the most reactive one, with total reactivity of 3.067 $, which was then taken as the basis for this study. Figure 2 shows the integral reactivity profile of this rod. Based on the specified rod withdrawal speed and the core height, the average reactivity insertion rate of this rod can then be determined i.e. γ = 0.051 $/s.
Tabel 2. Control rod reactivity and core excess of Kartini reactor
Control Rod Location Reactivity ($)
Shim rod Ring C-9 3.067
Safety rod Ring C-5 3.054
Regulating rod Ring E-1 1.587
Total 7.708
Core excess of reactivity 1.359
0 0.2 0.4 0.6 0.8 1 1.2 1.4 1.6 1.8 2 2.2 2.4 2.6 2.8 3 3.2 3.4
0 10 20 30 40 50 60 70 80 90 100
Reactivity ($)
Rod Withdrawal (%)
Figure 2. Integral reactivity of shim rod
6987
Figure 3. Power excursion and coast down following reactor trip
34
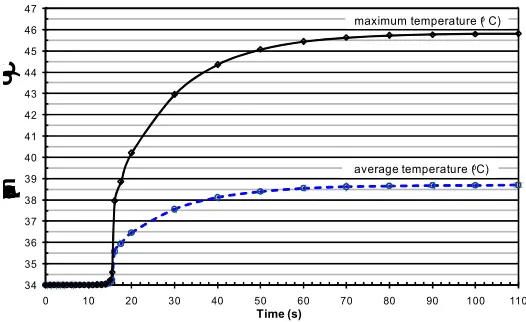
Figure 4. Core average and maximum temperatures during transient
The result indicates that the minimum reactor period at the trip point seen to be about 2 seconds, which is less than the defined setting trip period of 7 seconds. However the energy generated during transient was still
very low, causing not so significant of core temperature increase, i.e. about 5 oC in average or maximum of 11 oC
or maximum fuel temperature of around 45 oC (assuming initial temperature of 34 oC) . This justify that the
defined setting value for the period trip system is conservative enough to limit the power excursion before reaching the defined value of 110 % overpower trip setting. Figure 4 shows the fuel average and maximum temperature profile during transient. The result indicate also that from the fuel temperature limit point of view, the setting point for overpower trip system is conservative enough to protect the fuel integrity due to such transient event.
Tablel 3. Summary of the results
PARAMETER Value
1st Case 2nd Case
Initial reactor power (watt) 1 1
Initial rod position (%) 44 44
Duration of reactivity insertion (s) 16,09 33,8
Change of core reactivity (s) ($) 0,818 1,367
Total rod reactivity inserted ($) 1.049 3.054
Trip reactivity ($) 7.159 7.708
Total energy generated (kWs) 270.78 2491
Maximum transient power (MW) 0.130 26.88
Average core temperature increase (oC) 4.69 43.2
Maximum core temperature increase (oC) 11.2 102.7
Maximum fuel temperature (oC) 45.2 136.7
For the second case, where the rod moved up until full position (100 %), the total reactivity inserted in this case was about 1.367 $ which represents the amount of core excess of reactivity available. The total energy generated for this insertion was 2,491 MWs with the peak power of about 26.88 MW. This would result in the
increase of core average temperature by 43,2 oC or maximum increase of 102.7 oC. By assuming the initial
temperature of 34 oC or the maximum fuel temperature would be of 136.7 oC. This value is still far below the
defined design limit of temperature for both transient and steady state conditions, which is around 1150 oC and
700 oC respectively. This result justify that with the available core excess of reactivity of 1.367 $, would not result in the excessive increase of fuel temperature. Table 3 summarizes the result of the two cases.
CONCLUSION
A transient analysis of reactivity insertion accident of Kartini reactor during start up from the minimum critical condition has been performed to estimate the effect on the fuel temperature increase. Two cases of
reactivity insertion limits was assumed in this study, i.e. for the 1st case the reactivity insertions was limited by
the actuation of overpower trip system whilst for the 2nd case it was limited by manual scram when the rod
reached 100 % of withdrawal position. The result shows that based on the assumed power level trip setting for
the 1st case, the maximum reactivity inserted was 0.82 $, corresponding to the reactor period of about 2 s, and
causing the maximum fuel temperature increase of around 11 oC. The reactor period at this point was about 2 s,
which was below the defined minimum reactor period’s trip setting of 7 s. The result justifies that the defined minimum limit of reactor period’s trip setting was conservative enough to prevent the reactor from further more
serious condition. For the 2nd case the total reactivity insertion at the trip point was 1.367 $ which represents the
available core excess of reactivity, and this resulted in the maximum fuel temperature increase of about 103 oC
or maximum fuel temperature of around 137 oC which was still far below the defined design limit value. This
result concludes that by limiting the available core excess of reactivity at reasonably low could prevent the fuel from possible of undergoing an excessive temperature increase, during the postulated reactivity insertion accident.
REFERENCES
1. ROBERT S. DAUM, SAURIN MAJUMDAR, YUNG LIU AND MICHAEL C. BILLONE, Journal of Nuclear
Science and Technology, Vol. 43, (2006) 1054.
2. SAFETY REPORTS SERIES No. 55, Safety analysis for research reactors. — Vienna: International Atomic Energy Agency (2008).
3. ANDRAŽ PETROVIĆ, MATJAŽ RAVNIK, Physical Model of Reactor Pulse, International Conference Nuclear Energy for New Europe (2004).
4. IAEA, TRIGA Characteristics, December 2004, http://www.ansn.iaea.org/Common/documents/Training/