Copyright
Table of Contents Index
Full Description Reviews
Examples Reader reviews Errata
SVG Essentials
J. David Eisenberg Publisher: O'Reilly
First Edition February 2002 ISBN: 0-596-00223-8, 364 pages
Table of Content
Table of Content ... 2
Dedication ... 6
Preface... 6
Who Should Read This Book?... 6
Who Should Not Read This Book?... 6
If You're Still Reading This... ... 6
About the Examples... 7
Request for Comments... 11
Acknowledgments... 12
Chapter 1. Getting Started... 13
1.1 Graphics Systems... 13
1.2 Scalability ... 15
1.3 SVG's Role... 17
1.4 Creating an SVG Graphic ... 17
Chapter 2. Coordinates... 24
2.1 The Viewport ... 24
2.2 Using Default User Coordinates ... 25
2.3 Specifying User Coordinates for a Viewport... 27
2.4 Preserving Aspect Ratio... 28
2.5 Nested Systems of Coordinates ... 32
Chapter 3. Basic Shapes... 35
3.1 Lines... 35
3.2 Stroke Characteristics ... 35
3.3 Rectangles ... 39
3.4 Circles and Ellipses... 41
3.5 The polygon Element ... 42
3.6 The polyline Element ... 45
3.7 Line Caps and Joins ... 45
3.8 Basic Shapes Reference Summary... 46
Chapter 4. Document Structure... 49
4.1 Structure and Presentation ... 49
4.2 Using Styles with SVG ... 49
4.3 Document Structure – Grouping and Referencing Objects ... 52
Chapter 5. Transforming the Coordinate System ... 60
5.1 The translate Transformation... 60
5.2 The scale Transformation ... 62
5.3 Sequences of Transformations ... 65
5.4 Technique: Converting from Cartesian Coordinates ... 67
5.5 The rotate Transformation ... 69
5.6 Technique: Scaling Around a Center Point ... 71
5.7 The skewX and skewY Transformations ... 72
5.8 Transformation Reference Summary... 73
Chapter 6. Paths ... 74
6.2 Relative moveto and lineto ... 76
6.3 Path Shortcuts ... 76
6.4 Elliptical Arc... 78
6.5 Technique: Converting from Other Arc Formats... 80
6.6 Bézier Curves... 87
6.7 Path Reference Summary... 92
6.8 Paths and Filling ... 93
6.9 The marker element ... 94
6.10 Marker Miscellanea ... 97
Chapter 7. Patterns and Gradients... 99
7.1 Patterns... 99
7.2 Gradients ... 104
7.3 Transforming Gradients and Patterns ... 112
Chapter 8. Text... 114
8.1 Text Terminology ... 114
8.2 Simple Attributes and Properties of the text Element... 115
8.3 Text Alignment ... 117
8.4 The tspan element ... 118
8.5 Setting textLength... 120
8.6 Vertical Text ... 121
8.7 Internationalization and Text ... 122
8.8 Text on a Path ... 125
8.9 Whitespace and Text... 128
8.10 Case Study -- Adding Text to a Graphic... 129
Chapter 9. Clipping and Masking ... 131
9.1 Clipping to a Path... 131
9.2 Masking... 134
9.3 Case Study -- Masking a Graphic ... 137
Chapter 10. Filters... 140
10.1 How Filters Work ... 140
10.2 Creating a Drop Shadow... 141
10.3 Creating a Glowing Shadow ... 143
10.4 The feImage Filter... 147
10.5 The feComponentTransfer Filter ... 147
10.6 The feComposite Filter ... 152
10.7 The feBlend Filter ... 154
10.8 The feFlood and feTile Filters ... 155
10.9 Lighting Effects ... 157
10.10 Accessing the Background... 162
10.11 The feMorphology Element ... 163
10.12 The feConvolveMatrix Element ... 164
10.13 The feDisplacementMap Element... 165
10.14 The feTurbulence Element... 167
10.15 Filter Reference Summary ... 168
Chapter 11. Animating and Scripting SVG ... 172
11.2 How Time Is Measured... 174
11.3 Repeated Action... 176
11.4 The set Element... 177
11.5 The animateColor Element ... 178
11.6 The animateTransform Element ... 178
11.7 The animateMotion Element... 180
11.8 Using Links in SVG... 182
11.9 Scripting SVG... 183
Chapter 12. Generating SVG ... 202
12.1 Using Perl to Convert Custom Data to SVG ... 202
12.2 Using Java to Convert XML to SVG... 207
12.3 Using XSLT to Convert XML Data to SVG ... 225
Chapter 13. Serving SVG Files... 240
13.1 Serving Web Files -- The Task at Hand... 240
13.2 Partitioning the Task ... 241
13.3 Setting up the Server... 255
Appendix A. The XML You Need for SVG... 258
A.1 What Is XML? ... 258
A.2 Anatomy of an XML Document ... 259
A.3 Character Encodings ... 263
A.4 Validity... 265
A.5 XML Namespaces... 267
A.6 Tools for Processing XML... 268
Appendix B. Introduction to Stylesheets ... 270
B.1 Anatomy of a Style... 270
B.2 Style Selectors ... 270
B.3 Internal Stylesheets ... 270
B.4 Style Selector Classes... 271
Appendix C. Programming Concepts ... 277
C.1 Constants ... 277
C.2 Variables... 277
C.3 Assignment and Operators ... 278
C.4 Arrays ... 279
C.5 Comments... 280
C.6 Conditional Statements ... 280
C.7 Repeated Actions... 281
C.8 Functions ... 281
C.9 Objects, Properties, and Methods... 282
C.10 What, Not How ... 284
Appendix D. Matrix Algebra ... 285
D.1 Matrix Terminology... 285
D.2 Matrix Addition... 285
D.3 Matrix Multiplication... 286
D.4 How SVG Uses Matrix Algebra for Transformations ... 288
Appendix E. Creating Fonts... 291
Appendix F. Using SVG with Other XML Applications ... 293
F.1 Referring to an SVG Document in HTML ... 293
F.2 Referring to an SVG Document in XHTML ... 293
F.3 Placing SVG Directly Within XHTML Documents... 293
F.4 Embedding SVG in XSL Formatting Objects ... 295
Colophon... 299
Dedication
To my Mother and my late Father, for their advice and love through the years.
Preface
SVG Essentials introduces you to the Scalable Vector Graphics XML application. SVG, a recommendation from the World Wide Web Consortium, uses XML to describe graphics that are made up of lines, curves, and text. This rather dry definition does not do justice to the scope and power of SVG.
You can add SVG graphics to an Extensible Stylesheet Language Formatting Objects (XSL-FO) document, and convert the combined document to Adobe PDF format for high-quality printouts. Mapmakers and meteorologists are using SVG to create highly detailed graphic images in a truly portable format. All of the diagrams in this book were originally created in SVG before being sent to the art department at O'Reilly. As you learn and use SVG, you're sure to think of new and interesting uses for this emerging technology.
Who Should Read This Book?
You should read this book if you want to: • Create SVG files in a text or XML editor • Create SVG files from existing vector data • Transform other XML data to SVG
• Use JavaScript to manipulate the SVG document object tree • Serve SVG or SVG-source graphics over the Web
Who Should Not Read This Book?
If you simply want to view SVG files, you need only acquire a viewer program or plug-in for the Web, download the files, and enjoy them. There's no need for you to know what's going on behind the scenes unless you wish to satisfy your lively intellectual curiosity. If you wish to create SVG files with a drawing program that has SVG export capability, just read that program's documentation to learn how to use that program feature.
If You're Still Reading This...
introductory chapters — and then put them in the back of the book as appendixes. If you haven't used XML or stylesheets (and this could include some of the technical folks!) or have never programmed, you might want to turn first to the appendixes. A complete list of all the chapters and appendixes with details on what they contain is given later in this preface.
If you're one of the technical types, you definitely need to be aware that this book will not
make you a better artist, any more than a book on word processing algorithms will make you a better writer. This book gives the technical details of scalable vector graphics; to create better art, you need to learn to see, and the book you should read in addition to this one is The New Drawing on the Right Side of the Brain, by Dr. Betty Edwards.
This book gives you the essentials of SVG; if you want to find out all the information, straight from the source, you should go to
http://www.w3.org/Graphics/SVG/Overview.htm8.
About the Examples
All the examples in this book except for those in Chapter 11 have been tested with the Batik SVG viewer on a system running Linux (the Mandrake distribution). The Batik SVG viewer is an application of the software developed by the Apache Software Foundation's Batik project. This cross-platform software is written in Java and is available as open source under the Apache Software License. For full details, visit
http://xml.apache.org/batik/.
Since Batik produces only static output, I could not use it for the examples in Chapter 11. Those examples were tested with the Adobe SVG Viewer. Adobe has been deeply
involved in promoting SVG as a standard, and their viewer, which can be downloaded from http://www.adobe.com/svg/viewer/install/, is a nearly complete implementation of the SVG 1.0 specification. It offers JavaScript and ECMA Script support in Netscape, Internet Explorer, and RealPlayer 8. As of this writing, it is available for Windows and Macintosh OS X. An unsupported Linux version is also available at
http://www.adobe.com/svg/viewer/install/old.html.
Another SVG viewer, also written in Java, is available from Australia's Commonwealth Scientific and Industrial Research Organization (CSIRO) Mathematical and Information Sciences department. This viewer, which has not been updated since December of 2000, is available at http://sis.cmis.csiro.au/svg/. The same group has implemented a subset of SVG for Pocket PCs; it is available for license at
http://www.cmis.csiro.au/sis/SVGpocket.htm.
As you look through the illustrations in this book, you will find that they are utterly lacking in artistic merit. There are reasons for this. First, each example is intended to illustrate a particular aspect of SVG, and it should do so without additional visual
thinks. In an effort to save you from similar distress, the examples are purposely as simple (or simplistic) as possible. As you look at them, your immediate reaction will be: "I can certainly use SVG to draw something that looks far better than this!" You can, and you will.
Organization of This Book
Chapter 1
This chapter gives a brief history of SVG, compares raster and vector graphics systems, and ends with a brief tutorial introducing the main concepts of SVG.
Chapter 2
How do you determine the position of a point in a drawing? Which way is "up?" This chapter answers those questions, showing how to change the system by which coordinates are measured in a graphic.
Chapter 3
This chapter shows you how to construct drawings using the basic shapes available in SVG: lines, rectangles, polygons, circles, and ellipses. It also discusses how to determine the colors for the outline and interior of a shape.
Chapter 4
In a complex drawing, there are elements that are reused or repeated. This chapter tells you how to group objects together so they may be treated as a single entity and re-used. It also discusses use of external images, both vector and raster.
Chapter 5
If you draw a square on a sheet of stretchable material, and stretch the material horizontally, you get a rectangle. Skew the sides of the sheet, and you see a parallelogram. Now tilt the sheet 45 degrees, and you have a diamond. In this chapter, you will learn how to move, rotate, scale, and skew the coordinate system to affect the shapes drawn on it.
Chapter 6
All the basic shapes are actually specific instances of the general concept of a path. This chapter shows you how to describe a general outline for a shape by using lines, arcs, and complex curves.
This chapter adds more to the discussion of color from Chapter 3, discussing how to create a color gradient or a fill pattern.
Chapter 8
Graphics aren't just lines and shapes; text is an integral part of a poster or a schematic diagram. This chapter shows how to add text to a drawing, both in a straight line and following a path.
Chapter 9
This chapter shows you how to use a clipping path to display a graphic as though it were viewed through a circular lens, keyhole, or any other arbitrary shape. It also shows how to use a mask to alter an object's transparency so that it appears to "fade out" at the edges.
Chapter 10
Although an SVG file describes vector graphics, the document is eventually rendered on a raster device. In this chapter, you'll learn how to apply
raster-oriented filters to a graphic to blur an image, transform its colors, or produce lighting effects.
Chapter 11
Since SVG is an XML application, you can use Java and JavaScript to
dynamically control a graphic's attributes. This chapter also shows you how to use SVG's built-in animation capabilities.
Chapter 12
Although you can create an SVG file from scratch, most people will have existing vector data or XML data that they wish to display in graphic form. This chapter discusses the use of programming languages such as Java, Perl, and XSLT to create SVG from these data sources.
Chapter 13
This chapter shows a servlet that transforms XML to SVG, and then to PNG format, for delivery to browsers that do not have SVG viewer plug-ins.
Appendix A
Appendix B
You can use stylesheets to apply visual properties to particular elements in your SVG document. These are exactly the same kind of stylesheets that can be used with HTML documents. If you've never used stylesheets before, you'll want to read this brief introduction to the anatomy of a stylesheet.
Appendix C
If you're a graphic designer who hasn't done much programming, you'll want to find out what programmers are talking about when they throw around words like "object model" and "function."
Appendix D
To fully understand coordinate transformations and filter effects in SVG it's helpful, though not necessary, to understand matrix algebra, the mathematics used to compute the coordinates and pixels. This appendix highlights the basics of matrix algebra.
Appendix E
TrueType fonts represent glyphs (characters) in a vector form. This appendix shows you how to take your favorite fonts and convert them to paths for use in SVG documents.
Appendix F
Since SVG is an application of XML, it can work with other XML applications. This appendix shows you how to put SVG into XHTML and XSL Formatting Objects.
Conventions Used in This Book
Italic
Is used to introduce new terms, as well as for email and URL addresses.
Constant width
Is used for code examples and fragments. Constant width bold
Constant width italic
Is used for replaceable elements in code examples. This is a note.
This is a warning.
This book uses callouts to denote "points of interest " in code listings. A callout is shown as a white number in a black circle; the corresponding number after the listing gives an explanation. Here's an example:
Roses are red,
Violets are blue. [1] Some poems rhyme;
This one doesn't. [2]
[1]
Violets actually have a color value of #9933cc.
[2]
This poem uses the literary device known as a "surprise ending."
Request for Comments
Please address comments and questions concerning this book to the publisher:
O'Reilly & Associates, Inc. 1005 Gravenstein Highway North Sebastopol, CA 95472
(800) 998-9938 (in the United States or Canada) (707) 829-0515 (international/local)
(707) 829-0104 (fax)
We have a web page for this book where we list errata, examples, or any additional information. You can access this page at:
http://www.oreilly.com/catalog/svgess
To comment or ask technical questions about this book, send email to:
http://www.oreilly.com
Acknowledgments
I'd like to thank Simon St.Laurent, the editor of this book, for his guidance and comments, which were always right on the mark. He also told me in an email, "we already know that you know how to write," which is one of the nicest things anyone has ever told me. Thanks also to Edd Dumbill, who wrote the document which I modified only slightly to create Appendix A. Of course, any errors in that appendix have been added by my modifications.
Thanks also go to Antoine Quint and to David Klaphaak and the SVG Quality Engineering team at Adobe, who did the technical review of the manuscript. Your comments have helped improve many aspects of this book.
Jeffrey Zeldman is the person who first put the idea in my head that I, too, could write a book, and for that I thank him most sincerely.
Chapter 1. Getting Started
SVG, which stands for Scalable Vector Graphics, is an application of XML that makes it possible to represent graphic information in a compact, portable form. Interest in SVG is growing rapidly, and tools to create and view SVG files are already available from major companies. This chapter begins with a description of the two major systems of computer graphics, and describes where SVG fits into the graphics world. The chapter concludes with a brief example that uses many of the concepts that we will explore in detail in the following chapters.
1.1 Graphics Systems
The two major systems for representing graphic information on computers are raster and vector graphics.
1.1.1 Raster Graphics
In raster graphics, an image is represented as a rectangular array of picture elements or pixels (see Figure 1-1). Each pixel is represented either by its RGB color values or as an index into a list of colors. This series of pixels, also called a bitmap, is often stored in a compressed format. Since most modern display devices are also raster devices, displaying an image requires a viewer program to do little more than uncompress the bitmap and transfer it to the screen.
Figure 1-1. Raster graphic rectangle
1.1.2 Vector Graphics
In a vector graphic system, an image is described as a series of geometric shapes (see
Figure 1-2). Rather than receiving a finished set of pixels, a vector viewing program receives commands to draw shapes at specified sets of coordinates.
If you think of producing an image on graph paper, raster graphics work by describing which squares should be filled in with which colors. Vector graphics work by describing the grid points at which lines or curves are to be drawn. Some people describe vector graphics as a set of instructions for a drawing, while bitmap graphics (rasters) are points of color in specific places. Vector graphics "understand" what they are — a square
"knows" it's a square and text "knows" that it's text. Because they are objects rather than a series of pixels, vector objects can change their shape and color, whereas bitmap graphics cannot. Also, all text is searchable because it really is text, no matter how it looks or how it is rotated or transformed.
Another way to think of raster graphics is as paint on canvas, while vector graphics are lines and shapes made of a stretchable material which can be moved around on a background.
1.1.3 Uses of Raster Graphics
Raster graphics are most appropriate for use with photographs, which are rarely
composed of distinct lines and curves. Scanned images are often stored as bitmaps; even though the original may be "line art," we want to store the image as a whole and don't care about its individual components. A fax machine, for example, doesn't care what you've drawn; it simply transmits pixels from one place to another in raster form.
Tools for creating images in raster format are widespread and generally easier to use than many vector-based tools. There are many different ways to compress and store a raster image, and the internal representation of these formats is public. Program libraries to read and write images in compressed formats such as JPEG, GIF, and PNG are widely
available. These are some of the reasons that web browsers have, until the arrival of SVG, supported only raster images.
1.1.4 Uses of Vector Graphics
Vector graphics are used in:
• Computer Assisted Drafting (CAD) programs, where accurate measurement and the ability to zoom in on a drawing to see details are essential
• The Adobe PostScript printing and imaging language; every character that you print is described in terms of lines and curves
• The vector-based Macromedia Flash system for designing animations, presentations, and web sites
Because most of these files are encoded in binary format or as tightly packed bitstreams, it is difficult for a browser or other user agent to parse out embedded text, or for a server to dynamically create vector graphic files from external data. Most of the internal
representations of vector graphics are proprietary, and code to view or create them is not generally available.
1.2 Scalability
Although they are not as popular as raster graphics, vector graphics have one feature that makes them invaluable in many applications — they can be scaled without loss of image quality. As an example, here are two drawings of a cat. Figure 1-3 was made with raster graphics; Figure 1-4 is a vector image. Both are shown as they appear on a screen that displays 72 pixels per inch.
Figure 1-3. Raster image of cat
Figure 1-4. Vector image of cat
When a display program zooms in on the raster graphic, it must find some way to expand each pixel. The simplest approach to zooming in by a factor of four is to make each pixel four times as large. The results, shown in Figure 1-5, are not particularly pleasing.
Although it is possible to use techniques such as edge-detection and anti-aliasing to make the expanded image more pleasing, these techniques are time-consuming. Furthermore, since all the pixels in a raster graphic are equally anonymous, there's no guarantee that an algorithm can correctly detect edges of shapes. Anti-aliasing results in something like
Figure 1-6.
Figure 1-6. Expanded anti-aliased raster image
Expanding a vector image by a factor of four, on the other hand, merely requires the display program to multiply all the coordinates of the shapes by four and redraw them at the full resolution of the display device. Thus, Figure 1-7, which is also a screenshot from a 72 dot per inch screen, shows crisp, clear edges on the lines with significantly less of the stair-step effects of the expanded raster image.
1.3 SVG's Role
In 1998, the World Wide Web Consortium formed a working group to develop a representation of vector graphics as an XML application. Because SVG is an XML application, the information about an image is stored as plain text, and it brings the advantages of XML's openness, transportability, and interoperability.
CAD and graphic design programs often store drawings in a proprietary binary format. By adding the ability to import and export drawings in SVG format, applications gain a common, standard format for interchanging information.
Since it is an XML application, SVG cooperates with other XML applications. A mathematics textbook, for example, could use XSL Formatting Objects for explanatory text, MathML to describe equations, and SVG to generate the graphs for the equations. The SVG working group's specification is an official World Wide Web Consortium Recommendation. Some applications such as Adobe Illustrator and Jasc WebDraw export drawings in SVG format. On the Web, SVG viewer plug-ins let users view presentations with many of the same scripting and animation capabilities that Flash has. Since the SVG files are XML, text in the SVG display is available to any user agent that can parse XML.
1.4 Creating an SVG Graphic
1.4.1 Document Structure
We start Example 1-1 with the standard XML processing instruction and DOCTYPE
declaration. The root <svg> element defines the width and height of the finished graphic in pixels. The <title> element's content is available to a viewing program for use in a title bar or as a tooltip pointer, and the <desc> element lets you give a full description of the image.
Example 1-1. Basic structure of an SVG document
<?xml version="1.0"?>
<!DOCTYPE svg PUBLIC "-//W3C//DTD SVG 1.0//EN"
"http://www.w3.org/TR/2001/REC-SVG-20010904/DTD/svg10.dtd">
<svg width="140" height="170"> <title>Cat</title>
<desc>Stick Figure of a Cat</desc> <!-- the drawing will go here -—> </svg>
1.4.2 Basic Shapes
We draw the cat's face by adding a <circle> element. The element's attributes specify the center x-coordinate, center y-coordinate, and radius. The (0,0) point is the upper left corner of the picture. x coordinates increase as you move horizontally to the right; y
coordinates increase as you move vertically downwards.
The circle's location and size are part of the drawing's structure. The color in which it is drawn is part of its presentation. As is customary with XML applications, we want to separate structure and presentation for maximum flexibility. Presentation information is contained in the style attribute. Its value will be a series of presentation properties and values, as described in Appendix B, in Section B.1. We'll use a stroke color of black for the outline, and a fill color of none to make the face transparent. The SVG is shown in
Example 1-2, and its result in Figure 1-8.
Example 1-2. Basic shapes -- circle
<?xml version="1.0"?>
<!DOCTYPE svg PUBLIC "-//W3C//DTD SVG 1.0//EN"
"http://www.w3.org/TR/2001/REC-SVG-20010904/DTD/svg10.dtd">
<svg width="140" height="170"> <title>Cat</title>
<desc>Stick Figure of a Cat</desc>
<circle cx="70" cy="95" r="50" style="stroke: black; fill: none" />
</svg>
1.4.3 Specifying Styles as Attributes
Now we add two more circles for the eyes in Example 1-3. Although their fill and stroke colors are really part of the presentation, SVG does allow you to specify them as
individual attributes. In this example we specify the fill and stroke colors as two separate attributes rather than inside a style attribute. You probably won't use this method often; we'll discuss it further in Chapter 4, in Section 4.2.4. We've put it here just to prove that it can be done. The results are shown in Figure 1-9.
The <?xml ...?> and <?DOCTYPE?> have been omitted to save space in the listing.
Example 1-3. Basic shapes -- filled circles
<svg width="140" height="170"> <title>Cat</title>
<desc>Stick Figure of a Cat</desc>
<circle cx="70" cy="95" r="50" style="stroke: black; fill: none" />
<circle cx="55" cy="80" r="5" stroke="black" fill="#339933" /> <circle cx="85" cy="80" r="5" stroke="black" fill="#339933" />
</svg>
Figure 1-9. Stage two -- face and eyes
1.4.4 Grouping Graphic Objects
Example 1-4 adds the whiskers on the right side of the cat's face with two <line>
elements. We want to treat these whiskers as a unit (you'll see why in a moment), so we enclose them in the <g> grouping element, and give it an id. A line is specified by giving the x- and y-coordinates for its starting point (x1 and y1) and ending point (x2 and y2). The result is displayed in Figure 1-10.
Example 1-4. Basic shapes -- lines
<title>Cat</title>
<desc>Stick Figure of a Cat</desc>
<circle cx="70" cy="95" r="50" style="stroke: black; fill: none;" /> <circle cx="55" cy="80" r="5" stroke="black" fill="#339933" />
<circle cx="85" cy="80" r="5" stroke="black" fill="#339933" />
<g id="whiskers">
<line x1="75" y1="95" x2="135" y2="85" style="stroke: black;" /> <line x1="75" y1="95" x2="135" y2="105" style="stroke: black;" />
</g>
</svg>
Figure 1-10. Stage three -- right whiskers
1.4.5 Transforming the Coordinate System
Now we will <use> the whiskers group, and transform them into the left whiskers.
Example 1-5 first flips the coordinate system by multiplying the x-coordinates by
negative one in a scale transformation. This means that the point (75, 95) is now located at at the place which would have been (-75, 95) in the original coordinate system. In the new scaled system, coordinates increase as you move left. This means we have to
translate (move) the coordinate system 140 pixels right, the negative direction, to get them where we want them as shown in Figure 1-11.
Example 1-5. Transforming the coordinate system
<svg width="140" height="170"> <title>Cat</title>
<desc>Stick Figure of a Cat</desc>
<circle cx="70" cy="95" r="50" style="stroke: black; fill: none;" /> <circle cx="55" cy="80" r="5" stroke="black" fill="#339933" />
<circle cx="85" cy="80" r="5" stroke="black" fill="#339933" /> <g id="whiskers">
<line x1="75" y1="95" x2="135" y2="85" style="stroke: black;" /> <line x1="75" y1="95" x2="135" y2="105" style="stroke: black;" />
</g>
<use xlink:href="#whiskers" transform="scale(-1 1) translate(-140 0)" />
</svg>
The transform attribute's value lists the transformations, one after another, separated by whitespace.
1.4.6 Other Basic Shapes
Example 1-6 constructs the ears and mouth with the <polyline> element, which takes pairs of x- and y-coordinates as the points attribute. You separate the numbers with either blanks or commas as you please. The result is in Figure 1-12.
Example 1-6. Basic shapes -- polylines
<svg width="140" height="170"> <title>Cat</title>
<desc>Stick Figure of a Cat</desc>
<circle cx="70" cy="95" r="50" style="stroke: black; fill: none;" /> <circle cx="55" cy="80" r="5" stroke="black" fill="#339933" />
<circle cx="85" cy="80" r="5" stroke="black" fill="#339933" /> <g id="whiskers">
<line x1="75" y1="95" x2="135" y2="85" style="stroke: black;" /> <line x1="75" y1="95" x2="135" y2="105" style="stroke: black;" />
</g>
<use xlink:href="#whiskers" transform="scale(-1 1) translate(-140 0)” />
<!— ears -->
<polyline points="108 62, 90 10, 70 45, 50, 10, 32, 62" style="stroke: black; fill: none;" />
<!-- mouth -->
<polyline points="35 110, 45 120, 95 120, 105, 110" style="stroke: black; fill: none;" />
</svg>
1.4.7 Paths
All of the basic shapes are actually shortcuts for the more general <path> element, which
Example 1-7 uses to add the cat's nose. The result is in Figure 1-13. This element has been designed to make specifying a path, or sequence of lines and curves, as compact as possible. The path in Example 1-7 translates, in words, to: "Move to coordinate (75,90). Draw a line to coordinate (65,90). Draw an elliptical arc with an x-radius of 5 and a
y-radius of 10, ending back at coordinate (75,90)."
Example 1-7. Paths
<svg width="140" height="170"> <title>Cat</title>
<desc>Stick Figure of a Cat</desc>
<circle cx="70" cy="95" r="50" style="stroke: black; fill: none;" /> <circle cx="55" cy="80" r="5" stroke="black" fill="#339933" />
<circle cx="85" cy="80" r="5" stroke="black" fill="#339933" /> <g id="whiskers">
<line x1="75" y1="95" x2="135" y2="85" style="stroke: black;" /> <line x1="75" y1="95" x2="135" y2="105" style="stroke: black;" />
</g>
<use xlink:href="#whiskers" transform="scale(-1 1) translate(-140 0)" />
<!-- ears -->
<polyline points="108 62, 90 10, 70 45, 50, 10, 32, 62" style="stroke: black; fill: none;" />
<!-- mouth -->
<polyline points="35 110, 45 120, 95 120, 105, 110" style="stroke: black; fill: none;" />
<!-- nose -->
<path d="M 75 90 L 65 90 A 5 10 0 0 0 75 90" style="stroke: black; fill: #ffcccc" />
</svg>
Figure 1-13. Stage six -- nose
1.4.8 Text
element, the x and y attributes which specify the text's location are part of the structure. The font family and font size are part of the presentation, and thus part of the style
attribute. Unlike the other elements we've seen, <text> is a container element, and its content is the text we want to display. Figure 1-14 shows the final result.
Figure 1-14. Stage seven -- text and finished image
Example 1-8. Text
<svg width="140" height="170"> <title>Cat</title>
<desc>Stick Figure of a Cat</desc>
<circle cx="70" cy="95" r="50" style="stroke: black; fill: none;" /> <circle cx="55" cy="80" r="5" stroke="black" fill="#339933" />
<circle cx="85" cy="80" r="5" stroke="black" fill="#339933" /> <g id="whiskers">
<line x1="75" y1="95" x2="135" y2="85" style="stroke: black;" /> <line x1="75" y1="95" x2="135" y2="105" style="stroke: black; " />
</g>
<use xlink:href="#whiskers" transform="scale(-1 1) translate(-140 0)" />
<!-- ears -->
<polyline points="108 62, 90 10, 70 45, 50, 10, 32, 62" style="stroke: black; fill: none;" />
<!-- mouth -->
<polyline points="35 110, 45 120, 95 120, 105, 110" style="stroke: black; fill: none;" />
<!-- nose -->
<path d="M 75 90 L 65 90 A 5 10 0 0 0 75 90" style="stroke: black; fill: #ffcccc" />
<text x="60" y="165" style="font-family: sans-serif; font-size: 14pt; stroke: none; fill: black;">Cat</text>
</svg>
Chapter 2. Coordinates
The world of SVG is an infinite canvas. In this chapter, we'll discuss how you tell a viewer program which part of this canvas you're interested in, what its dimensions are, and how you locate points within that area.
2.1 The Viewport
The area of the canvas that your document intends to use is called the viewport. You establish the size of this viewport with the width and height attributes on the <svg>
element. The values of these attributes can be simply a number, which is presumed to be in pixels; this is said to be specified in user coordinates. You may also specify width and
height as a number followed by a unit identifier, which can be one of the following:
em
The font size of the default font, usually equivalent to the height of a character
ex
The height of the letter x
px
Pixels
pt
Points (1/72 of an inch) pc
Picas (1/6 of an inch) cm
Centimeters
mm
Millimeters
in
<svg width="200" height="150"> <svg width="200px" height="200px">
Both of these specify an area 200 pixels wide and 150 pixels tall.
<svg width="2cm" height="3cm">
Specifies an area two centimeters wide and three centimeters high.
<svg width="2cm" height="36pt">
It is possible, though unusual, to mix units; this element specifies an area two centimeters wide and thirty-six points high.
If you have one <svg> element nested within another <svg> element, the nested tag may also specify its width and height as a percentage, measured in terms of the enclosing element. We will see nested <svg> elements in Section 2.5.
2.2 Using Default User Coordinates
When you do not use unit specifiers on your <svg> element, the viewer sets up a
coordinate system where the horizontal, or x-coordinate, increases as you go to the right, and the vertical, or y-coordinate, increases as you move vertically downward. The upper left corner of the viewport is defined to have an x- and y-coordinate of zero.[1] This point, written as (0, 0) is also called the origin. The coordinate system is a pure geometric system; points have neither width nor height, and the grid lines are considered infinitely thin. We'll return to this subject in Chapter 3.
[1]
In this book, we will specify a pair of x- and y-coordinates in parentheses, with the
x-coordinate first. Thus, (10, 30) represents an x-coordinate of 10 and a y-coordinate of 30.
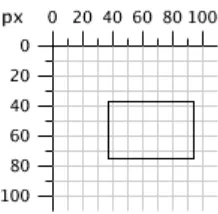
Example 2-1 establishes a viewport two hundred pixels wide and two hundred pixels high, then draws a rectangle whose upper left corner is at coordinate (10, 10) with a width of 50 pixels and a height of 30 pixels.[2]Figure 2-1 shows the result, with rulers and a grid to show the coordinate system.
[2] To save space, we are leaving out the <?xml ...?> and <!DOCTYPE ...> lines. These are set in stone, so you can take them for granite.
Example 2-1. Using default coordinates
<svg width="200" height="200">
<rect x="10" y="10" width="50" height="30" style="stroke: black; fill: none;" /> </svg>
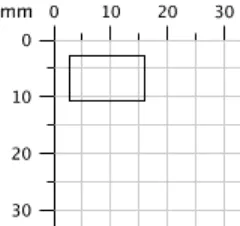
Even if you don't specify units in the viewport, you may still use them in some SVG shape elements, as we do in Example 2-2. Figure 2-2 shows the result, with rulers and a grid to show the coordinate system.
Example 2-2. Explicit use of units
<svg width="200" height="200">
<rect x="10mm" y="10mm" width="15mm" height="10mm" style="stroke:black; fill:none;" />
</svg>
Specifying units in the <svg> element does not affect coordinates given without units in other elements. Example 2-3 shows a viewport set up in millimeters, but the rectangle is still drawn at pixel (user) coordinates, as you see in Figure 2-3.
Example 2-3. Units on the svg element
<svg width="70mm" height="70mm">
<rect x="10" y="10" width="50" height="30" style="fill: none; stroke: black;" /> </svg>
Figure 2-2. Rectangle using explicit units
2.3 Specifying User Coordinates for a Viewport
In the examples so far, numbers without units have been considered to be pixels. Sometimes this is not what you want. For example, you might want to set up a system where each user coordinate represents one-sixteenth of a centimeter. (We're using this coordinate system to prove a point, not to show a paragon of good design.) In this system, a square that is 40 units by 40 units will display as 2.5 centimeters on a side.
To accomplish this effect, you set the viewBox attribute on the <svg> element. The value of this attribute consists of four numbers that represent the minimum x-coordinate, minimum y-coordinate, width, and height of the user coordinate system that you want to superimpose on the viewport.
So, to set up the sixteen-units-per-centimeter coordinate system for a four centimeter by five centimeter drawing, you'd use this starting tag:
<svg width="4cm" height="5cm" viewBox="0 0 64 80">
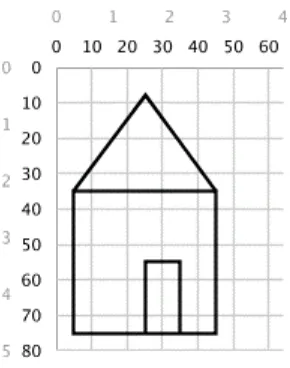
Example 2-4 lists the SVG for a picture of a house, displayed using the new coordinate system.
Example 2-4. Using a viewBox
<svg width="4cm" height="5cm" viewBox="0 0 64 80"> <rect x="10" y="35" width="40" height="40"
style="stroke: black; fill: none;" /> <!-- roof -->
<polyline points="10 35, 30 7.68, 50 35" style="stroke:black; fill: none;" /> <!-- door -->
<polyline points="30 75, 30 55, 40 55, 40 75" style="stroke:black; fill: none;" />
</svg>
Figure 2-4. New user coordinates
The numbers you specify for the value of the viewBox attribute may be separated by commas or whitespace. If either the width or height is zero, none of your graphic will display. It is an error to specify a negative value for the viewBox width or height.
2.4 Preserving Aspect Ratio
In the previous example, the aspect ratio, or ratio of width to height, of the viewport and the viewBox were identical (4/5 = 64/80). What happens, though, if the aspect ratio of the viewport and the viewBox are not the same, as in this example, where viewBox has an aspect ratio of one to one, but the viewport has an aspect ratio of one to three? <svg width="45px" height="135px" viewBox="0 0 90 90">
There are three things that SVG can do in this situation:
• Scale the graphic uniformly according to the smaller dimension so the graphic will fit entirely into the viewport. In the example, the picture would become half its original width and height. We'll show you examples of this in Section 2.4.2. • Scale the graphic uniformly according to the larger dimension and cut off the
parts that lie outside the viewport. In the example, the picture would become one and a half times its original width and height. We'll show you examples in Section 2.4.3.
viewport perfectly, but you must now decide whether the image meets (is aligned with) the top, middle, or bottom of the 135-pixel viewport height.
In the second case, since the image will be larger than the viewport in one dimension, you must specify which area is to be sliced away. In the example, the picture will be scaled uniformly to a width and height of 135 pixels. Now the height of the graphic fits the viewport perfectly, but you must decide whether to slice off the right side, left side, or both edges of the picture to fit within the 45-pixel viewport width.
2.4.1 Specifying Alignment for preserveAspectRatio
The preserveAspectRatio attribute lets you specify the alignment of the scaled image with respect to the viewport, and whether you want it to meet the edges or be sliced off. The model for this attribute is:
preserveAspectRatio="alignment [meet | slice]"
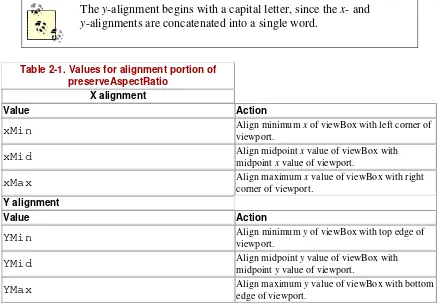
where alignment specifies the axis and location, and is one of xMinYMin, xMinYMid, xMinYMax, xMidYMin, xMidYMid, xMidYMax, xMaxYMin, xMaxYMid, or xMaxYMax. This alignment specifier is formed by concatenating an x-alignment and a y-alignment as shown in Table 2-1. The default value for preserveAspectRatio is xMidYMid meet.
The y-alignment begins with a capital letter, since the x- and
y-alignments are concatenated into a single word.
Table 2-1. Values for alignment portion of preserveAspectRatio
X alignment
Value Action
xMin Align minimum x of viewBox with left corner of viewport.
xMid Align midpoint x value of viewBox with midpoint x value of viewport.
xMax Align maximum x value of viewBox with right corner of viewport.
Y alignment
Value Action
YMin Align minimum y of viewBox with top edge of viewport.
YMid Align midpoint y value of viewBox with midpoint y value of viewport.
So, if you want to have the picture with a viewBox="0 0 90 90" fit entirely within a viewport that is 45 pixels wide and 135 pixels high, aligned at the top of the viewport, you would write:
<svg width="45px" height="135px" viewBox="0 0 90 90" preserveAspectRatio="xMinYMin meet">
In this case, since the width fits precisely, the x-alignment is irrelevant; you could equally well use xMidYmin or xMaxYMin. However, in the interests of consistency, it's usually best to make both specifiers the same when only one axis is affected.
This is all fairly abstract; here are some concrete examples that show you how the combinations of alignment and meet and slice interact with one another.
2.4.2 Using the meet Specifier
The starting <svg> tags in Example 2-5 all use the meet specifier.
Example 2-5. Use of meet specifier
<!-- tall viewports -->
<svg preserveAspectRatio="xMinYMin meet" viewBox="0 0 90 90" width="45" height="135">
<svg preserveAspectRatio="xMidYMid meet" viewBox="0 0 90 90" width="45" height="135">
<svg preserveAspectRatio="xMaxYMax meet" viewBox="0 0 90 90" width="45" height="135">
<!-- wide viewports -->
<svg preserveAspectRatio="xMinYMin meet" viewBox="0 0 90 90" width="135" height="45">
<svg preserveAspectRatio="xMidYMid meet" viewBox="0 0 90 90" width="135" height="45">
<svg preserveAspectRatio="xMaxYMax meet" viewBox="0 0 90 90" width="135" height="45">
Figure 2-5 shows where the reduced image fits into the enclosing viewBox.
2.4.3 Using the slice Specifier
Figure 2-6 shows the use of the slice specifier to eliminate parts of the picture that do not fit in the viewport. They were created with the <svg> tags in Example 2-6.
Example 2-6. Use of slice specifier
<!-- tall viewports -->
<svg preserveAspectRatio="xMinYMin slice" viewBox="0 0 90 90" width="45" height="135">
<svg preserveAspectRatio="xMidYMid slice" viewBox="0 0 90 90" width="45" height="135">
<svg preserveAspectRatio="xMaxYMax slice" viewBox="0 0 90 90" width="45" height="135">
<!-- wide viewports -->
<svg preserveAspectRatio="xMinYMin slice" viewBox="0 0 90 90" width="135" height="45">
<svg preserveAspectRatio="xMidYMid slice" viewBox="0 0 90 90" width="135" height="45">
<svg preserveAspectRatio="xMaxYMax slice" viewBox="0 0 90 90" width="135" height="45">
2.4.4 Using the none Specifier
Finally, there is the third option for scaling a graphic when the viewBox and viewPort
don't have the same aspect ratio. If you specify preserve- AspectRatio="none", then the graphic will be scaled non-uniformly so that its user coordinates fit the viewport.
Figure 2-7 shows such a "fun-house mirror" effect produced with the <svg> tags in
Example 2-7.
Example 2-7. Aspect ratio not preserved
<!-- tall viewport -->
<svg preserveAspectRatio="none" viewBox="0 0 90 90" width="45" height="135">
<!-- wide viewport -->
<svg preserveAspectRatio="none" viewBox="0 0 90 90" width="135" height="45">
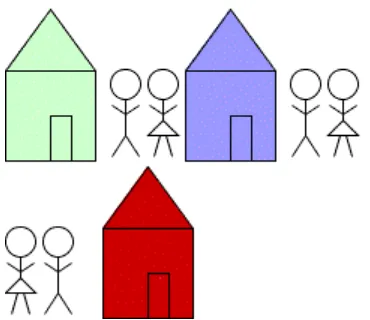
Figure 2-7. Aspect ratio not preserved
You can establish a new viewport and system of coordinates at any time by putting another <svg> element into your document. The effect is to create a "mini-canvas" upon which you can draw. We used this technique to create illustrations such as Figure 2-5. Rather than drawing the rectangles, then rescaling and positioning the cat inside each one (the brute force approach), we took these steps:
• Draw the blue rectangles on the main canvas
• For each rectangle, define a new <svg> element with the appropriate
preserveAspectRatio attribute
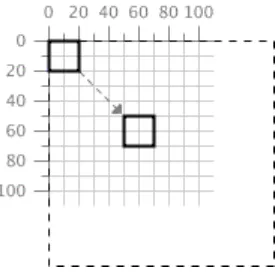
• Draw the cat into that new canvas (with <use>), and let SVG do the heavy lifting Here's a simplified example that shows a circle on the main canvas, then inside a new canvas that's outlined by a blue rectangle that's also on the main canvas. Figure 2-8 is the result we wish to achieve.
Figure 2-8. Nested viewport example
First, generate the SVG for the main coordinate system and the circle. Note that we've established the user coordinates to coincide exactly with the viewport in this document.
<svg width="200px" height="200px" viewBox="0 0 200 200">
<circle cx="25" cy="25" r="25" style="stroke: black; fill: none;" /> </svg>
The result is in Figure 2-9.
Figure 2-9. Circle in main viewport
Now, draw the boundary of the box showing where we want the new viewport to be:
<svg width="200px" height="200px" viewBox="0 0 200 200">
<circle cx="25" cy="25" r="25" style="stroke: black; fill: none;" /> <rect x="100" y="5" width="30" height="80"
style="stroke: blue; fill: none;" />
</svg>
Figure 2-10. Circle and boundary box in main viewport
Now, add another <svg> element for the new viewport. In addition to specifying the
viewBox, width, height, and preserveAspectRatio specification, you may also specify the x and y attributes — in terms of the enclosing <svg> element — where the new viewport is to be established. (If you don't give values for x and y, they are presumed to be zero.)
<svgwidth="200px" height="200px" viewBox="0 0 200 200">
<circle cx="25" cy="25" r="25" style="stroke: black; fill: none;"/> <rect x="100" y="5" width="30" height="80"
style="stroke: blue; fill: none;" />
<svg x="100px" y="5px" width="30px" height="80px" viewBox="0 0 50 50" preserveAspectRatio="xMaxYMax meet">
</svg>
</svg>
Setting up the new coordinates with this nested <svg> element doesn't change the visual display, but it does permit you to add the circle in that new system, producing the result shown in Figure 2-8.
<svg width="200px" height="200px" viewBox="0 0 200 200">
<circle cx="25" cy="25" r="25" style="stroke: black; fill: none;"/> <rect x="100" y="5" width="30" height="80" style="stroke: blue; fill: none;"/>
<svg x="100px" y="5px" width="30px" height="80px" viewBox="0 0 50 50" preserveAspectRatio="xMaxYMax meet">
<circle cx="25" cy="25" r="25" style="stroke: black; fill: none;"/>
Chapter 3. Basic Shapes
Once a coordinate system is established in the <svg> tag, you are ready to begin drawing. In this chapter, we will show the basic shapes you can use to create the major elements of most drawings: lines, rectangles, polygons, circles, and ellipses.
3.1 Lines
SVG lets you draw a straight line with the <line> element. Just specify the x- and
y-coordinates of the line's endpoints. Coordinates may be specified without units, in which case they are considered to be user coordinates, or with units such as em, in, etc. as described in Chapter 2, in Section 2.1. The SVG in Example 3-1 draws several lines; the reference grid in Figure 3-1 is not part of the SVG that you see here.
<line x1="start-x" y1="start-y" x2="end-x" y2="end-y">
Example 3-1. Basic lines
<svg width="200px" height="200px" viewBox="0 0 200 200"> <!-- horizontal line -->
<line x1="40" y1="20" x2="80" y2="20" style="stroke: black;" />
<!-- vertical line -->
<line x1="0.7cm" y1="1cm" x2="0.7cm" y2="2.0cm" style="stroke: black;" />
<!-- diagonal line -->
<line x1="30" y1="30" x2="85" y2="85" style="stroke: black;" /> </svg>
Figure 3-1. Basic lines
3.2 Stroke Characteristics
3.2.1 stroke-width
As mentioned in Chapter 2, the canvas grid lines are infinitely thin. Where, then, does a line or stroke fall in relation to the grid line? The answer is that the grid line falls in the center of a stroke. Example 3-2 draws some lines where the stroke width has been set to ten user coordinates to make the effect obvious. The result, in Figure 3-2, has the grid lines drawn in so you can see the effect clearly.
Example 3-2. Demonstration of stroke-width
<svg width="200px" height="200px" viewBox="0 0 200 200">
<!-- horizontal line -->
<line x1="30" y1="10" x2="80" y2="10"
style="stroke-width: 10; stroke: black;" />
<!-- vertical line -->
<line x1="10" y1="30" x2="10" y2="80"
style="stroke-width: 10; stroke: black;" />
<!-- diagonal line -->
<line x1="25" y1="25" x2="75" y2="75"
style="stroke-width: 10; stroke: black;" /> </svg>
Figure 3-2. Demonstration of stroke-width
3.2.2 stroke Color
You can specify the stroke color in a variety of ways:
• One of the color keyword names: aqua, black, blue, fuchsia, gray, green,
lime, maroon, navy, olive, purple, red, silver, teal, white, and yellow. • A six-digit hexadecimal specifier in the form #rrggbb, where rr is the red
component, gg is the green component, and bb is the blue component in the range 0-ff.
• A three-digit hexadecimal specifier in the form #rgb, where r is the red
0-f. This is a shorthand form of the previous method of specifying color. To produce the six-digit equivalent, each digit of the short form is duplicated; thus
#d6e is the same as #dd66ee.
• An rgb specifier in the form rgb(red-value,green-value,blue-value), where each value is in the range 0-255 or a percentage in the range 0% to 100%.
Example 3-3 uses all of these methods, with the colorful results of Figure 3-3. It is also possible to use one of the color keywords listed in section 4.2 of the SVG specification at http://www.w3.org/TR/SVG/types.html#ColorKeywords, or one of the CSS 2 system color keywords as listed at
http://www.w3.org/TR/REC-CSS2/ui.html#system-colors
Example 3-3. Demonstration of stroke color
<svg width="200px" height="200px" viewBox="0 0 200 200"> <!-- red -->
<line x1="10" y1="10" x2="50" y2="10"
style="stroke: red; stroke-width: 5;" />
<!-- light green -->
<line x1="10" y1="20" x2="50" y2="20"
style="stroke: #9f9; stroke-width: 5;" />
<!-- light blue -->
<line x1="10" y1="30" x2="50" y2="30"
style="stroke: #9999ff; stroke-width: 5;" />
<!-- medium orange -->
<line x1="10" y1="40" x2="50" y2="40"
style="stroke: rgb(255, 128, 64); stroke-width: 5;" />
<!-- deep purple -->
<line x1="10" y1="50" x2="50" y2="50"
style="stroke: rgb(60%, 20%, 60%); stroke-width: 5;" /> </svg>
Figure 3-3. Demonstration of stroke color
3.2.3 stroke-opacity
one is completely opaque. A value less than zero will be changed to zero; a value greater than one will be changed to one. Example 3-4 varies the opacity from 0.2 to 1 in steps of 0.2, with the result in Figure 3-4.
Example 3-4. Demonstration of stroke-opacity
<svg width="200px" height="200px" viewBox="0 0 200 200"> <line x1="10" y1="10" x2="50" y2="10"
style="stroke-opacity: 0.2; stroke: black; stroke-width: 5;" />
<line x1="10" y1="20" x2="50" y2="20"
style="stroke-opacity: 0.4; stroke: black; stroke-width: 5;" />
<line x1="10" y1="30" x2="50" y2="30"
style="stroke-opacity: 0.6; stroke: black; stroke-width: 5;" />
<line x1="10" y1="40" x2="50" y2="40"
style="stroke-opacity: 0.8; stroke: black; stroke-width: 5;" />
<line x1="10" y1="50" x2="50" y2="50"
style="stroke-opacity: 1.0; stroke: black; stroke-width: 5;" />
</svg>
Figure 3-4. Demonstration of stroke-opacity
3.2.4 stroke-dasharray attribute
If you need dotted or dashed lines, use the stroke-dasharray attribute, whose value consists of a list of numbers, separated by commas or white- space, specifying dash length and gaps. The list should have an even number of entries, but if you give an odd number of entries, SVG will repeat the list so the total number of entries is even. (See the last instance in Example 3-5.)
Example 3-5. Demonstration of stroke-dasharray
<svg width="200px" height="200px" viewBox="0 0 200 200"> <!-- nine-pixel dash, five-pixel gap -->
<line x1="10" y1="10" x2="100" y2="10" style="stroke-dasharray: 9, 5;
stroke: black; stroke-width: 2;" />
<line x1="10" y1="20" x2="100" y2="20" style="stroke-dasharray: 5, 3, 9, 2; stroke: black; stroke-width: 2;" />
<!-- Odd number of entries is duplicated; this is equivalent to:
nine-pixel dash, three-pixel gap, five-pixel dash, nine-pixel gap, three-pixel dash, five-pixel gap --> <line x1="10" y1="30" x2="100" y2="30"
style="stroke-dasharray: 9, 3, 5; stroke: black; stroke-width: 2;" /> </svg>
Figure 3-5 shows the results, zoomed in for clarity.
Figure 3-5. Demonstration of stroke-dasharray
3.3 Rectangles
The rectangle is the simplest of the basic shapes. You specify the x- and y-coordinates of the upper left corner of the rectangle,[1] its width, and its height. The interior of the rectangle is filled with the fill color you specify. If you do not specify a fill color, the interior of the shape is filled with black. The fill color may be specified in any of the ways described in Section 3.2.2, or it may take the value none to leave the interior unfilled and thus transparent. You may also specify a fill-opacity in the same format as you did in Section 3.2.3. Both fill and fill-opacity are presentation properties, and belong in the style attribute.
[1]
Technically, the x value is the smaller of the x-coordinate values and the y is the smaller of the y-coordinate values of the rectangle's sides in the current user coordinate system. Since we are not yet using transformations, which we will cover in Chapter 5, this is the moral equivalent of the upper left corner.
After the interior is filled (if necessary), the outline of the rectangle is drawn with strokes, whose characteristics you may specify as you did for lines. If you do not specify a stroke, the value none is presumed, and no outline is drawn. Example 3-6 draws several
variations of the <rect> element. Figure 3-6 shows the result, with a grid for reference.
Example 3-6. Demonstration of the rectangle element
<svg width="200px" height="200px" viewBox="0 0 200 200"> <!-- black interior, no outline -->
<!-- no interior, black outline -->
<rect x="50" y="10" width="20" height="40" style="fill: none; stroke: black;" />
<!-- blue interior, thick semi-transparent red outline --> <rect x="10" y="70" width="25" height="30"
style="fill: #0000ff;
stroke: red; stroke-width: 7; stroke-opacity: 0.5;" />
<!-- semi-transparent yellow interior, dashed green outline --> <rect x="50" y="70" width="35" height="20"
style="fill: yellow; fill-opacity: 0.5;
stroke: green; stroke-width: 2; stroke-dasharray: 5 2" /> </svg>
Figure 3-6. Demonstration of the rect element
Since the strokes that form the outline "straddle" the abstract grid lines, the strokes will be half inside the shape and half outside the shape. Figure 3-7, a closeup of the semi-transparent red outline drawn in Example 3-6, shows this clearly.
Figure 3-7. Closeup of transparent border
If you do not specify a starting x or y value, it is presumed to be zero. If you specify a
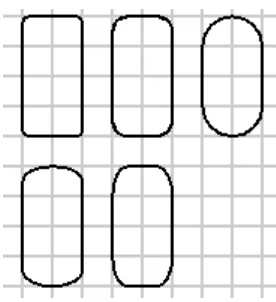
3.3.1 Rounded Rectangles
If you wish to have rectangles with rounded corners, specify the x- and y-radius of the corner curvature. The maximum number you may specify for rx (the x-radius) is one-half the width of the rectangle; the maximum value of ry (the y-radius) is one-half the height of the rectangle. If you specify only one of rx or ry, they are presumed to be equal.
Example 3-7 shows various combinations of rx and ry.
Example 3-7. Demonstration of rounded rectangles
<svg width="200px" height="200px" viewBox="0 0 200 200"> <!-- rx and ry equal, increasing -->
<rect x="10" y="10" width="20" height="40" rx="2" ry="2" style="stroke: black; fill: none;" />
<rect x="40" y="10" width="20" height="40" rx="5" style="stroke: black; fill: none;" />
<rect x="70" y="10" width="20" height="40" ry="10" style="stroke: black; fill: none;" />
<!-- rx and ry unequal -->
<rect x="10" y="60" width="20" height="40" rx="10" ry="5" style="stroke: black; fill: none;" />
<rect x="40" y="60" width="20" height="40" rx="5" ry="10" style="stroke: black; fill: none;" />
</svg>
Figure 3-8 shows the result, with a grid in the background for reference.
Figure 3-8. Demonstration of rounded rectangles
3.4 Circles and Ellipses
To draw a circle, use the <circle> element and specify the center x-coordinate, center
is to fill the circle with black and draw no outline unless you specify some other combination of fill and stroke.
An ellipse also needs an x-radius and a y-radius in addition to a center x- and y-coordinate. The attributes for these radii are named rx and ry.
In both circles and ellipses, if the cx or cy is omitted, it is presumed to be zero. If the radius is zero, no shape will be displayed; it is an error to provide a negative radius.
Example 3-8 draws some circles and ellipses which are shown in Figure 3-9.
Example 3-8. Demonstration of circles and ellipses
<svg width="200px" height="200px" viewBox="0 0 200 200">
<circle cx="30" cy="30" r="20" style="stroke: black; fill: none;" /> <circle cx="80" cy="30" r="20"
style="stroke-width: 5; stroke: black; fill: none;" />
<ellipse cx="30" cy="80" rx="10" ry="20" style="stroke: black; fill: none;" /> <ellipse cx="80" cy="80" rx="20" ry="10" style="stroke: black; fill: none;" /> </svg>
Figure 3-9. Demonstration of circle and ellipse elements
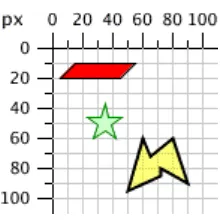
3.5 The polygon Element
In addition to rectangles, circles, and ellipses, you may want to draw hexagons, octagons, stars, or arbitrary closed shapes. The <polygon> element lets you specify a series of
points that describe a geometric area to be filled and outlined as described earlier. The
points attribute consists of a series of x- and y-coordinate pairs separated by commas or whitespace. You must give an even number of entries in the series of numbers. You don't have to return to the starting point; the shape will automatically be closed. Example 3-9
uses the <polygon> element to draw a parallelogram, a star, and an irregular shape.
Example 3-9. Demonstration of the polygon element
<svg width="200px" height="200px" viewBox="0 0 200 200"> <!-- parallelogram -->
<!-- star --> <polygon
points="35,37.5 37.9,46.1 46.9,46.1 39.7,51.5 42.3,60.1 35,55 27.7,60.1 30.3,51.5 23.1,46.1 32.1,46.1"
style="fill: #ccffcc; stroke: green;" />
<!-- weird shape --> <polygon
points="60 60, 65 72, 80 60, 90 90, 72 80, 72 85, 50 95" style="fill: yellow; fill-opacity: 0.5; stroke: black; stroke-width: 2;" />
</svg>
The results, with a grid in the background for reference, are displayed in Figure 3-10.
Figure 3-10. Demonstration of the polygon element
3.5.1 Filling Polygons That Have Intersecting Lines
For the polygons shown so far, it's been easy to fill the shape. Since none of the lines forming the polygon cross over one another, the interior is easily distinguished from the exterior of the shape. However, when lines cross over one another, the determination of what is inside the polygon is not as easy. The SVG in Example 3-10 draws such a polygon. In Figure 3-11, is the middle section of the star considered to be inside or outside?
Example 3-10. Unfilled polygon with intersecting lines
<svg width="200px" height="200px" viewBox="0 0 200 200">
<polygon points="48,16 16,96 96,48 0,48 80,96" style="stroke: black; fill: none;" />
</svg>
SVG has two different rules for determining whether a point is inside a polygon or
outside it. The fill-rule (which is part of presentation) has a value of either nonzero or
evenodd. Depending on the rule you choose, you get a different effect. Example 3-11
uses the rules to fill two diagrams of the star, as shown in Figure 3-12.
Example 3-11. Effect of different fill-rules
<svg width="200px" height="200px" viewBox="0 0 200 200">
<polygon style="fill-rule: nonzero; fill: yellow; stroke: black;" points="48,16 16,96 96,48 0,48 80,96" />
<polygon style="fill-rule: evenodd; fill: #00ff00; stroke: black;" points="148,16 116,96 196,48 100,48 180,96" />
</svg>
Figure 3-12. Effect of different fill-rules
Explanation of the Fill Rules
For the sake of completeness, we are describing how these fill-rules work, but you don't need to know the details in order to use them. The nonzero rule determines whether a point is inside or outside a polygon by drawing a line from the point in question to infinity. It counts how many times that line crosses the polygon's lines, adding one if the polygon line is going right to left, and
subtracting one if the polygon line is going left to right. If the total comes out to zero, the point is outside the polygon. If the total is nonzero (hence the name) the point is inside the polygon.
3.6 The polyline Element
Finally, to round out our discussion of basic shapes, we'll return to straight lines. Sometimes you want a series of lines that does not make a closed shape. You can use multiple <line> elements, but if there are many lines it might be easier to use the
<polyline> element. It has the same attributes as <polygon>, except that the shape is not closed. Example 3-12 draws the symbol for an electrical resistor, shown in Figure 3-13.
Example 3-12. Example of the polyline element
<svg width="200px" height="200px" viewBox="0 0 200 200"> <polyline
points="5 20, 20 20, 25 10, 35 30, 45 10, 55 30, 65 10, 75 30, 80 20, 95 20"
style="stroke: black; stroke-width: 3; fill: none;" /> </svg>
Figure 3-13. Example of the polyline element
It's best to set the fill property to none when using <polyline>; otherwise, the SVG viewer attempts to fill the shape, sometimes with startling results like those in Figure 3-14.
Figure 3-14. Example of filled polyline
3.7 Line Caps and Joins
When drawing a <line> or <polyline>, you may specify the shape of the endpoints of the lines by setting the stroke-linecap style property to one of the values butt, round, or square. Example 3-13 shows these three values, with gray guide lines showing the actual endpoints of the lines. You can see in Figure 3-15 that round and square extend beyond the end coordinates; butt, the default, ends exactly at the specified endpoint.
Example 3-13. Values of the stroke-linecap property
<line x1="10" y1="15" x2="50" y2="15"
style="stroke-linecap: butt; stroke-width: 15;"/>
<line x1="10" y1="45" x2="50" y2="45"
<line x1="10" y1="75" x2="50" y2="75"
style="stroke-linecap: square; stroke-width: 15;"/>
<!-- guide lines -->
<line x1="10" y1="0" x2="10" y2="100" style="stroke: #999;" /> <line x1="50" y1="0" x2="50" y2="100" style="stroke: #999;" />
Figure 3-15. Values of the stroke-linecap attribute
You may specify the way lines connect at the corners of a shape with the
stroke-linejoin style property, which may have the values miter (pointed), round
(round -- what did you expect?), or bevel (flat). Example 3-14 produces the result shown in Figure 3-16.
Example 3-14. Values of the stroke-linejoin attribute
<polyline
style="stroke-linejoin: miter; stroke: black; stroke-width: 12; fill: none;"
points="30 30, 45 15, 60 30"/>
<polyline
style="stroke-linejoin: round; stroke: black; stroke-width: 12; fill: none;"
points="90 30, 105 15, 120 30"/>
<polyline
style="stroke-linejoin: bevel; stroke-width: 12; stroke: black; fill: none;"
points="150 30, 165 15, 180 30"/>
Figure 3-16. Values of the stroke-linejoin attribute
If your lines meet at a sharp angle and have a mitered join, it's possible for the pointed part to extend beyond the lines' thickness. You may set the ratio of the miter to the thickness of the lines being joined with the stroke-miterlimit style property; its default value is 4.
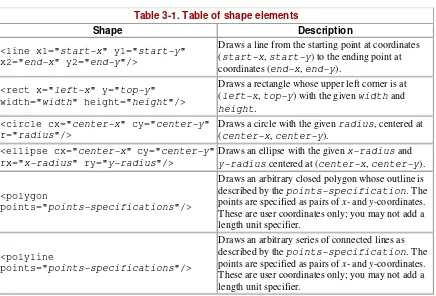
The following tables summarize the basic shapes and presentation styles in SVG.
3.8.1 Shape Elements
Table 3-1 summarizes the basic shapes available in SVG.
Table 3-1. Table of shape elements
Shape Description
<line x1="start-x" y1="start-y" x2="end-x" y2="end-y"/>
Draws a line from the starting point at coordinates (start-x, start-y) to the ending point at coordinates (end-x, end-y).
<rect x="left-x" y="top-y" width="width" height="height"/>
Draws a rectangle whose upper left corner is at (left-x, top-y) with the given width and
height.
<circle cx="center-x" cy="center-y" r="radius"/>
Draws a circle with the given radius, centered at (center-x, center-y).
<ellipse cx="center-x" cy="center-y" rx="x-radius" ry="y-radius"/>
Draws an ellipse with the given x-radius and
y-radius centered at (center-x, center-y).
<polygon
points="points-specifications"/>
Draws an arbitrary closed polygon whose outline is described by the points-specification. The points are specified as pairs of x- and y-coordinates. These are user coordinates only; you may not add a length unit specifier.
<polyline
points="points-specifications"/>
Draws