Arthur M. Langer
Analysis and Design
of Information
Systems
Arthur M. Langer, EdD
Fu Foundation School of Engineering & Applied Science School of Continuing Education
Graduate School of Education Columbia University
New York, NY 10027 USA
British Library Cataloguing in Publication Data
A catalogue record for this book is available from the British Library
Library of Congress Control Number: 2007928317
ISBN 978-1-84628-654-4 e-ISBN 978-1-84628-655-1
Printed on acid-free paper
© Springer-Verlag London Limited 2008
Apart from any fair dealing for the purposes of research or private study, or criticism or review, as permitted under the Copyright, Designs and Patents Act 1988, this publication may only be reproduced, stored or transmitted, in any form or by any means, with the prior permission in writing of the publishers, or in the case of reprographic reproduction in accordance with the terms of licences issued by the Copyright Licensing Agency. Enquiries concerning reproduction outside those terms should be sent to the publishers.
The use of registered names, trademarks, etc., in this publication does not imply, even in the absence of a specific statement, that such names are exempt from the relevant laws and regulations and therefore free for general use.
The publisher makes no representation, express or implied, with regard to the accuracy of the information contained in this book and cannot accept any legal responsibility or liability for any errors or omissions that may be made.
9 8 7 6 5 4 3 2 1
Preface
Throughout the last 40 years the impact and importance of information technology (IT) continues to transform the world. Indeed, we are very much at the beginning stages of what I believe will be known as the technology revolution—a revolution that will change every aspect of business and life in general. While technology, both hardware and software, continues to evolve, the one remaining constant is the challenge of understanding what the users of applications really need, what they think they want, and what they will want as their uses of systems mature.
Still, the process of mastering the analysis and design phase of the Software Development Life Cycle (SDLC) continues to perplex the most sophisticated IT organizations and software development companies. And to make matters even more complex, the IT industry has transitioned to a heavily outsourced model of software development, making the requirements of what is necessary even more important because of the risks of having applications developed abroad that do not meet user expectations.
Perhaps the most significant development in applications has been the Internet, with all the corresponding pieces: branding, Web development, and interactive user interfaces have established many more substantial challenges to how applications evolve. The most critical change, however, is the partici-pation of a more sophisticated and unknown user: theconsumer. The consumer is a most unusual individual: he/she does not participate as part of an internal organization, or external client, rather a transactional force that comes in and out of the application with an enormous amount of uncertainty and constant change in behaviors and needs. Furthermore, this “consumer” represents a broad population, of culture, age, gender, and ethnicity differences.
With the significant challenges described above, it is imperative that we expand analysis and design to provide developers from inside and outside the business to clearly understand what is needed. Furthermore, applications need to change more often, so that object-based design is no longer an alternative, rather a necessity to allow organizations to continually evolve and mature their abilities to serve their clientele. This book then focuses on providing direction on the many alternatives to dealing with all types of systems, from large legacy applications to on-line transactional systems that interface with a myriad of internal and external systems.
vi Preface
seeks to remedy this problem by focusing on the applied aspects of analysis to create systems that meet the needs of their users, consumers, and businesses. The analyst/designer encounters many obstacles on the road to designing appli-cations. Many of these obstacles have nothing to do with technical challenges at all—they are problems that come from outside the realm of IT: politics, budget and time constraints, and marketing pressures. All of these can challenge the structured approach to analysis and design. This book addresses these obstacles and recommends ways to overcome them. I have always warned my students by telling them: “Follow the Yellow Brick Road.” That is, start out on the right path and you will end up in the place you want to be—in spite of all the obstacles you may encounter on the way. I hope this book shows many IT professionals that the analyst/designer is the most important component of the SDLC.
This new edition aims to enhance the set of techniques and tools that the analyst/designer requires for success. It also addresses some of the “softer” but critical other skills such as creativity and the ability to understand the market needs of the business. Furthermore, the successful analyst/designer must be able to understand consumer needs; ensure integration with legacy systems; provide user interface requirements; establish standards, security, and network architecture; and finally to provide the necessary project management to ensure implementation.
New to the Third Edition
This third edition provides more examples and case studies; however, it contains two major upgrades from its predecessor: first, responding to feedback, I have framed the modeling tools within an SDLC framework so that readers can have a step-by-step understanding of when and how to use each of the modeling tools of analysis. To accomplish this, I provide a popular SDLC approach called “the Barker Method” which was developed by Richard Barker from Oracle Corporation. Second, the scope of analysis and design has been expanded to include more specific information on Logic Data Modeling, specifically refer-ential integrity, naming conventions, logical-to-physical design steps, XML, data values, and denormalization. I have also added new chapters on Web interface tools, security and change control and data warehouse system design.
The Aim of This Book
Preface vii
confident that the success rate can be dramatically improved if we focus less on the methodology and more on the ability of the analyst to perform the work. This book is therefore meant as a “practitioner’s guide” to doing analysis through every facet of developing software solutions.
The book defines the word “analyst” to include any individual involved in establishing the requirements and design of a system. For this reason, the book includes subjects like joint application development (JAD) and prototyping, which may not always be performed by analysts but which nevertheless fall within the confines of the definition.
My enthusiasm for writing this book was supported by many of my students who found that existing books on analysis are:
• very theoretical. Although they explain the methodologies, they do not
provide enough examples of their actual application.
• too procedural. They do not deal with the “human” aspects of
devel-oping requirements and thus do not provide a complete understanding of how to be successful. After all, the whole point of analysis is to service human enterprises, not just to create systems for their own sake. The human side of analysis is as important as the technical side.
• lacking simple but effective case examples. The examples do not
demon-strate the concepts effectively or are too complex for practice study.
• too one-sided in their views. It is important to establish all available
methodologies, even those that conflict with each other. Putting opinions into perspective and leaving many of the ultimate decisions to the practitioner is a significant part of the analyst’s education.
The Intended Audience for This Book
This book assumes a reasonable understanding of computer concepts and termi-nology. The material is presented to be used in a first-level analysis course or university program. In addition, it can be used by practicing information systems professionals or executives who are managing information technology and need an in-depth understanding of the principles of the analysis and design process, particularly as it relates to Web-based development. Furthermore, many programmers who are also performing analysis may find this book a way of developing a useful approach to structured and object methodologies.
Acknowledgments
viii Preface
I also want to thank the students in the Service Learning in the Community Environment (SLICE) at Columbia University’s Fu Foundation School of Engineering and Applied Science (SEAS) for their feedback on the Second Edition. This Third Edition will continue to be used to train underserved inner-city adults in the hopes of building their careers as tomorrow’s analysts and designers. Many thanks to Dr. Jack McGourty, the Associate Dean of Under-graduate Students, for allowing us to implement the program at SEAS.
New City, New York, USA Arthur M. Langer
Contents
Preface v
1. Introduction 1
What Is, Is... 1
Just What Is a Complex Project? ... 3
The Tiers of Software Development ... 6
User Interface... 6
Tools... 6
Productivity Through Automation... 7
Object Orientation... 7
Client/Server ... 7
Internet/Intranet... 8
Problems and Exercises ... 9
2. System Development Life Cycle (SDLC) 10 System Development Life Cycle—Steps in Analysis and Design... 10
The Barker Case Method... 15
3. The User Interface 21 Establishing User Interfaces ... 21
Forming an Interview Approach ... 21
Dealing with Political Factions ... 24
Categories and Levels of Users... 25
Joint Application Development (JAD)... 28
Problems and Exercises ... 34
Mini-Project ... 35
Assignment... 35
4. Overview of Analysis Tools 36 The Concept of the Logical Equivalent ... 36
x Contents
Making Changes and Modifications... 41
Specification Formats ... 47
Problems and Exercises ... 50
5. Process-Based Tools 51 Data Flow Diagrams ... 51
Process Flow Diagrams ... 58
Data Dictionary... 63
SQL Data Types ... 67
Process Specifications... 70
State Transition Diagrams ... 77
Entity Relational Diagrams ... 81
Problems and Exercises ... 83
Mini-Project #1 ... 84
Assignment... 84
Mini-Project #2 ... 84
Assignment... 85
Mini-Project #3 ... 85
Assignment... 86
Mini-Project #4 ... 86
Assignment... 86
6. Logic Data Modeling Tools 87 Normalization Defined ... 87
Normalization Approaches ... 88
The Supertype/Subtype Model ... 97
Combining User Views ... 101
Integration with Existing Models: Linking Databases... 105
Referential Integrity ... 107
Database Naming Conventions ... 108
View Naming Conventions ... 110
Field Length and Character Conventions... 112
Null Values ... 113
Denormalization... 114
Logic to Physical Databases... 116
Data Types Usage and Conventions ... 119
Business Rules ... 119
Triggering Operations... 121
Problems and Exercises ... 122
Mini-Project #1 ... 122
Mini-Project #2 ... 123
Contents xi
7. Web User Interface Tools 127
Introduction ... 127
Components of Web Design... 128
Content ... 129
The Web Branding Process ... 130
Customer Service ... 136
Text ... 139
Content Templates ... 142
Navigation Placement ... 150
Site Architecture ... 153
Non-Web-Based Interfaces... 156
GUI and Styles of Manipulation ... 157
Advantages of GUI Systems ... 158
Disadvantages of GUI Systems... 159
Conclusion ... 160
Where to Begin ... 160
Database Design ... 167
E-Commerce Application Requirements... 169
Problems and Exercises ... 174
8. XML in Analysis and Design 176 Introduction to XML ... 176
XML Structure ... 177
XML Parsing... 177
What XML Is Not... 178
Other XML Interfaces ... 179
Document Object Model ... 180
XML as a Common Data Format... 182
XML Applications with Database Systems ... 184
Analysis and Design of XML Documents ... 187
Step 1: Determining XML Documents ... 188
Step 2: XML Data Schemas... 193
Step 3: XML Reuse ... 195
Storing XML Documents in a Database ... 197
XML as a Centralized Data Search Engine ... 200
XML Query Usage ... 201
XML versus the Database ... 202
XML and SVG... 203
9. Design Specification Tools 206 Business Specifications... 206
xii Contents
Screen Specifications ... 212
Screens and Derived Elements ... 213
Problems and Exercises ... 214
Mini-Project ... 218
10. CASE and Automated Techniques 229 CASE Defined ... 229
Why Does CASE Fail?... 237
Why CASE Should Succeed ... 238
Open Systems Requirements and Client/Server ... 239
Problems and Exercises ... 242
11. Object-Oriented Techniques 243 What Is Object-Oriented Analysis?... 243
Identifying Objects and Classes ... 248
Object Modeling ... 252
Relationship to Structured Analysis ... 254
Problems and Exercises ... 259
12. Documentation and Acceptance-M Testing 260 Documentation ... 260
Acceptance Test Plans ... 261
Quality During Analysis ... 261
How Much Can Be Tested? ... 261
Budget Process... 264
Problems and Exercises ... 267
13. Business Process Reengineering 268 Analyzing Legacy Systems ... 269
Combining Structured and Object Techniques ... 270
Dealing with End Users... 273
Information Systems Issues ... 274
System Development Life Cycle (SDLC)... 276
Downsizing System Components... 277
Problems and Exercises ... 280
14. Security 281 Introduction ... 281
Database Security and Change Control... 308
Contents xiii
15. Data Warehousing 314
Introduction ... 314
Data Warehousing Concepts Revisited ... 315
Performance Benefits of Data Warehouses... 316
Concept of Multidimensional Data ... 318
Data Warehouse Conceptual Design ... 321
Extracting Data from a Database Source ... 322
Staging and Formatting Extracted Data ... 323
Alternative Types of Data Warehouse Structures... 324
A Decision Support Life Cycle ... 327
16. Website Design and Architecture 349 Introduction ... 349
Dynamic Web Pages... 351
Content Management as a Web Site Builder... 351
Automated Security ... 360
Personalization ... 360
Automated Reporting... 363
Summary ... 367
17. Concepts of ISO 9000 370 Developing a System of Procedures ... 370
Why ISO 9000? ... 371
How to Incorporate ISO 9000 into Existing Software Life Cycles ... 372
Interfacing IT Personnel ... 374
Committing to ISO 9000 ... 377
Problems and Exercises ... 379
Appendix A Case Study: The Rainforest Book
Company Problem 380
Appendix B Case Study: The CGT Rental Service Problem 383
Appendix C Case Study: The Collection Agency Problem 385
Appendix D Case Study: The Mobile Telephone
Company Problem 391
Appendix E Case Study: Northwest General
xiv Contents
Appendix F Case Study: University Student
Enrollment Database 394
Glossary 395
References 404
Bibliography –Additions 408
1
Introduction
What Is, Is
Over Forty years of developing requirements for systems have taught us that the only successful approach to analysis is to accept what exists in the user’s environment, however far from ideal those conditions may be, and work within those limitations. It may be very tempting to use analysis time to try to refocus how the user does business. Yet efforts to re-design or reengineer, unless specif-ically requested by the user, will typspecif-ically be a waste. Although your assessment may be correct and your suggestions potentially useful, being correct is less important in this situation than being wise and understanding the ability of your users to successfully implement and utilize what they need. Analysts tend to ignore this simple wisdom, much to their own distress and that of their clients.
Looking at a typical example of an analysis situation will help to illustrate this point. Let us assume that an enterprise needs a relational database model to gather information about a subject area of the business. There are 200 offices that will need to connect into a nationally provided service. Users disagree on the mission of the applications and cannot determine what reports or query information they want. Some offices are automated, but they do not have the same software and hardware. There is little expertise in the user community to determine the data requirements and file layouts (identifying elements in each file). Management has requested that the analyst establish a specification which identifies the requirements of the system as well as the necessary hardware and software.
Faced with so unwieldy a task, many analysts will adopt the following approach in an attempt to impose order on a disorderly situation:
1. Force users to define all requirements. Since they are unable to do so, this insistence will probably result in their guessing or providing incomplete information.
2. Determine the hardware and software configuration, despite having inaccurate or incomplete requirements.
3. Ignore the political environment.
2 Analysis and Design of Information Systems
It should be clear that this approach is the wrong one, on a number of different counts. Yet such an approach is all too typical for analysts confronted with a less-than-ideal working-environment. Happily, there is a better approach for all concerned, one that recognizes and responds to the conditions actually present at the users’ site. In this case it is evident that the users are not positioned to provide the requirements for a system, largely because they do not fully understand their own needs and because they do not agree on what those needs are. What the analyst must understand in such a situation is that because of this lack of knowledge and organization, user needs will tend to change during the process of product analysis and design. Such changes are to be expected; they are simply part of the life cycle for this particular implementation. To ignore the situation and try to implement a system is to invite failure. Put simply then, what is, is. The task of the analyst is to work with what is rather than trying to change it or— even worse—simply denying it. Once you as an analyst understand that reality, you understand that your solution must accommodate what will inevitably occur.
Here is a more sensible approach to the situation described above:
1. Focus on designing a model that can provide the users with the capability they want. Create a project plan that assumes that the database will be incomplete during phase I because of the users’ inability to define the correct information. The process will therefore be iterative and thus will be finalized during the later parts of the development life cycle.
2. Do not try to identify hardware before it is clear what the usage require-ments are, such as peak-time processing, number of users, and so on. It will be more beneficial to establish the operating system or architec-tural environment that you want to support, pending the results of the analysis.
3. Utilize a software system or CASE tool that will allow users to generate new scenarios such that they can see how these scenarios relate to the entire system.
4. Set up a pilot program. This will require that certain offices agree to be test sites for the early versions of the software. The function of the pilot is to provide feedback on the effectiveness and shortfalls of the product. It is important to state clearly the objectives of the pilot and the format of the feedback in order to ensure the success of the exercise.
5. Formulate a plan that depicts a schedule for getting the entire enterprise implemented and live on the new system. Be sensitive to the politics of the situation, and use a realistic approach that will not require a cultural change in order to implement software in the existing environment.
1. Introduction 3
conventional wisdom that suggests using an approach based on only a single methodology (e.g., Yourdon, Martin, Booch, etc.). The mixing of methodologies allows the analyst a wider range of tools. Hands-on experience shows that this kind of mixing of methodologies can be done quite successfully and that it is appropriate in a large number of analysis situations.
Just What Is a Complex Project?
Most analysts, project team members and users worry about the complexity of their projects. Their requirements seem entirely unique to them, and therefore a very special approach seems to be required. How many times have you heard: “the tools and approaches used elsewhere just won’t work in this environment”? The truth, however, is very different: the only truly complex projects are those that people make so! It is important for the analyst to recognize that the proce-dures utilized, regardless of the size of the project, should remain fundamentally the same. As we have discussed above, the analyst’s approach to the implemen-tation of each project should be tailored individually; however, the procedures for this implementation should remain constant. Very often the organization of interviews, the utilization of techniques such as Joint Application Development (or JAD), discussed later in this chapter) or the simple addition of more analysts to the project can solve what appear to be insurmountable problems.
In fact, most of the myriad problems that arise in product development can be traced to two fundamental issues:
1. People are trying to solve the wrong problem, i.e., the identified problem is not really what is wrong.
2. The solution to the real problem is often much simpler than it first appears to be.
Because we have failed to recognize these issues, the industry’s frustration with developing appropriate software solutions has been chronic, and this situation has not really improved over the last twenty-five years! The question is why?
To put it bluntly, analysts often fail to do their jobs properly! We tend to put together plans and schedules that are doomed from the start to fail, an issue treated in more detail later. The ultimate goal of the analyst must take into account the reality of the environment in which the work is occurring. Remember, work within the environment. Let users decide what degree of change is appropriate for their own operation; do not take it upon yourself to demand that they change. For example, how many times have you seen a Gantt Chart1 for a project
schedule that resembles Figure 1.1 below?
1 A Gantt Chart is a tool that depicts progress of tasks against time. It was developed by
4 Analysis and Design of Information Systems
Figure 1.1 Sample Gantt Chart.
It looks nice, but in reality the plan it depicts could never happen. Focus in particular on the intersection of Development and Quality Assurance (QA) activities. The plan shows that once Development is finished, the materials are forwarded to QA for testing. The sequence assumes, however, that QA will never find an error and that therefore the materials will never be returned to Development! Any analyst knows that this scenario is very unlikely to occur. Such poor planning results in deficient allocation of resources to the project. Should the development schedule be met, programming resources most probably will be allocated to other projects. Thus, if QA finds errors (which they undoubtedly will), reallocating these programming resources becomes difficult and problematic. And remember: programmers do not like returning to an “old” program to do maintenance or error fixing.
Figure 1.2 reflects a more realistic view of the life cycle of the project: The difference in approach is striking. The question is, as sensible as this plan appears to be, why don’t we always do it this way? Quite frankly, this plan does not look as nice—as neat and tidy—as the previous plan. But of course simply denying the pain of reality—the inevitable inconveniences and delays— does not make that reality go away. In defense of the previous configuration,
1. Introduction 5
some developers might suggest that the iterations of efforts between testing and fixing the software are assumed to be included in the QA time. Maybe, but don’t count on it! Just look at the second schedule and you will see how the results of this proper allocation added to the delivery time of the project. It is clear that the original plan was simply incorrect.
There is absolutely no reason that a schedule should not reflect the reality of what will most probably occur. The results are clear: Realistic planning provides a more reliable schedule. Among the many benefits of such a schedule are the confidence and respect gained by both the users and the development staff. There is nothing like producing a schedule that reflects what everyone is confident will occur.
At this point, experienced analysts are no doubt wondering what happens when management dictates how much time we have and shows no flexibility about running behind schedule. This problem is unfortunately not uncommon, and typically fits into one of three scenarios:
1. Management is ignorant of the analysis and construction of systems and simply has no idea how much time is required to complete the project. In this case the analyst will need to develop a convincing presentation for management about how systems are designed and developed. The presentation should be carefully documented to refer to the industry statistics for similar projects in similar companies. This kind of documentation adds much credibility to the discussion. You can also consider having an independent source, such as a respected consulting firm, support your position.
2. Management has little confidence in Development. They feel that picking a date and sticking to it is the best method of getting the project finished. Yes, this is the bully technique! It usually results from bad experiences, probably from looking at those unrealistic Gantt Charts. In this situation, the analyst must take steps to gain the management’s confidence. Using the suggestions above would be a good start. In addition, you will need to research and to understand the history of what your predecessors did to encourage this type of distrusting and dictatorial attitude from management, and you will need to find a tactful way to address those issues.
6 Analysis and Design of Information Systems
instead realistic: some projects are doomed to fail before they begin. What is important is that the analyst recognize as early in the life cycle as possible that the project cannot be successful.
The Tiers of Software Development
The lifecycle of software development continues to evolve, particularly with the advent of the object paradigm (discussed in Chapter 11). The lifecycle of development inevitably affects the way analysis and design are accomplished. Indeed, it seems only natural that the rapid changes in software methodologies would be accompanied by parallel development in analysis and design. Unfortu-nately, such is not the case, and the advances in software development continue to overshadow the importance of analysis and design.
As the software industry focuses on electronic commerce (e-commerce) through robust Web-based development, it becomes vitally important for the analyst to use the appropriate sequence of tiers to arrive at requirements. Devel-opers cannot expect good results from taking shortcuts, tempting as it may be to do so. The recommended sequence of tiers is outlined below.
User Interface
Regardless of the type of software applications being developed, systems cannot be effectively designed without an appropriate user interface. The user interface tier acts as the foundation for the project: Without a solid foundation at this level, the project is at risk of collapsing at some point during development. Despite its importance, the user-interface tier is often overlooked: Many software projects today move too quickly into development without the effort having been spent to determine what is really needed from the user community. Successful analysts are aware of the critical importance of the user interface phase of any project. Chapter 3 focuses on methods of formulating user interfaces that can significantly improve software development.
Tools
1. Introduction 7
must be mastered to ensure success. Chapters 4 and 5 focus on which tools are needed to accomplish which tasks. The chapters also outline the advantages and disadvantages of each tool.
Productivity Through Automation
Having the appropriate tools and knowing how and when to use them is only part of the formula for success. Analysts must also be productive—and productivity can be accomplished only through the use of automation. Automation is imple-mented using integrated computer aided software engineering (CASE) products. These products provide the analyst with an automated and integrated toolbox of features that are centralized through a core data dictionary and repository.
Object Orientation
Successful projects employ the concepts of object orientation (OO). Whether or not software systems are OO compliant, analyzing systems using the object method builds better systems that are more cohesive, reusable, and maintainable (see Chapter 11). More cohesive code is “tighter” code, and is more easily fixed and maintained. It is also the foundation of the reusable components that can be incorporated into other applications later. Without the OO construct, systems tend to have pieces that are recoded and hard to maintain. With the advent of the enterprise solutions and e-commerce transactions that will be vital to business strategies, building object-based systems has become more a requirement than an option. However, as this book will show, businesses and organizations cannot just jump into OO, but rather they must create the foundations first through the previous tiers of development. Put another way, it is more important to understand the concepts of OO during analysis and design than it is to have the OO scheme actually programmed. This idea is discussed further in Chapter 11.
Client/Server
8 Analysis and Design of Information Systems
communicate with each other. Thus, analysts must first be versed in the laws governing OO if they are to pursue the client/server model. Incidentally, almost all Web-based applications that use JAVA, Active-X and other controls are designed essentially under the guidelines of interaction objects in a client/server environment.
Internet/Intranet
The advent of Web-based technology, sometimes known as Internet/Intranet processing, has led the industry to the use of a new breed of software applications. This new breed requires more robust processing and involves careful design and placement of pictures that provide users with a true “cafeteria” style of operation. These new applications bring new challenges to analysts and designers. Increasingly, it is not programmers who are designing the interface; rather, analysts themselves are beginning to work with commercial advertisers and marketing departments to create a “look and feel” that will be critical to the survival of many businesses. E-commerce, a result of the Internet/Intranet boom, represents another level of analysis. I believe that in the future, e-commerce will exert the strongest shaping influence on the analyst’s profession–a profession destined to become tomorrow’s integrators of systems development. Indeed, programming tools will continue to become easier to develop and more abundant in precoded forms. There will, undoubtedly, be less distribution of development teams, that is, companies will find more and more outsourced solutions to fill their needs. Notwithstanding the “automation” of code, the need for integrators who can communicate with executives and with line management and operations personnel will ultimately be the most significant forces in the development of strategic-based systems over the Internet.
Internet/Intranet processing requires that analysts have mastered the client/server paradigm. Indeed, many professionals have dubbed Internet devel-opment as “client/server grown up.” While this may or may not be the best definition of Internet/Intranet development, it is another statement that supports the tier concept, the concept that underlies the approach of this book.
• • •
This introduction is focused on presenting the steps necessary to success as a professional analyst. I call each of these steps tiers because of their building block nature and their dependencies on each other. I believe, therefore, that to learn to become an effective analyst, one must master the specifics within each of these tiers and must pass critical information to the next level. Rather than look at analysis sequentially, I would present the steps as levels as depicted in Figure 1.3.
1. Introduction 9
Figure 1.3 Tiers of analysis and software application development.
developed or exist without the previous one. To ensure success on a project, everyone involved in the design and development of application software must fully understand the interdependent nature of these tiers. Analysts must be able to convey to their colleagues that to do Internet/Intranet development, organizations must first have excellent user interfaces, mastery of a structured toolset, a vehicle for automation so that the process will be productive, an understanding of the concept of objects, and a way to deploy these objects in a client/server environment. It all sounds so simple, and in many ways it is. The question answered by this new edition ishow?
Problems and Exercises
1. Professionals often refer to software projects as being very complex. Explain why this complexity might be overstated and misunderstood. 2. What is a Gantt chart? How are Gantt charts used and why is it important
that they be realistic estimates of how the project will proceed? 3. Explain what is meant by “tiers of software development.”
4. The user interface represents the first critical step to obtaining the proper needs of users. Provide five examples of different user positions that might be critical to interview.
5. Discuss the importance of using the appropriate analysis tool when interviewing users and building specifications.
6. How is productivity obtained in analysis? What tool is best used? 7. Explain why object orientation is beneficial to software developers. 8. What is the use of client/server with respect to software development? 9. Why is Internet/Intranet processing so important to today’s Web
2
System Development Life Cycle
(SDLC)
System Development Life Cycle—Steps in Analysis
and Design
The purpose of this chapter is to build on the Tiers of Software Development and to provide a framework for the life cycle of most software development projects. This is important prior to explaining the details of the user interface and analysis tools that are needed to bring software to fruition. Another way of viewing this chapter then is to get a sense of how the tiers of development actually interface with each other and what specific events and tools are used to successfully complete each step. This chapter consists of two sections: the first explains the notion that software goes through three basic phases or cycles, that is, Development, Testing, and Production. The second section provides an example using a seven-stage method called “The Barker Method,” which represents one approach to defining the details of each of the three cycles.
No matter which methodology might be used when designing a system including its related database, the key elements involved in the methodology usually include, at a minimum, business process reengineering and the life cycle for design and implementation. Business process reengineering (BPR), simply defined, is the process used for either reworking an existing application or database to make improvements, or to account for new business require-ments. BPR will be discussed in more detail in Chapter 13. The life cycle of the database includes all steps (and environments) necessary to assist in the database’s design and final implementation and its integration with application programs. Irrespective of which design methodology is used, analysts/designers will find that system development projects will usually include the following generic steps:
1. Determine the need for a system to assist a business process 2. Define that system’s goals
3. Gather business requirements
2. System Development Life Cycle (SDLC) 11
Thistraditional methodis the most commonly used design approach and includes
at least three primary phases:
1. Requirements analysis
2. Data modeling
3. Normalization
During the first phase, requirements analysis, the development and design team conduct interviews in order to capture all the business needs as related to the proposed system. The data modeling phase consists of the creation of the logical data model that will later be used to define the physical data model, or database structures. After the database has been modeled and designed, the normalization phase is implemented to help eliminate or reduce as much as possible any redundant data. All of the specifics of how this is accomplished will be detailed in the tools of analysis chapters. Below is a more specific description of what activities are included in the Development, Testing, and Production cycles of the SDLC.
Development
The Development life cycle includes four overall components. Using this perspective, “development” would consist of all the necessary steps to accom-plish the creation of the application. This includes feasibility, analysis, design, and the actual coding. Feasibility represents the tasks necessary to determine whether the software project makes business sense. Most organizations would integrate the process of Return-On-Investment (ROI) during this step. ROI consists of the financial steps that determine mathematically whether the project will provide the necessary monetary returns to the business. Focusing solely on monetary returns can be a serious pitfall, since there are many benefits that can be realized via non-monetary returns (Langer, 2005). Feasibility often contains what is known as a high-level forecast or budget. The “high” would represent the “worst case” scenario on cost and the “low,” the best case or lowest cost. The hope of course is that the actual cost and timetable would fall somewhere in between the high and the low. But feasibility goes beyond just the budget; it also represents whether the business feels that the project is attainable within a specific timetable as well. So, feasibility is a statement of both financial and business objectives, and an overall belief that the cost is worth the payback.
12 Analysis and Design of Information Systems
of the mathematics of analysis is decomposition. Decomposition as we will see establishes the creation of the smaller components that make up the whole. It is like the bones, blood, and muscles of the human body that ultimately make up what we physically see in a person. Once a system is decomposed, the analyst can be confident that the “parts” that comprise the whole are identified and can be reused throughout the system as necessary. These decomposed parts are called “objects” and comprise the study and application of object-oriented analysis and design. Thus, the basis of working with users ultimately leads to the creation of parts known as objects that act as interchangeable components that can be used whenever needed. One should think of objects like interchangeable parts of a car. They sometimes are called “standard” parts that can be reused in multiple models. The benefits are obvious. Such is the same objective with software: the more reusable the more efficient and cost effective.
Design is far less logical than analysis but a far more creative step. Design is the phase that requires the physical decisions about the system, from what programming language to use, which vendor database to select (Oracle, Sybase, DB2 for example), to how screens and reports will be identified. The design phase can also include decisions about hardware and network communications or the
topology. Unlike analysis, design requires less of a mathematical and engineering
2. System Development Life Cycle (SDLC) 13
Testing
Testing can have a number of components. The first form of testing is called program debugging. Debugging is the process of a programmer ensuring that his/her code in a program executes as designed. Debugging, therefore, should be carried out by the programmer, as opposed to a separate quality assurance group. However, it is important to recognize that debugging does not ensure that the program is performing as required by end users, rather only confirms that the code executes and does not abort during program execution. What does this mean? Simply that a programmer should never pass a program to quality assurance that does not execute, at least showing that it does perform under all conditions. Once again, this process does not ensure that the results produced by the program are correct or meets the original requirements set forth by users.
Once a program has been “debugged” it should then be sent through the quality assurance process. Today, most large organizations recognize that quality assurance needs to be performed by non-programming individuals. As a result, organizations create separate quality assurance organizations that do nothing but test the correctness and accuracy of programs. Quality assurance organiza-tions typically accomplish this by designing what is known as Acceptance Test Planning. Acceptance Test Plans are designed from the original requirements, which allow quality assurance personnel to develop assurance testing based on the users’ original requirements as opposed to what might have been interpreted. For this reason Acceptance Test Planning is typically implemented during the analysis and design phases of the life cycle but executed during the Testing phase. Acceptance Test Planning also includes system type testing activities such as stress and load checking (ensuring that the application can handle larger demands or users) or integration testing (whether the application communicates and operates appropriately with other programs in the system), as well as compat-ibility testing, such as ensuring that applications operate on types of browsers or computer systems. Testing, by its very nature is an iterative process that can often create “loops” of redesign and programming. It is important to recognize that acceptance testing has two distinct components: first, the design of the test plans, and second, the execution of those acceptance plans.
Production
14 Analysis and Design of Information Systems
On the other hand, Production as a Life Cycle includes other complex issues: 1. Backup, recovery, and archival
2. Change control
3. Performance fine-tuning and statistics 4. Audit and new requirements
Backup, Recovery, and Archiving
Operational backup should be defined during the Development phases; however, there are inevitably backup requirements that need to be modified during Production. This occurs because the time it takes to complete data backup is difficult to predict. The speed at which data can be placed on another media is not an exact science and is based on the complexity of how data is selected and the method of placement to another location and/or media. The speed also heavily relies on factors such as disk input/output speed, network throughput (speed of communication network), database backup algorithms, and the actual intervals between backup cycles. Why does this matter? It matters because backups require systems to be “off-line” until they complete, meaning that the system is in effect not operational. Thus, the longer the backup process, the longer the system is off-line. A most popular example of the potential backup dilemma is overnight processes that must complete by the beginning of the next morning. If the process of backup will take longer than the allowed time, then analysts/designers need to determine a way that can condense the time-line. The alternatives might typically include limiting the actual data used to back up, or multiple devices to increase throughput, etc.
Recovery, on the other hand, is more about testing the quality of the backed up data, and determining whether the data stored can be recovered in the opera-tional system. So, the first aspect is to see whether the necessary data needed to bring the system “back” can be accomplished. One hopes that recovery will never be necessary, but the most glaring exposure on quality assurance is to not really know whether the data we think we have, can actually be restored back to operational forms. For example, it is one thing to back up a complex database; it is another to restore that data so that the key fields and indexes are working appropriately after restoration. The only assurance for this is to actually perform a restore in a simulation. Simulations take analysis and design talent and need to be conducted on some intervals that ensure that backup data integrity is preserved.
2. System Development Life Cycle (SDLC) 15
a prior year’s accounting data to a special system that simulates a prior year in question, but that has no effect on the current system.
The Barker Case Method
Now that we have covered the essential tools that can be used to do analysis and design, it is worthwhile to look at a strategy or CASE method. One of the most popular approaches is known as the Barker Seven Phase Case method. The seven phases provides a step-by-step approach to where an analyst/designer uses the tools we have discussed. The phases are as follows: Strategy, Analysis, Design, Build, Documentation, Transition, and Production. The sections below provide an in-depth description of each of these phases.
Strategy
Strategy tends to include two major components: basic process and data flow models that can be used to confirm an understanding of the business objectives, processes, and needs. The deliverables Barker calls a “Strategy Document,” which can be correlated to what I have previously defined as a business specifi-cation. However, unlike just a pure business specification, the Strategy Document also includes an estimated budget, delivery schedule, project personnel, and any constraints and development standards that are required. Therefore, the Strategy Document contains all of the high-level issues and allows management to under-stand the objectives, timeframe, and budget limits of the project. It also is consistent with decomposition and sets the path to develop a more detailed speci-fication. Below is an example of the Barker Strategy Document components:
Barker Document Related Langer Tool and Approach
Business objectives, priorities, constraints, and critical success factors. This is essentially a section that outlines the user’s expectations and the basis for successful completion.
The User Interface, Business Specifications Format
Strategy Entity Relational Diagram. This is a high-level diagram that shows the relationship among entities without detailed attribute information. The strategy ERD provides an overall map of how the data will be related
Logic Data Modeling
across various systems.
Functional Hierarchy. This shows how the various functions of the business relate to each other in a functional way.
16 Analysis and Design of Information Systems
System Boundaries. This provides the limits of the project, that is, where the system begins and where it ends or meets with other systems.
Process-Based Tools, specifically Data Flow Diagrams, and State Transition Diagrams
Possible Architecture Issues. This part addresses what hardware or network design issues may need to be considered to deliver the solution. This could include new hardware needs such as performance upgrades, more disk space,
Network Analysis
or printers, etc
Phased Development Plan. This section typically includes a Gantt chart depicting the
Project Complexity
project plan showing each deliverable.
Personal Resource Statement and Organizational Needs. This part focuses on the effects of the project on the organization and roles and responsibilities of staff.
Business Process and Reengineering
Delivering the Strategy Document
Barker’s method provides a number of detailed steps to complete the Strategy Phase:
Project Administration and Management. This is defined as an ongoing
process that occurs throughout the project. It can be related to a form of project management including reporting, control, quality assurance and various administrative tasks. The deliverable is typically in the form of progress reports, plans, and minutes of project meetings.
Scope the Study and Agree on Terms of Reference. This step is the first
phase to agreeing on the actual objectives, constraints, and deliverables. It also includes the estimated number of interviews and how they will be completed (individual, JAD, for example), as well as specific staff assignments.
Plan for Strategy Study.This is a detailed plan for identifying specific staff
resources and schedules for meetings.
Results of Briefings, Interviews, and Other Information Gatherings. This
step engages a number of outcomes, including a functional hierarchy (Object Diagram) and rough Entity Relational Diagram. It becomes the first high-level modeling depicting the form of the architecture of the system.
Model the Business.This step includes a more detailed model of the business
flows including process flows, data flows, and a more functional ERD. It also includes a glossary of terms and business units that are involved with the system flow.
Preparation and Feedback Sessions and Completion of the Business Model.
2. System Development Life Cycle (SDLC) 17
preparation for outstanding issues to be resolved from strategy sessions and to determine how the feedback sessions will be conducted with key users and stakeholders. The feedback sessions usually result in changes to the models and a movement to the more detailed analysis phase of the project.
Recommended System Architecture.This task summarizes the finding of the
strategy and recommends a system architecture based on the assumptions and directions from stakeholders. This includes available technologies, interfaces with existing systems, and alternative platforms that can be used.
Analysis
Analysis expands the Strategy Stage into details that ensure business consistency and accuracy. The Barker analysis stage is designed to capture all of the business processes that need to be incorporated into the project. Barker divides Analysis into two components: Information Gathering and Requirements Analysis.
Information Gathering:includes the building of more detailed ERD called
an Analysis ERD (equivalent to what I called a logical model), process and data flows, a requirements document, and an analysis evaluation. This step also includes an analysis of the existing legacy systems. Much of the information gathering is accomplished via interviews with users. As discussed in the next chapter this is accomplished by understanding the user interface and determining whether to do individual and/or group analysis techniques.
Requirements Analysis: Once the information gathering is complete a
detailed requirements analysis or specification documents must be produced. It contains the relevant tools as outlined in my analysis document, namely, the detailed PFDs, DFDs, ERDs and Process Speci-fications. In the Barker approach the requirements document may also include audit and control needs, backup and recovery procedures, and first-level database sizing (space needs).
Design
The Design Stage consists of the incorporation of physical appearances and other requirements that are specific to actual products, for example, coding and naming conventions. The typical design needs are screen layouts, navigation tools (menus, buttons, etc.) and help systems. The Design Stage must also ultimately achieve the agreed upon performance or service levels.
18 Analysis and Design of Information Systems
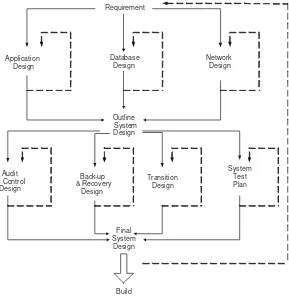
As previously discussed, Design is not a step that occurs without iteration. The Design Stage often iterates with analysis, where questions and suggestions from designers can raise issues about alternatives not considered during the analysis stage. The iterative cycle is best depicted by Barker’s diagram as shown in Figure 2.1.
What is critical about this design method is its interactive yet interdependence with non-application components such as network design, audit and control, backup and recovery design, data conversion, and system test planning.
Build Stage
The Barker Build Stage is defined as the coding and testing of programs. Much of this stage depends on the technical environment and the attributes of the programming environment, that is, Web, mainframe, mid-range, etc. The Build Stage involves the typical planning, design of the program structure,
Requirement
Application Design
Database Design
Network Design
Outline System
Design
Audit & Control
Design
Back-up & Recovery
Design
Transition Design
System Test Plan
Final System Design
Build
2. System Development Life Cycle (SDLC) 19
actual coding, program methodology (top-down, structured coding, etc.), version control, testing approaches, and test releases.
The most convoluted component of the Build Stage is what represents program debugging versus what represents testing. Testing can also be done by programmers, but it is typically segregated into a separate function and group called Quality Assurance. Debugging can be defined as a programmer’s ability to ensure that his/her code executes, that is, does not fail during execution. Quality Assurance, on the other hand, tests the ability and accuracy of the program to perform as required. In other words, does the program, although executing, produce the intended results? Current trends separate QA departments and have programmers focus on coding. Much of the QA objective is to establish Accep-tance Test Plans as I outline in Chapter 12 and this concept is more aligned with the Barker Build Stage.
User Documentation
This Stage in the Barker approach creates user manuals and operations documen-tation. Barker (1992) defines this as “sufficient to support the system testing task in the concurrent build stage, and documentation must be completed before acceptance testing in the transition stage” (p. 7–1).
The Barker User Documentation Stage is very consistent with my definition: significant parts of documentation must be accomplished during the strategy and analysis stages, when the principal aspects of the system architecture are agreed upon with users and stakeholders. The format of user and operations documentation is always debatable. What is most important is its content as opposed to its format. Barker’s method suggests that documenters design this Stage with the user or “reader” in mind. Thus, understanding how such users and readers think and operate the system within their domains is likely to be a key approach to providing the most attractive format of the document.
The user documentation should contain a full-reference manual for every type of user. Tutorials and on-line help text are always an important component in today’s Web-based systems. Another aspect of user documentation is to include information on error messages, cross-reference to related issues, as well as helpful hints. The operations documentation needs to cover day-to-day and periodic operations procedures. The operations guide includes execution proce-dures, backup and various maintenance processes that are necessary to sustain the system.
Transaction Stage
20 Analysis and Design of Information Systems
Transition Stage is to understand data conversion and its effects on whether the system is ready to go into production.
Since the original publication of Barker’s work, users today are much more experienced with the Transition Stage—simply because they have experienced it more often. As such, much of the resistance and ignorance to the importance of acceptance testing and validation do not occur at the frequency that they used to. Still, the transition process is complex. The steps necessary to go live in any new system requires an important integration with users and existing legacy applications.
Production
3
The User Interface
Establishing User Interfaces
The success factors in analysis start with the established interfaces from day one. What does this mean? You must start the process by meeting with the right people in the organization. In the best projects, the process is as follows:
1. Executive interface: There needs to be an executive-level supporter of the project. Without such a supporter, you risk not being able to keep the project on schedule. Most important, you need a supporter for the political issues that you may need to handle during the project (discussed in detail later). The executive supporter, sometimes known as asponsor (JAD reference), should provide a preliminary schedule advising the organi-zation of what is expected and the objectives of the project. The executive supporter should attach a letter to the preliminary schedule and send it to the project team members. The letter must put the importance of the project into perspective. Therefore, it is strongly recommended that you draft this letter yourself or at least have influence over its content, since doing so can ensure that the message is delivered appropriately. The executive supporter should also establish regular reviews with the analyst and the user community to ensure that objectives are being met. 2. Department head or line manager interface: If appropriate, the
department head should provide guidance about which individuals should represent the department needs. If several people are involved, the analyst should consider a JAD-like approach. Depending on the size of the organization, the department head might also establish review sessions to ensure compliance.
3. Functional user interface: Perhaps the most important people are the ones who can provide the step-by-step needs of the system. Figure 3.1 shows a typical organization interface structure.
Forming an Interview Approach
22 Analysis and Design of Information Systems
Figure 3.1 Established interface layers.
step in this mission is the actual interview, in which you must establish a rapport with the user(s) that will facilitate your obtaining the information you need. Your approach will dramatically change based on the level and category of the individual being interviewed. Therefore, prior to meeting with any user, it is critical to understand the culture of the company, its past experiences with automation, and most important its organizational structure.
The following five-step procedure will help guide you more smoothly through the interview process.
Step 1: Get The Organization Chart
Few things are more useful in understanding the chain of command and areas of responsibility than the organization chart. Depending on the size of the enterprise and the scope of the project, the organization chart should start at the executive supporter level and work down to the operational users.
Step 2: Understand Everyone’s Role in the Organization Chart
If there are any individuals not involved in the project who should be, given their position in the organization, first ask why and then make a notation for yourself that they are not to be included. Management may assume an individual or role should not be included and may often overlook their importance. Do not be afraid to ask why a person is not deemed necessary for the analysis of the system, and determine if you are satisfied with the reasons for their exclusion. Remember, you can still control and change the approach at this point, and management will probably respect you for doing so.
Step 3: Assume the Situation Is Political
3. The User Interface 23
failure. The question is how to obtain information about internal politics. The best approach is to start as high up in the organization as possible, typically at the executive supporter level. You might be surprised at the amount of information they have. Of course, you should not explicitly ask about the politics but rather phrase your question as follows: “Can you give me some perspective on potential department and personnel conflicts that may occur during the interview cycle and that I should be aware of?” You may not always get the answer you need, but if you keep asking the question during every interview, you will discover a great deal about the way the organization functions. And remember, only people make projects complex!
Step 4: Obtain Information About User Skill Sets
Starting an interview without knowledge of the user’s technical skills puts the analyst at a huge disadvantage. Having this information will allow you to formulate a plan of questions and to determine the best approach to the interview. If the user has no knowledge, the questions should be tailored to include a minimum of technical content. The following guidelines for preparing for inter-views reflect a common sense approach, yet it is amazing how many analysts fail even to consider such strategies!
1. Gather information before the session to allow the user—as well as yourself—to be prepared and to give you both a much clearer under-standing of what will be covered during the interview.
2. Develop a questionnaire. Technical questions should be phrased differ-ently depending on the level of knowledge the user possesses.
3. Determine whether the interview will provide enough input to obtain the necessary information. This is not always the case; however, it happens more often than you might think. Understanding user capabilities before the interview may not only change the scope of the meeting but also suggest who, in addition to the user, should attend the interview.
Step 5: Arrange for a Pre-Meeting with the User
A pre-meeting may not always be possible. In any case it must be a short meeting, perhaps half an hour. The session should be designed to be high-level and provide a general idea of what will be covered during the actual interview. But more important, it will allow you to get a snapshot of the user. You might say you are obtaining a “comfort level” (or “discomfort level”) for that user, and such meetings can provide you with an idea of what to expect and how to finalize your approach. What do you look for? Here is some direction.
24 Analysis and Design of Information Systems
2. Look at everything in the user’s office or his or her environment. Is it sloppy? Is it tidy and organized? The state of the user’s environment will often be consistent with the way he or she provides information. The insight you gain from observing the environment should give you guidance about the types of questions to ask this individual.
3. Look for signs of attitude. The user’s level of interest should be evident. Does he or she view the upcoming session as a waste of time, or is he or she excited about the meeting?
The information gleaned in the pre-meeting can provide you with helpful hints about what to expect from the interview and from the user in general.
Dealing with Political Factions
The importance of internal politics at the user’s site should never be underes-timated. Perhaps the most common question raised by both professionals and student analysts is how to provide quality analysis when office politics get in the way. Here are some guidelines.
1. First, assess whether you are in the no-win scenario. Many of us hate to admit that the no-win scenario does indeed exist in many environments, but you should be on the lookout for the signs. If your manager will not support you, if the company is underpaying you, if the users hate you, if there are no automated tools to do the analysis, and if upper management doesn’t care, then you are in a difficult position. If you cannot change the situation, you must inform management that the results of your analysis will be significantly impaired by the lack of support and tools to complete the project properly. The techniques offered in this book assume that all parties are interested in providing the best solution possible, not in providing a system that is barely adequate.
2. On the other hand, do not be too quick to assume that you are in the no-win scenario. Most politically hampered projects need some strategy to get them on course, and most problems can be overcome if you know how to approach them. Here is a typical example of such a problem and some ideas you can apply to solve it.
Problem
The users who currently operate the system won’t talk to me. They are afraid either that the new system might replace them or that their jobs will significantly change. In short, they fear change.
Recommended Solution
3. The User Interface 25
event, you must determine who is responsible and meet with that person. The purpose of the meeting is to gain their support. This support is significant, since you might find that the supervisor was once in operations and will be able to understand the problems you may encounter. If the meeting is successful, the supervisor may be able to offer a strategy. This strategy can vary from a general meeting with the users, to individual discipline, to escalation to upper management. Whatever you do, do not allow such a situation to continue and do not accept abuse; to do so will ultimately reflect on you and your abilities.
Obviously, if the supervisor is also a problem, then you have no choice but to go to upper management. However, this option is not a desirable one from the analyst’s viewpoint. Upper management’s reaction may not be helpful, and it could be damaging. For example, they might be indifferent to your problem and instruct you to deal with it yourself, or they might simply send the supervisor a letter. In some cases you may be fortunate and the supervisor’s responsibilities regarding the system will be given to another manager. Consider, though, how unpleasant the consequences may be if you appeal to upper management and get no support: You may be left working with an already unhelpful supervisor who has been made even more so by your complaint. It is important to remember that once you go to upper management, the line has been drawn. Supervisors typically are responsible for the day-to-day operation. They usually know more about the entire operation than anyone else, and therefore you are well advised to find a way to get them on your side. A supportive supervisor can be invaluable in helping you overcome problems, as long as you are not shy about suggesting ways to get the users comfortable.
Categories and Levels of Users
Establishing user interfaces represents the vehicle to formulate much of the interview approach. It is necessary, however, to go further into the characteristics of the people particularly with respect to the category and level they have within the organization. Figure 3.1 established the three general categories, called executive, department head or line manager, and functional. It is important to explore their characteristics. In order that we better understand each category, I have always asked the following question: What would be their interest in the success of the project, that is, what would make them happy with the new system?Let’s apply this question for each user category.
26 Analysis and Design of Information Systems
to fund software development. They are listed in order of significance to the investor.
a. Monetary return: Simply put, this means that the software will generate dollar revenue. An example might be the Internet software that supports on-line ordering systems such as Amazon has for book shipments. Their system not only provides the functionality to handle shipments, but provides a Web interface that can be directly associated with revenues provided by book orders through the Internet.
b. Increased productivity: Many software systems are unable to demonstrate direct monetary benefits. However, many of them are developed to increase productivity. This means that the system will allow organizations to actually produce and deliver more. Thus, the system allows the organization to derive higher revenues through increased productivity of its resources. c. Reducing costs: Software projects are approved so that
organi-zations can reduce their existing overhead costs. This typically relates to the replacement of manual activities with computer ones. While reducing costs appears to be similar in nature to increasing productivity, they are often implemented for different reasons. Increased productivity usually relates to organizations that are growing and are looking for ways to improve output because of very high demand. Reducing costs, on the other hand, can represent a defensive measure, where an organization is seeking to find ways to cut costs because of a shrinking market.
d. Competition: Software systems are created because the compe-tition has done so. Therefore, producing software for compet-itive reasons is a defensive measure against someone else who has demonstrated its value. An example of this is in the banking sector. Citibank was one of the first banks to introduce automated teller machines (ATM). Other banks soon followed because of the success that Citibank had with prolif-erating ATMs throughout New York State. This does not imply, however, that competitive systems are always defense mechanisms. Indeed, many commercial Web sites are being introduced based simply on market forecasts for their potential to increase business.
3. The User Interface 27
Therefore, the executive category of users is one that is interested in the value of the investment. These users have a global view of needs as opposed to the details. In fact, they may know little of how things are really done. The value of the executive interface is to provide the scope and objectives of the project against the perceived value they intend to get from the software. Another popular phrase for this is thedomainof the system. Domain often refers toboundaries. Ultimately, what makes them happy is a system that delivers what was promised or the expected ROI.
2. Department head or line manager users: These users represent two main areas of user input. First, they are responsible for the day-to-day productivity of their respective departments. Thus, they understand the importance of meeting the objectives of the organization as set forth by the executives. Indeed, they often report to the executives. On the other hand, department heads and line managers are responsible to their staff. They must deal with the functional users and prescribe ways to improve both their output and their job satisfaction. These users perhaps provide what I call the best bang for the buck, a phrase that usually means for the time invested, you get the most payback. One can see that the department heads and line managers are responsible for most of what happens every day in an organization. Another phrase that can be used to describe them is yourmost valuable players (MVPs). However, beware: MVPs are the hardest to find and get for the interviews. What makes department heads and line managers happy is the most complex. They want a system that produces the output that they are expected to provide and they need a system that keeps their staff happy and productive.
3. Functional users: Also known as the users in th