A. Method of Research
To carry out this research, the researcher used Classroom Action Research (CAR) in this thesis to improve students' reading comprehension by using Team Assisted Individualization method. According to Elliot in Sanjaya (2009: 25) a classroom action research is base of social situation that is intended to improve action quality through planning, implementing, monitoring and studying of the influence that appear. Kemis and Mc Taggart (1988: 5-6) say that classroom action research is an assessment from that used by participant in social situation to improve intellectual activity, education practice, their social practice, understanding of their practices and understanding of the situation.
Classroom Action Research consist of several cycles, in which each cycle contains preparation, planning, acting, observing, and reflecting of the teaching learning process based on lesson plan that has been prepared for one meeting. This research will be done in two cycles which each cycle consist of two meeting minutes.
collaborative action research, in which the researcher invites English teacher and students to work collaboratively. In this case the researcher cooperative with the English teacher at grade of IPA 1 of SMA Bruderan Purwokerto in academic year 2015/2016.
B. Setting of the Research 1. Place of the Research
The research will be conduct in the class grade of IPA 1 of SMA Bruderan Purwokerto.
2. Subject of the Research
In this research, students of grade of IPA 1 at SMA Bruderan Purwokerto in academic year 2015/2016 are taken as the subject of the action research based on suggestion and consideration the teacher as collaborator.
3. Time of the Research
The schedule can be seen in the following table: Table 2
The Schedule of Research No Activities
Months Septembe r 2015 October 2015 November 2015 December 2015 January 2016 February 2016 1 Doing
Pre-observation √ 2 Making
Proposal √
3
Making Lesson
Plan
√
4 Doing
Action √
5 Making
report √ √
Acting
Planning Observing
Reflecting
Acting
Observing Reflecting
Cycle 1
Cycle 2
Next Cycle C. Design of the Research
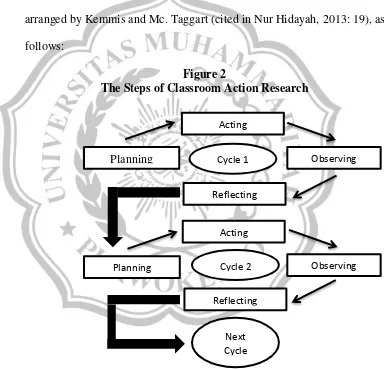
The action research is used to improve the students' reading comprehension. The researcher follows the steps of action research based on Kemmis and Mc. Taggart (cited in Nur Hidayah, 2013: 19). This stage consist of four components, those are planning, acting, observing, and reflecting. These four components are considered one cycle. In this action research two cycles will be conducted. There is a visualization design arranged by Kemmis and Mc. Taggart (cited in Nur Hidayah, 2013: 19), as follows:
Figure 2
The Steps of Classroom Action Research
The study will be stopped in cycle two if there is an increase from one cycle to the second cycle.
D. The Procedure of Research
This research is done in two cycles. There are the steps of the
research on improving students‟ reading comprehension by using Team
Assisted Individualization for grade of IPA 1 of SMA Bruderan Purwokerto in academic year 2015/2016.
The procedure consists of four stages, as follows: 1. Planning
The first phase, the researcher explain about what, why, when, where, who, and how the action was doing. In this planning the researcher determines the focus of action that needs to be observed. Then, the researcher makes a plan that will be described as follows:
a. Making Lesson Plan
The researcher make lesson plan based on syllabus using cooperative method type Team Assisted Individualization to improve students' reading comprehension.
b. Making Observation Sheet
c. Designing Instrument
The researcher makes some test (pre-test and post-test) to
measure the students‟ improvement in reading comprehension.
2. Acting
The second phase, the researcher implement the activity that had been planned before by using Team Assisted Individualization method to improve students' reading comprehension. In this step, the researcher and the teacher collaborate to implement the planned action. When the teacher is teaching in the class room, the researcher observes the class condition. This research consists of two cycles with two actions which consist of four lesson plans.
3. Observing
The third phase, observation is done towards action implementation action using observation sheet that had been prepared. The researcher observe the students' and teacher's activities in teaching learning process using the observation sheets as the instrument which consist of students' observation sheet and the teacher's observation sheet.
4. Reflecting
the researcher reflect the learning activity that had been done. The results of this reflection are used as consideration in doing the next cycle.
E. Technique of Collecting Data
The technique of collecting data is aimed to support the success of research. The purpose of this research is to get the data and information about the process of improves students' reading comprehension by using Team Assisted Individualization.
There are some instrument that use in this research, those are: 1. Test
The researcher uses test for collecting the data of students' reading comprehension. According to Arikunto (2006: 150), test is sequence of questions or exercises and other instrument use to measure the skills, intelligence knowledge, and ability of the individual or group. In this research, the researcher divide the test in two, was as follows:
a. Pre-test
choice is scored one and the wrong answer of multiple-choice is scored zero.
b. Post-test
Post-test is given at the end of each cycle. Post-test is used to measure the effect of certain treatment. In this case, teaching learning reading comprehension by using Team Assisted Individualization. This test also consisted 20 item of objective test (multiple-choice test). The right answer of multiple-choice is scored one and the wrong answer of multiple-choice is scored zero. 2. Observation
According to Kellinger in Arikunto (2006: 222), observation is common term which means all form of accepting data by recording the event, counting, measuring, and writing it. Observation is used to supporting technique for collecting data. It has function to know the real description in teaching learning process by using Team Assisted Individualization. The students' response before and after using this technique could be known through this observation.
Table 3
The Students’ Observation List
No Student Name
Students Activities Asking Question Answering Question Cooperative in Discussion Initiating in Doing Task 1 2 3
After getting the result of students' activities, the researcher use table percentage to know the quality of students' participation. Those are follows:
Indicator’s Percentage Level of Students’ Participant
76% - 100% Very Good
46% - 75% Good
30% - 45% Enough
0% - 29% Poor
Table 4
The Teacher’s Observation List
No. Teacher Activities Score
Yes No
1 Giving apperception
2 Giving the aims of learning
3 Conditioning the students into group 4 Giving motivation and encouragement 5 Giving the description about the material
that will be learned 6 Monitoring the students 7
Guiding the students in discussion in their group of Team Assisted Individualization (TAI)
8 Give opportunity to ask question and give opinion
3. Questionnaire
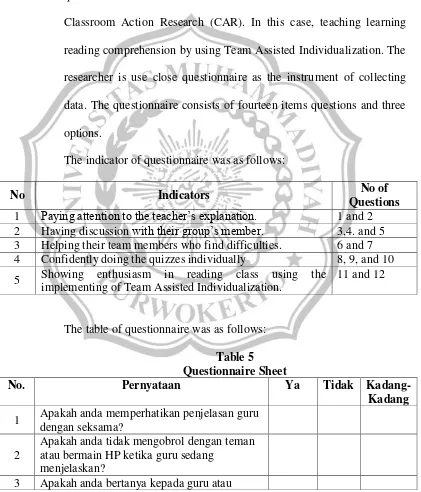
According to Arikunto (2009: 194), questionnaire is a number of written questions to elicit information about respondents' personalities or the other things that they know. The aim of questionnaires is for description and measurement. In this research, the questionnaire is used to describe the students' interest at the end of Classroom Action Research (CAR). In this case, teaching learning reading comprehension by using Team Assisted Individualization. The researcher is use close questionnaire as the instrument of collecting data. The questionnaire consists of fourteen items questions and three options.
The indicator of questionnaire was as follows:
No Indicators No of
Questions 1 Paying attention to the teacher‟s explanation. 1 and 2 2 Having discussion with their group‟s member. 3,4. and 5 3 Helping their team members who find difficulties. 6 and 7 4 Confidently doing the quizzes individually 8, 9, and 10 5 Showing enthusiasm in reading class using the
implementing of Team Assisted Individualization.
11 and 12
The table of questionnaire was as follows: Table 5 Questionnaire Sheet
No. Pernyataan Ya Tidak
Kadang-Kadang 1 Apakah anda memperhatikan penjelasan guru
dengan seksama? 2
Apakah anda tidak mengobrol dengan teman atau bermain HP ketika guru sedang
menjelaskan?
teman kelompok anda, ketika ada materi yang tidakandapahami?
4
Apakah anda bertukar informasi dengan teman kelompok anda untuk menambah pengetahuan mengenai materi yang sedang dibahas?
5 Apakah anda tidak merasa bosan saat harus melakukan diskusi kelompok?
6
Apakah anda membantu sesame anggota kelompok dalam menguasai materi pelajaran atau memecahkan masalah?
7
Apakah anda peduli dengan kesulitan yang dihadapi teman sekelompok anda dalam menguasai materi atau memecahkan masalah? 8 Aapakah anda mengerjakan kuis yang guru
berikan?
9 Apakah anda merasa yakin apabila menjawab kuis dengan jawaban sendiri?
10 Apakah anda percaya diri dalam mengerjakan kuis?
11
Apakah anda bersemangat dalam mengikuti pelajaran dengan model Team Assisted Individualization?
12
Apakah anda mengikuti pelajaran dengan model Team Assisted Individualization bukan karena diminta guru?
4. Documentation
research uses the form of data of the number of students, photograph
documents of the students‟ activities in teaching learning process.
F. The Validity of Data
For getting good data of the research, the instrument must have some characteristic such as; validity, reliability, and difficulty level. 1. Validity
Validity is measurement that indicates the level of validity of an instruments is valid if can measure. According to Arikunto (1990: 129), validity is defined as the appropriateness of given test or any of its component part as measure of what it is purposed to measure.
To find the validity of the test items, this research used the product moment correlation as follows:
( )( )
√* ( ) + * ( ) +
Where:
: Validity of test
: The total number of respondent : The sum of the scores in x distribution : The sum of the scores in y distribution
2. Reliability
Reliability of the test is consistency of the test result. It means that when the test is administrated to the same candidates on different action the result is consistent. Reliability is an instrument that can be trusted to use as a tool for collecting data because the instrument is already good (Arikunto, 2006: 178), this research used formula as follows:
[ ] [ ]
Where:
: Reliability of instrument : The sum of test items
: Standard derivation of students score
: The sum of multiplication between the proportion of the students who answer correctly and the proportion of the students who have wrong answer.
3. Item Difficulty
To know the item is difficult or not for the students, the formula which is used to find out the difficulty index as follows:
Where:
F : the numbers of correct answer of each item N : the number of respondent
Heaton (1979: 173) stated that item is said to be difficult if the index of difficulty was less than 0.31 and it was said to be easy if the index of difficulty more than 0.71. It was supported by Arikunto (1998: 209) that gave some following criteria for the item difficulty of test.
- 0.00 – 0.30 is difficult - 0.31 - 0.70 is fair - 0. 71 – 1.00 is easy
G. Technique for Analyzing Data
Analyzing data is a processing or tabulation of data using formulas or rules which is appropriate with the approach. In this research, the researcher used two forms of data analysis techniques to count the data in each cycle; those are qualitative and quantitative data analysis techniques.
1. Qualitative Data Analysis Technique
Miles and Huberman (1992: 17-21) stated that the data analysis in mentioned research as analysis episodes which a dynamic process. To make it clear, the following schema will show the activities of the process sequence.
Figure 3
The Sequence Process of Qualitative Data
From the scheme above, Milles and Huberman in Burn (1999: 20) states that through reducing data, raw data were simplified. The data that will be reduced in this research is the raw data that comes from observations. By reducing data, the data could be simplified and classified in many ways through tight selection, summary, or short analysis. From reducing data, data are accounted into percentage list. The next step is presentation of data. In this research, the data related to the percentage of learning activities improvement that successfully achieved by researcher will be presented in the form of diagrams, whereas other data will be presented in the form of tables. Presentation is an information group that give a chance makes a conclusion. Seeing presentation we will understand the students' improvement.
2. Quantitative Data Analysis Technique Collecting Data
Presenting Data Making Data
The data should be analyzed after are collected. In classroom action research, the quantitative data will be analyzed by using a descriptive quantitative which the result will be presented in percentage, mean, and frequency. The data that will be collected from data test, observation, and questionnaire are going to be presented in percentage.
a. Observation Percentage
Each of students‟ participation is accounted by using descriptive quantitative analysis in percentage.
Where:
P : percentage
F : the number of students who participate N : number of all students
b. Questionnaire Percentage
To know the questionnaire percentage, the researcher use formula as follows:
Where:
P : percentage
c. Mean
To measure how good the improvement of averages score reading of students test using Team Assisted Individualization (TAI) technique by following the formula that used as follows:
Where:
∑x : the sum of individual score N : the number of students d. Test Improvement
To know the improvement in pre-test and post-test, the research used the following formula as follows:
Where:
P : percentage of student‟s improvement y : Pre-test result
Indicator of success will be made to determine the success of the research. Sudikin, et al (2002: 113) determines success of action based on the consideration by collaborator teacher and the researcher.
In this research, the researcher and the collaborator teacher decided that the success indicator in this research is based on the students' improvement. In this research, criterion of the action success is determined to reveal whether the action was success based on the result of reading test that was supported by observation and questionnaire. The action will be successful and stop when there are some improvement in the students'
reading test score, the score average ≥77 as KKM, the learning completeness (students who reached KKM) reached ≥85% and there were