Journal of Public Economics 80 (2001) 141–167
www.elsevier.nl / locate / econbase
Government credibility and policy choice: evidence from
the Pennsylvania earned income tax
* Koleman S. Strumpf
Department of Economics, University of North Carolina at Chapel Hill, Gardner Hall, CB3305, Chapel Hill, NC 27599-3305, USA
Received 1 March 1999; received in revised form 1 August 1999; accepted 1 September 1999
Abstract
This paper considers the decision of Pennsylvania communities whether to levy a 1% wage tax. While a simple political economy model suggests this tax should be enacted when many residents are exempted from the tax, the opposite pattern seems to hold. One explanation is that residents may mistrust their government and fear that the new tax monies will be spent unwisely. Several implications of this credibility story are consistent with the data, and non-taxing communities tend to have low credibility (as measured by three proxies). In addition, after controlling for credibility the proportion of exempt residents is positively associated with the probability of enacting the wage tax just as the political economy model suggests. 2001 Elsevier Science B.V. All rights reserved.
Keywords: Second-best taxation JEL classification: D7; H7
1. Introduction
Significant new policy initiatives are sometimes met with voter skepticism. While such proposals are often accompanied by a promise that future government involvement will be limited and well defined, these promises are not binding. Presumably voters are only likely to favor giving new policy instruments to
*Tel.: 11-919-966-4485; fax:11-919-966-4986. E-mail address: [email protected] (K.S. Strumpf).
142 K.S. Strumpf / Journal of Public Economics 80 (2001) 141 –167
governments they trust. This paper provides some of the first formal evidence that the credibility of government promises influences policy outcomes. Pennsylvania allows municipalities to levy a 1% wage tax but exempts certain citizens from the tax. These exempt citizens should lobby for the tax in their home community, since they benefit from any new public services or tax relief the collections provide. A simple political economy model predicts that communities with a larger proportion of exempt citizens should be more likely to enact a wage tax. However, two such exempt groups, commuters to Philadelphia and other states, seem to have the opposite effect: Maps 1–3 show that few of the communities located near the Philadelphia or state border have the tax.
One explanation for this seeming inconsistency involves government credibility. Although politicians typically promise to devote wage tax collections to property
K.S. Strumpf / Journal of Public Economics 80 (2001) 141 –167 143
Map 2. Earned income tax in 1980 (shaded communities have tax).
tax relief, opponents argue they will renege and unwisely spend the new revenue. There are two reasons to believe such concerns are most acute in the non-taxing communities. First, suburban governments on the Philadelphia and state border tend to have a lower credibility ranking, with credibility measured by public overhead expenditures, public sector unionization rates, and recent tax burden
1
changes. Second, the non-taxing governments must exceed a higher credibility threshold in order to gain citizen approval to tax. This is because their larger exempt population reduces wage tax collections and thus the potential for property tax relief. I find statistical support for these two contentions in hazard model
1
144 K.S. Strumpf / Journal of Public Economics 80 (2001) 141 –167
Map 3. Earned income tax in 1992 (shaded communities have tax).
estimates of tax levying propensity. In addition the exempt groups have a positive effect on taxing probability in hazard estimates which control for credibility, just as the political economy model predicts. These estimates suggest that credibility concerns play an important role in explaining the variation in wage tax levying.
K.S. Strumpf / Journal of Public Economics 80 (2001) 141 –167 145 credibility can be used to explain empirical anomalies. For example, explicit consideration of government credibility might provide new insights into the mixed empirical record of the median voter model which ignores the role of political intermediaries (see the review in Mueller, 1989). Third, this paper provides a methodology for testing the empirical importance of government credibility. While other authors have highlighted the theoretical role of government credibility (see the survey in Persson and Tabellini, 1994), the empirical evidence to date has relied on one-time cross-sectional surveys (e.g. Courant et al., 1980; Ladd and Wilson, 1982). The main disadvantage of using surveys is that they are often unavailable. The three credibility proxies which I use can be widely applied elsewhere due to their availability at the federal, state and local level [Bureau of the Census (various years, a,b)].
2. The Pennsylvania earned income tax
2.1. Background
Pennsylvania municipalities have been allowed to levy an earned income tax (EIT), or wage tax, since 1947. By 1992 there was a 92% EIT adoption rate with the few non-leviers nearly all located in the Philadelphia suburbs. A brief overview of the three key characteristics of the wage tax will provide some insight into this pattern. First, any sub-county government has the power to levy a tax. Second, individual tax payments cannot exceed 1% of wages. Those with only passive income, such as the retired, pay no taxes. Third, residence takes precedence over work so an individual is liable for workplace taxes only if his home community’s rate is below the 1% cap. The one important exception to this rule is that commuters to Philadelphia or to other states pay wage taxes at work but not at home. Therefore, when a community levies a new wage tax, two groups will not face a higher wage tax burden: those fully exempted from the home wage tax (the retired, commuters to Philadelphia, and commuters to other states) and those who transfer their wage tax payments from work to home (commuters to a taxing municipality).
146 K.S. Strumpf / Journal of Public Economics 80 (2001) 141 –167 2.2. A simple wage tax levying model
In practice the wage tax is almost always set at the maximal rate and is rarely
2
repealed. Thus, this paper focuses on the binary levying decision of a community. To begin I will present a simple political economy model where the wage tax serves primarily as a redistributive device. Suppose that citizens benefit from some publicly funded service in their home community but dislike taxes. Citizens have identical tastes and own identical property of value P. There are workers who
]
inelastically supply a single unit of labor and receive wages w5w, and the retired
who have no wages w50. Wages are taxed at rate tw and property at rate tp. Citizens have a linearly separable utility function over public services, taxes, and the value of property and wages:
work work
U(w,tw )5B(R)2tpP2max(tw,tw )w1V(P)1w (1)
The first term is the benefit from the public service when total tax revenues are R and B9 .0. The second term is the property tax bill while the third term is the wage tax bill which only workers need pay. Notice that workers pay the maximum of the residential and workplace wage tax rates. The fourth and fifth terms are the utility benefit of property and wages where V9 .0. Normalizing the population size to one, a community collects total tax revenues:
]
R5tpP1(12f )tww (2)
where f[[0,1] is the fraction of citizens exempt from home wage taxes. By definition the exempt group includes the retired and those who commute to Philadelphia or to other states. Notice from (1) that a new residential wage tax will not increase the tax burden on either the exempt citizens or citizens already paying
3
a workplace wage tax. However, (2) shows that tax revenues are decreasing in the fraction of exempt citizens but not in the fraction of citizens paying a workplace wage tax.
I will presume the wage tax revenues are solely used to reduce property taxes though this is not crucial for the main result. Since a wage tax levy will not change the level of public spending, it influences citizen welfare only through its effect on
4 ]
tax burdens. A revenue-neutral wage tax at rate tw (the 1% rate cap) will lower
2
To be more specific, 95.8% of Philadelphia area communities had rates of 0 or 1% in 1992. Of the 146 communities that ever levied a wage tax in the Philadelphia area only one repealed its tax, and a few years later that tax was re-enacted.
3
Philadelphia and interstate commuters do not pay additional taxes since their workplace rate exceeds the residential rate cap while citizens paying a workplace wage tax are presumed to already face a rate at the cap.
4
K.S. Strumpf / Journal of Public Economics 80 (2001) 141 –167 147
] ] ˆ
* *
the property tax rate from an initial ratetp totp;t 2p (12f )tww /P.
Substitut-ing this into (1) gives the effect of a wage tax levy on each citizen’s welfare:
work
The simplest political economy model posits that a wage tax will be levied if it benefits a majority of residents. This suggests a community will levy a wage tax
work ]
when most of its citizens pay a wage tax at work (tw $tw) or are exempt. Moreover, in the special case where no one is exempt ( f50) a central city wage tax levy should induce the surrounding communities to enact their own wage tax. This is because commuters to the city will strictly favor the tax [the top bracket of (3)] while everyone else is indifferent because their tax bills are unchanged [the bottom bracket of (3)]. The intuition is that the suburban wage tax allows collection of taxes which many citizens would have otherwise paid to the city.
This prediction fits the typical pattern of tax propagation (outside of the Philadelphia area). For example, prior to 1954 Pittsburgh and almost all of its suburban communities lacked a wage tax. When the city levied a wage tax in March 1954, nearby governments quickly matched the action. By year’s end more than three-fourths of the communities within the Pittsburgh metropolitan area had their own tax and the remainder soon followed. This pattern of tax clustering was repeated in other metropolitan areas, and by the early 1960s virtually every community outside of the Philadelphia suburbs had levied a wage tax.
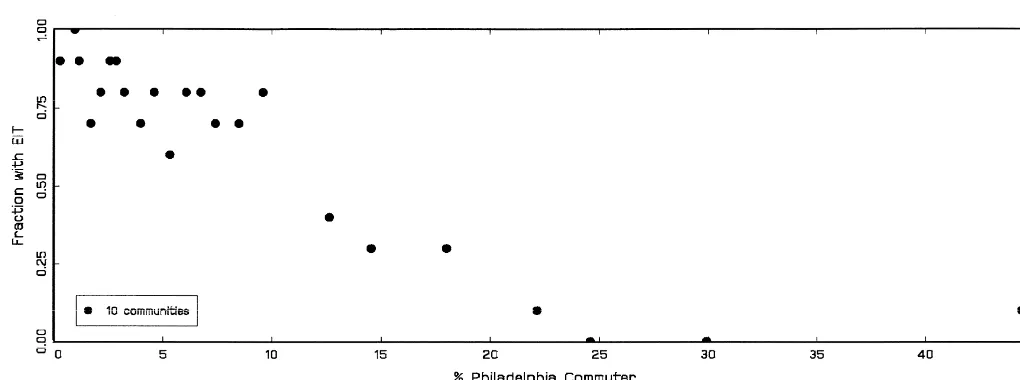
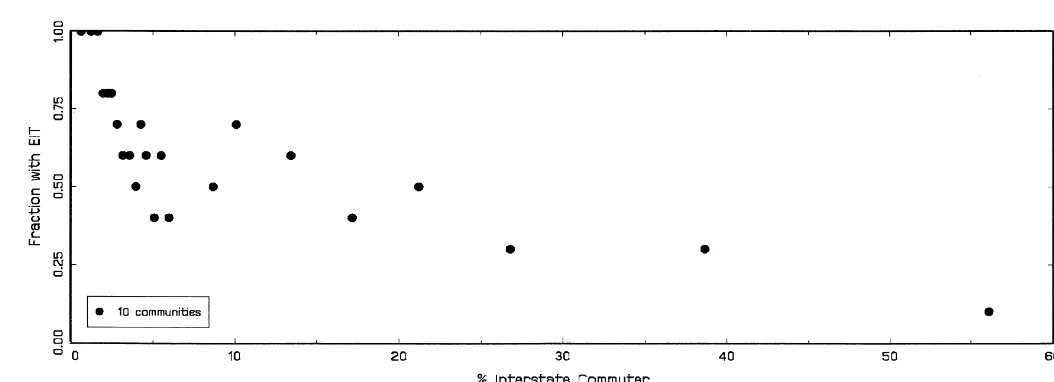
The model is less successful in explaining the Philadelphia area. Recall that Philadelphia’s special taxing privilege exempts commuters into the city from home wage taxes. The Philadelphia region is also near commuting centers in other states, such as Wilmington and Trenton, creating a second pool of exempt citizens. Since people tend to work close to home, the simple political economy model predicts that communities along the city and state border should levy first and that their neighboring communities should eventually follow. Maps 1–3 show the actual pattern of wage taxes in 1970, 1980 and 1992. While the predicted wage tax clustering does occur, communities near the Philadelphia and state border either delay enactment or never levy the tax at all. This contradicts the simple political economy model since the non-levying communities have a higher percentage of citizens who are exempt from home wage taxes (Figs. 1 and 2).
2.3. A credibility model
148
K
.S
.
Strumpf
/
Journal
of
Public
Economics
80
(2001
)
141
–
167
K
.S
.
Strumpf
/
Journal
of
Public
Economics
80
(2001
)
141
–
167
149
150 K.S. Strumpf / Journal of Public Economics 80 (2001) 141 –167
from the wage tax. This credibility argument played a central role in actual wage tax debates. Based on my review of The Philadelphia Inquirer (1981–1992) archives, I found that wage tax opponents almost universally cited concerns about whether their government could be entrusted with additional tax revenues.
Suppose again that the citizens are deciding whether to approve a wage tax at
]
ratetw. If the wage tax is rejected the status quo is maintained. If the wage tax is
5
approved the outcome depends on the government’s type. A credible government will implement the wage tax in an efficient, revenue-neutral fashion as in the last section. A non-credible government will waste all of the wage tax revenue. This means there is no property tax relief, and the higher tax burden imposes a per capita loss of L.0. This loss occurs because the increased tax burden should make the community less attractive and lead to a reduction in property value,
6
L5 2V9(P) dP where dP,0. Citizens are uncertain about their government’s type but believe the probability of a credible type is q.
The model has an alternative interpretation in which governments behave in a less extreme fashion. Suppose government types are continuous and indexed by q. Here q measures the proportion of wage tax revenues which are allocated in the promised fashion and can be interpreted as a credibility rating. 12q represents the
proportion of wage tax revenue which is wasted. Under this interpretation, citizens have point beliefs on the government type or have an expected type, eqg( q) dq
where g( q) is the density of citizen beliefs. Also, the loss term L is proportional to 12q.
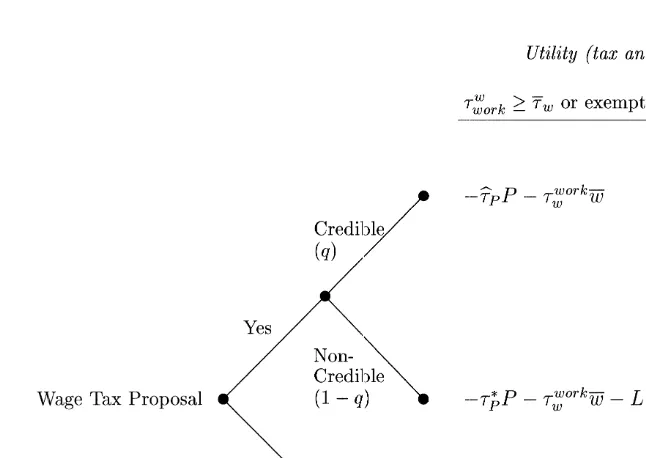
Under either interpretation, Fig. 3 summarizes the final citizen welfare. The formulae in Fig. 3 can be used to calculate the net expected welfare gain from
ˆ
approving the wage tax. Substituting the definition oftpand some algebra yields:
EIT work
The bottom bracket shows that non-exempt citizens who do not currently pay the wage tax will strictly oppose a home levy. The top bracket shows that citizens facing a workplace wage tax and the exempt will support a home levy only if they believe their government has a high credibility rating:
L
EIT
˜ ]]]
DEUpay EIT at work or exempt.0⇔q.q;L1WB (5)
5
The results in this section can be extended to allow for a self-interested government which strategically sets taxes (this model is available upon request).
6
K.S. Strumpf / Journal of Public Economics 80 (2001) 141 –167 151
Fig. 3. Wage tax proposal with credibility concerns.
˜
Notice that the credibility threshold q is decreasing in the size of the wage tax
] ]
base, WB;(12f )tww. In particular the credibility threshold will be quite high
when there are many exempt citizens ( f→1, such as near the Philadelphia or state border) and low when there are few exempt citizens ( f→0, such as near Pittsburgh). This suggests that credibility concerns will be an important issue in the Philadelphia suburbs but not in the Pittsburgh suburbs.
The model in this section identifies two conditions which are needed for a wage tax levy. First, citizens must believe their government’s credibility rating exceeds
˜q. Second, a significant proportion of the citizens must be exempt or pay the wage
tax at work. In contrast the redistributive model from Section 2.2 only requires the second condition. The remaining sections of the paper consist of empirical tests of these models. The presumption that drives the empirical methodology is that citizens form their beliefs, q, about their government’s type using publicly observable characteristics. Differences in these characteristics across communities will provide the heterogeneity which will identify the wage tax levying estimates. An unpublished appendix (available upon request) discusses several possible explanations for the inter-community variation in credibility, some empirical support for these conjectures, as well as a rationale for why governments near
7
Philadelphia may have low credibility.
7
152 K.S. Strumpf / Journal of Public Economics 80 (2001) 141 –167
Before turning to the empirical analysis, one implicit assumption in the credibility model needs to be justified. The model assumes that citizens control the wage tax decision but have only limited control over other budget matters. That is, once citizens grant permission to levy a wage tax politicians have considerable discretion on how to use the additional revenues. There are two reasons for this difference in control. First, it is easier for citizens to monitor and influence the wage tax decision. This is because a wage tax proposal is a one-time event and a simple binary choice. Alternatively, new budgets are set each year and involve dozens of spending and taxing categories. Given most citizens’ time constraints, close monitoring of the full budget is likely to be infeasible. Second, citizens have greater access to policy-making meetings in which a wage tax is being proposed. This is because the Pennsylvania Sunshine Law only requires 24 hour notice for meetings in which an ordinary budget is discussed or adopted. Alternatively, it guarantees greater public access when a significant new policy (like a wage tax) is
8
being debated.
Some additional questions relating to the setup of the credibility model are
9
addressed in an appendix which is available upon request.
3. Empirical specification and data
3.1. Empirical specification
The objective is to estimate a specification of wage tax levying behavior based on the credibility model of Section 2.3 (which admits as a special case the redistributive model of Section 2.2). The first condition for a wage tax levy is that citizens believe their government satisfies the minimum credibility condition, (5). This equation is not empirically implementable because L, the utility loss from excessive taxes, is unobserved. Instead I will treat L as a random variable. Then (5) is satisfied when:
L,h( q)WB (6)
where h( q);q /(12q) is an increasing function of the citizens’ credibility beliefs.
8
In practice a typical budget is often created, debated and passed in under a week while it is virtually impossible to avoid a well advertised public meeting when a wage tax is proposed. Citizen control over normal budget matters was particularly limited prior to 1987 when the Sunshine Law’s predecessor, the Open Meetings Law, was in effect. The Open Meetings Law allowed all but the most significant policy changes to be made in ‘workshop sessions’ from which the public was excluded.
9
K.S. Strumpf / Journal of Public Economics 80 (2001) 141 –167 153 The second condition for a levy is that a significant proportion of the citizens expect to benefit from the wage tax. While community decisions are made by majority rule, some citizens may not participate in the political process. A specification which captures this stochastic political participation is:
Benefit Group1e .0.5 (7)
where ‘Benefit Group’ is the proportion of citizens benefiting from the wage tax (those who are exempt or who pay a workplace wage tax), and e is a random variable capturing the non-deterministic factors such as weather which influence political participation. Combining (6) and (7), the probability of community i enacting a new levy in year t is:
-Pr(first levy at t for i ) 5 Pr(Lit,h( q )WB andit it e .it 0.52Benefit Group )it
-; l(h( q )WB , Benefit Group )it it it
(8)
The rationale for including a dynamic element is that the credibility model reflects the decision which a community must make each year regarding a wage tax.
A proportional hazards functional form will be used to estimate (8). The probability of a new levy is:
l(t, X (t))i ;l0(t) exp(X (t)i b) (9) where X (t)i ;[h( q )WBit ituBenefit GroupituControls ], ‘Controls’ are other factorsit
which influence the tax decision but are omitted from the stylized model (Section 3.2), b is a vector of unknown parameters, andl0(t) is the baseline hazard which captures period specific effects. A convenient property of this form is that 100b
measures the percentage increase in the probability of a new levy due to a differential increase in variable X. Since the baseline hazard is generally uninteresting in this setting, a Cox partial likelihood [which does not require
10
specifying the functional form of l0(t)] will be employed. Kalbfleisch and Prentice (1980) derive the log-likelihood and show how to account for right-censoring in this case.
3.2. Data
The estimates are based on annual observations from 1960 to 1992 for the 237 suburban municipalities in the Philadelphia Standard Metropolitan Statistical Area (SMSA). I select 1960 to begin the sample since none of the municipalities had enacted a wage tax prior to this year (thus avoiding the econometric complications
10
154
Variable Source Mean S.D. Max Min
Percentage with wage tax PDCA 32.39 – – –
Government overhead index PDCA 1.61 0.47 4.07 0.00
Public sector unionization index Census 80.82 26.90 100.00 0.00
DTax burden index PDCA 3.93 0.18 8.02 0.00
Percentage exempt from home EIT Census, Calc. 29.91 16.75 98.30 4.76
Percentage of Philadelphia commuters Census 11.58 13.05 69.16 0.00
Percentage of interstate commuters Census 8.12 11.19 72.37 0.00
Percentage who face work EIT (excludes Philadelphia) Census, PDCA, Calc. 27.16 28.18 96.78 0.00
Percentage of seniors Census 10.21 3.96 32.10 1.80
Percentage of home ownership Census 74.76 11.44 96.21 27.54
3
WB (wage tax base per capita310 $) Census, PDCA, Calc. 6.05 3.30 28.24 0.04
3
P (assessed property value per capita310 $) PDCA 4.83 2.35 15.24 0.67
WB /P Census, PDCA, Calc. 1.57 1.08 9.19 0.01
State highway aid per capita PDCA 15.28 8.16 73.09 0.00
Government deficit (% expenditure) PDCA 29.98 29.17 38.71 2306.57
Cities (number) PDCA 2 – – –
Boroughs (number) PDCA 88 – – –
Distance from Philadelphia (miles) Calc. 12.03 9.85 40.00 0.00
Jobs per capita DVRPC, CIR 0.44 0.40 4.67 0.00
3
Median household income (310 $) Census 40.09 10.70 114.89 10.85
3
Population (310 ) Census 8.18 11.73 95.91 0.42
Population growth percentage Census 1.44 2.22 13.89 26.42
Business property percentage (area) DVRPC 30.95 19.16 81.20 0.00
Percentage of registered Republicans PaMan, Pers. 68.56 12.40 94.60 16.51
Percentage who reject a wage tax PhilInq 0.81 – – –
DReal property tax rates DVRPC 20.04 0.74 30.84 210.73
a
Sources: Calc., author’s calculation; Census, Department of Census [Bureau of the Census (1972–1987, 1960–1990a, 1960–1990b)], and Bureau of Transportation Statistics, Department of Transportation (1980, 1990); CIR, County Industry Report (Pennsylvania Department of Internal Affairs, 1961); DVRPC, Delaware Valley Regional Planning Commission (1979, 1984, 1993) and (1984, 1994); PDCA, Pennsylvania Department of Community Affairs (various years, a,b); PaMan, The Pennyslvania Manual [Department of General Services (1978–1993)]; Pers., personal correspondence (County Board of Elections, 1992); PhilInq, The Philadelphia Inquirer (1981–1992).
b
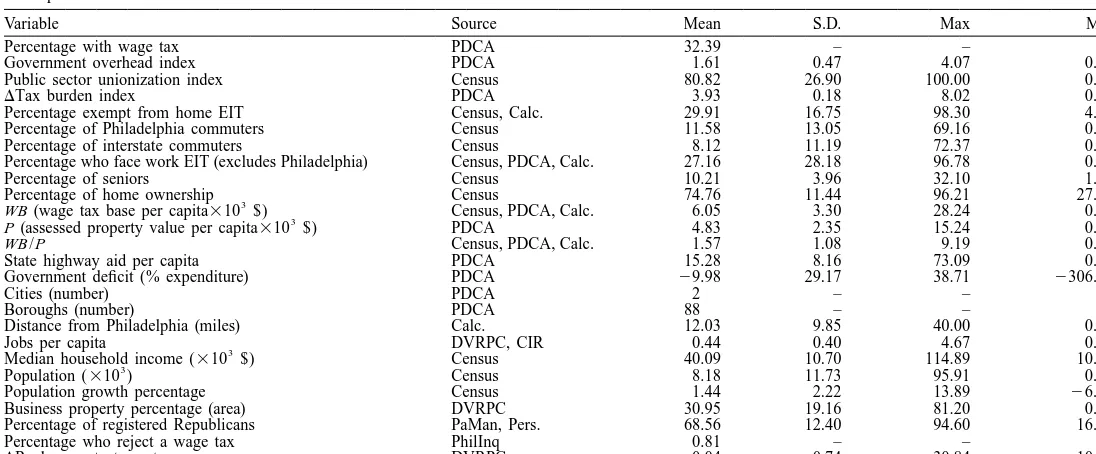
K.S. Strumpf / Journal of Public Economics 80 (2001) 141 –167 155 of left-censoring in the hazard estimates). This section briefly describes the variables used in the analysis. Technical details as well as a description of the dependent variables used in auxiliary regressions are contained in a data appendix which is available upon request. Table 1 lists descriptive statistics and sources for each of the variables.
The first set of variables are in the credibility model. The fiscal variables come from the Pennsylvania state archives: a dummy for wage tax levies, the per capita wage tax base, the per capita (assessed) property tax base, and two of the government credibility proxies — government overhead spending and the change in tax burden (Section 4.2). The remaining variables from the model are based on census records: the number of Philadelphia commuters, the number of interstate commuters, the number of citizens facing a workplace wage tax, the number of
11 12
senior citizens, the number of home owners and the third credibility proxy — the public sector unionization rate. All citizen groups are converted to percentage terms to maintain comparability across communities: commuters divided by the total number of workers, senior citizens divided by the overall population, and owner-occupied homes divided by the total number of homes. The proportion exempt, f, is the sum of the Philadelphia commuters, interstate commuters and senior citizen terms.
In addition to these variables from the model, several ‘controls’ are included as
13
explanatory variables in the hazard estimates. State highway aid per capita is included since this is the predominant form of non-tax revenue for municipalities in this sample. The government operational deficit (which excludes capital expenditure) is used to check whether tax levies are linked to fiscal distress or revenue shortfalls. Dummies for cities and boroughs are added (the omitted
14
category is townships) since government structure might influence tax choice. County dummies account for variation in property reassessment (Strumpf, 1999) while distance from Philadelphia accounts for special features of inner-ring suburbs such as land or wage premia. Jobs per capita is included to see whether labor-intensive firms deter wage taxes, while median household income, popula-tion and populapopula-tion growth rates are added to account for demographic differences. Finally, two potential explanatory variables are only available for a portion of
11
All senior citizens are presumed to be retired and so pay no wage taxes.
12
While the theory does not distinguish between home owners and renters, there is empirical evidence that home owners overestimate and renters underestimate their incidence of a property tax (Martinez-Vazquez and Sjoquist, 1988). If such perceptions hold here, home owners should favor a wage tax since they would disproportionately benefit from the resulting property tax reduction.
13
Sophisticated communities might enact a wage tax when there is a large pool of non-residents eligible to pay the tax. But tax exporting quickly becomes ineffective as neighboring governments implement their own wage tax. I show elsewhere (Strumpf, 1998) that the non-resident tax base has an insignificant effect on wage tax levying propensity.
14
156 K.S. Strumpf / Journal of Public Economics 80 (2001) 141 –167
the sample period. First, the percentage of land devoted to commercial use measures the importance of business interests which may be under- or over-represented in the political process. This land use variable only exists back to 1970. Second, a citizen’s political affiliation might reflect his preferences for the appropriate size of the public sector. Municipal registration figures — the Republican share of the two-party affiliation — are only available for 1960, 1970, 1978 and 1992. Neither of these variables are included in the main hazard specification to preserve the sample size.
Most of the variables described above are observed annually, but some are observed less frequently. For the latter variables, I follow Diamond and Hausman (1984) and use a linear interpolation to construct values for intermediate years.
4. Empirical results
4.1. Preliminary comparisons
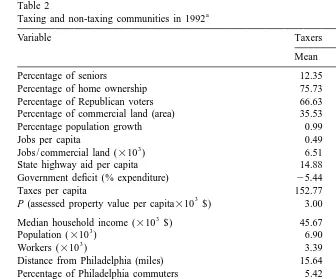
Before turning to the hazard estimates, it is useful to informally compare taxing and non-taxing communities. Characteristics which do not noticeably differ between the two groups are unlikely candidates to explain wage tax levying decisions whereas those which stand in sharp contrast are more likely to play a central role. Of course this kind of cross-sectional analysis may mask potentially important dynamic variation which only more rigorous techniques will detect. The first few rows in Table 2 list several characteristics which do not significantly differ between taxing and non-taxing communities in 1992: the percentage of senior citizens, the percentage of home ownership, the percentage of Republican voters, the percentage of commercial land, the population growth rate, the number of jobs per capita (or per commercial area), the level of state highway aid per capita, the government deficit, the tax revenue per capita, and the assessed
15
property value per capita. I will return to these variables in Section 5.
Other characteristics are significantly different in 1992. The non-taxing com-munities tend to have higher median incomes, larger populations (either total or working population), closer proximity to Philadelphia, higher percentages of Philadelphia and interstate commuters, higher percentages of citizens exempted from a home wage tax, and lower percentages of citizens facing a workplace wage tax. In addition non-taxing governments devote a significantly larger proportion of their expenditure to administrative overhead, have a higher rate of unionization among their employees, and have recently implemented larger tax increases (for reasons which will be explained in Section 4.2, these three variables are reported as the maximum minus the actual value).
15
K.S. Strumpf / Journal of Public Economics 80 (2001) 141 –167 157 Table 2
a
Taxing and non-taxing communities in 1992
Variable Taxers Non-taxers
Mean S.D. Mean S.D.
Percentage of seniors 12.35 4.11 14.08 4.58
Percentage of home ownership 75.73 13.15 74.67 12.03 Percentage of Republican voters 66.63 10.77 67.58 13.18 Percentage of commercial land (area) 35.53 17.55 37.02 18.50
Percentage population growth 0.99 1.50 0.70 1.73
Jobs per capita 0.49 0.43 0.53 0.45
3
Jobs / commercial land (310 ) 6.51 18.13 7.08 19.68
State highway aid per capita 14.88 5.34 12.54 4.53
Government deficit (% expenditure) 25.44 15.19 24.46 14.13
Taxes per capita 152.77 75.83 166.66 104.38
3
P (assessed property value per capita310 $) 3.00 1.16 2.94 1.83
3
Median household income (310 $) 45.67 11.16 55.08 12.23
3
Population (310 ) 6.90 7.07 12.81 15.60
3
Workers (310 ) 3.39 3.51 6.29 7.67
Distance from Philadelphia (miles) 15.64 9.30 6.24 7.82 Percentage of Philadelphia commuters 5.42 5.39 16.64 11.84 Percentage of interstate commuters 6.55 8.00 14.91 15.88 Percentage exempt from home EIT 24.32 10.15 45.63 13.39 Percentage who face work EIT (excludes Philadelphia commuters) 64.38 15.22 20.92 12.82
Government overhead index 2.39 0.52 1.45 0.71
Public sector unionization index 86.95 16.32 67.21 15.45
DTax burden index 5.12 1.89 2.98 1.46
3
WB (wage tax base per capita310 $) 7.77 2.00 6.44 2.21
a
Sample: 237 suburban communities in Philadelphia SMSA during 1992 (N5237). Index, indicates the maximum minus the level of that variable (Section 4.2). Percentage exempt from home EIT; Percentage of Philadelphia commuters1Percentage of interstate commuters1Percentage of seniors.
Perhaps the most surprising result is that taxing and non-taxing communities have comparable sized wage tax bases. The taxing communities have a mean per capita wage tax base of $7800 while non-taxing communities have a mean wage tax base of $6400. While the non-taxing communities have a much higher proportion of exempt citizens, this disadvantage is largely offset by their higher income levels.
4.2. Credibility proxies
158 K.S. Strumpf / Journal of Public Economics 80 (2001) 141 –167
inputs or reflect some unobserved input in this citizen evaluation process. While it is not possible to be sure that these ‘credibility proxies’ in fact measure government credibility, several tests suggest they do.
The proxies I consider are government overhead spending, the public sector unionization rate, and the change in tax burden (details on their construction are contained in a data appendix which is available upon request). Each of these variables could reflect how governments will utilize wage tax revenues. Govern-ment overhead — which includes spending on legal staffs, personnel administra-tion, and planning — is the only local government expenditure category which is not associated with a well-defined service such as street maintenance or trash removal. Non-credible governments are likely to engage in excessive overhead spending as an outlet for their inefficient spending. For example, Strumpf (1998) shows that overhead helps explain the degree to which governments engage in flypaper spending. Public sector unions are likely to bind the government and to demand spending which benefits their members rather than the public at large. Stronger unions will be able channel new wage tax revenues towards spending rather than to the promised property tax relief. Gyourko and Tracy (1989) cite evidence that public sector unions bargain for higher wages, a smaller work force,
16
and thus a lower level of services relative to the taxes collected. Tax increases have historically heightened citizen distrust of government and so could be expected to result in lower credibility ratings. Stein et al. (1983) find that citizens are more likely to sign tax limit proposals when they have just experienced a tax increase while Peltzman (1992) shows that citizens vote against federal and state
17
politicians who oversee spending growth. To maintain comparability with the model, each proxy is subtracted from its maximum value. This transformation yields an ‘index’ which can be interpreted as a measure of credibility just like the function h( q) in (6).
Various tests of the credibility interpretation of the three proxies are discussed in an unpublished appendix which is available upon request. The results there show that the proxies help predict which governments actually enact the wage tax in a revenue-neutral fashion, which wage tax proposals are blocked by citizens at public meetings, and which wage taxes result in a reduction of property value. Some more direct evidence is provided by unpublished data from a Pew Research Center (1997) survey of the Philadelphia metropolitan area. Counties in which a
16
In the results below I find a negative relationship between public sector unionization rates and wage tax levying propensity. This is evidence in favor of the credibility interpretation because public sector unions (and their members) should favor a wage tax.
17
K.S. Strumpf / Journal of Public Economics 80 (2001) 141 –167 159 higher percentage of respondents indicated they ‘did not trust their city or local government’ also have lower valued proxy variables. While these results should be interpreted with caution — they are based on a single point in time and are at a county rather than municipality level — they are consistent with the credibility interpretation of the proxies.
4.3. Hazard estimates
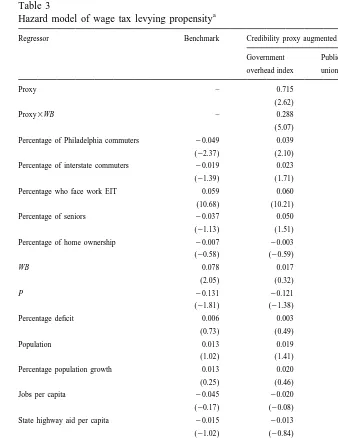
Table 3 contains estimates of (9), the hazard model of tax levying propensity. To fix ideas the first estimates involve a benchmark specification without the credibility proxies (column 1). This specification is based on the redistributive model in Section 2.2 where wage taxes are more likely to be levied when there are higher percentages of Philadelphia commuters, interstate commuters, citizens facing a workplace tax, senior citizens and possibly home owners (Footnote 12). The estimates are only partially consistent with this prediction. While the percentage of citizens facing a workplace wage tax has the expected positive parameter (row 5), the remaining groups have negative parameters (rows 3–4, 6–7). For example, the probability of a new levy falls by 4.9% when there is a 1 percentage point increase in Philadelphia commuters. These results are consistent with Table 2 which showed that non-taxing communities have a higher percentage of Philadelphia and interstate commuters.
The remaining specifications each include as explanatory variables one of the proxies and an interaction with the wage tax base, WB (columns 2–4). There are two important results in these augmented specifications. First, each proxy variable and its interaction with the wage tax base have significant positive parameters (rows 1–2). The interaction term has a much larger effect on levying probability than the direct term when evaluated at the mean wage tax base. For example, when the overhead proxy in column 2 is used, the interaction effect is over twice the
18
direct effect. This means that a proxy reduction delays tax levies, and that these delays are much longer when the wage tax base is relatively small. To the extent that the proxies measure citizen beliefs about government, this result is consistent with the credibility model: the minimum level of government credibility needed to
19
enact a wage tax is decreasing in the potential for property tax relief. Second, the groups receiving favorable treatment under the wage tax each have positive parameters (rows 3–6). This stands in contrast to the benchmark specification where senior citizens, Philadelphia commuters and interstate commuters each had
18
The direct effect on levying propensity isboverhead50.715 while the interaction effect (evaluated at the mean wage tax base) isboverhead3WB3WB50.28836.05;1.742.
19
160 K.S. Strumpf / Journal of Public Economics 80 (2001) 141 –167 Table 3
a
Hazard model of wage tax levying propensity
Regressor Benchmark Credibility proxy augmented
Government Public sector DTax overhead index unionization index burden index
Proxy – 0.715 0.024 0.446
(2.62) (2.49) (2.79) Proxy3WB – 0.288 0.008 0.152 (5.07) (6.23) (4.89) Percentage of Philadelphia commuters 20.049 0.039 0.029 0.043 (22.37) (2.10) (1.47) (2.37) Percentage of interstate commuters 20.019 0.023 0.051 0.021 (21.39) (1.71) (1.99) (1.61) Percentage who face work EIT 0.059 0.060 0.101 0.054 (10.68) (10.21) (6.35) (9.91) Percentage of seniors 20.037 0.050 0.125 0.061 (21.13) (1.51) (2.02) (1.95) Percentage of home ownership 20.007 20.003 20.001 20.008 (20.58) (20.59) (20.03) (20.86)
WB 0.078 0.017 0.008 0.092
(2.05) (0.32) (0.04) (1.67) P 20.131 20.121 20.086 20.178 (21.81) (21.38) (20.72) (21.99) Percentage deficit 0.006 0.003 20.014 0.006 (0.73) (0.49) (21.46) (0.94) Population 0.013 0.019 0.003 0.015 (1.02) (1.41) (0.10) (1.12) Percentage population growth 0.013 0.020 0.189 0.009 (0.25) (0.46) (1.82) (0.12) Jobs per capita 20.045 20.020 0.712 20.289 (20.17) (20.08) (1.65) (20.82) State highway aid per capita 20.015 20.013 0.018 20.019 (21.02) (20.84) (1.04) (21.27) County fixed effect? Yes Yes Yes Yes
N 7561 7486 3792 7344
log L 2542.41 2532.12 2212.61 2527.46
2
LR:bproxy,bproxy3WB50 (x2, 0.9959.21) – 14.24 17.31 12.79
a
K.S. Strumpf / Journal of Public Economics 80 (2001) 141 –167 161 Table 4
Correlation of interest group with credibility proxies
Regressor Government Public sector DTax burden
overhead index unionization index index Percentage of Philadelphia commuters 20.36 20.29 20.41 Percentage of interstate commuters 20.36 20.35 20.25 Percentage of senior citizens 20.27 20.38 20.31 Percentage of home ownership 20.11 20.06 0.01 Percentage who face work EIT 20.07 20.01 0.01
20
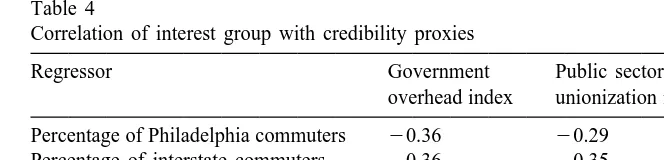
negative parameters. This sign change can be attributed to omitted variable bias. When a hazard model does not account for a significant explanatory variable, the parameters of highly collinear variables will incorporate its effect (Kiefer, 1988). Table 4 shows that the commuting and senior citizen terms are negatively correlated with the three proxy variables. The benchmark specification which excludes the proxies will therefore impose a negative parameter bias on these terms. Alternatively, the percentage facing a workplace wage tax maintains a significant positive parameter in all specifications because it is only weakly correlated with the proxies.
Finally it is important to check whether the estimates are robust (the results discussed here are omitted in the interest of brevity). First, all of the parameters of interest — those involving the proxies and the various interest groups — have the same sign and significance when probits for 1970, 1980 and 1992 are estimated rather than a hazard model. This shows the results are robust to time-varying parameters and dynamic sample selection. Second, a joint system of real property tax rates and wage tax levying propensity is estimated. This system allows interaction between the two taxes and can be thought of as a reduced form model of the overall tax structure of a community. Again the parameters of interest in the wage tax levying equation maintain their sign and significance. Third, the three proxy variables are combined using the principal components method, and the resulting aggregate variable is used as the proxy in the augmented specification. The aggregate variable has a positive and significant parameter just as did each proxy when included separately. Fourth, a probit specification of wage tax levying which allows for strategic interaction between communities and spatial correlation of omitted variables is estimated (details of this technique are presented in Strumpf and Oberholzer-Gee, 1999). The strategic interaction and spatial correlation parameters are insignificant while the variables of interest maintain their sign and significance. Fifth, for the hazard and the regressions discussed in the unpublished appendix a specification is estimated in which the percentage of Philadelphia
20
162 K.S. Strumpf / Journal of Public Economics 80 (2001) 141 –167
commuters, the percentage of interstate commuters, the percentage who face a workplace wage tax, and the percentage of senior citizen variables are replaced by their sum. The variables of interest maintain their sign and significance.
5. Alternative hypotheses and interpretations
Although the empirical evidence is consistent with the credibility hypothesis, other causal mechanisms could be at work. While it is not possible to consider every possible alternative, the leading contenders are incapable of explaining and often inconsistent with the estimates. The conventional explanation for the pattern of wage taxation in the Philadelphia area is put forth in Luce and Summers (1987). They argue that only communities which anticipate large revenue streams will levy the wage tax, and so communities along the Philadelphia and state border do not levy the tax because of their large exempt population. The Luce and Summers thesis is clearly part of the story, but it cannot explain all of the empirical regularities. First, Table 3 shows that interest groups play an important role in wage tax levying even controlling for the size of the wage tax base. It is difficult to rationalize these results using the Luce and Summers theory which does not consider the redistributive nature of the wage tax. Second, the wage tax bases are not vastly different in taxing and non-taxing communities. The last row in Table 2 indicates that non-levying communities would collect nearly as much revenue from a wage tax as the current leviers due to their higher income level.
There could also be a role for unobserved heterogeneity. For example, it is possible that communities have unobserved, systematic differences which pre-dispose some to prefer wage taxes relative to property taxes (e.g. there are systematic differences in tastes for wage taxes or in the political power of the interest groups discussed in this paper). One way to investigate this possibility is to include an explicit heterogeneity correction in the hazard estimates. While this generalization is intractable in the partial likelihood framework, a feasible
21
estimator is presented in Han and Hausman (1990). The parameters of interest have the same sign and significance in the Han and Hausman estimates as they did in Table 3, and there is little evidence of unobserved heterogeneity (results
22
omitted). The unobserved heterogeneity theory also has difficulty explaining why the credibility proxies are significant in the hazards or in the regressions in the unpublished appendix. For this theory to be appropriate the unobserved differences would have to be correlated with the proxies, but there is little reason to suspect such a relationship.
Another version of the unobserved differences theory is that some communities
21
The Han and Hausman estimator presumes the unobserved heterogeneity follows a gamma distribution while still allowing for a flexible baseline and time-varying covariates.
22
K.S. Strumpf / Journal of Public Economics 80 (2001) 141 –167 163 oppose all taxes for ideological reasons. Presumably these tax-resistant com-munities should have a higher percentage of citizens registered with the Re-publican party. However, Table 2 shows that taxing and non-taxing communities
23
have similar party registrations in 1992. Table 2 also shows that taxing and non-taxing communities have comparable per capita tax burdens. This is evidence against the tax-resistance theory which predicts there will be a lower burden in the non-levying communities.
It is also important to consider the overall fiscal structure of a community. It is possible that communities levy a wage tax only because of some underlying fiscal stress, or that there are important interactions between property and wage taxes. However, the fiscal stress hypothesis is not consistent with the insignificant deficit parameter in all of the estimates. If communities adopt a wage tax because they are in need of new revenues, the deficit variable would be significant. As for the tax interaction theory, the results at the end of Section 4.3 showed that the parameters of interest maintain their sign and significance when a system of property and wage taxes is estimated.
There might also be a reverse causality explanation for the wage tax pattern. Under this theory, the absence of a wage tax drives down the value of the credibility proxies. While this could explain the change in tax burden proxy (over-reliance on property taxes results in poor fiscal health which necessitates a tax hike), it is unclear how the absence of a wage tax could directly influence either unionization rates or overhead spending. As a more formal test I regressed a lagged wage tax dummy on each of the proxies (results omitted). Since the estimated parameters are insignificant, there is little evidence of reverse causality. The banding of non-taxers near Philadelphia could also arise from some spillover from the city. For example, inner-ring suburbs might enjoy a land price premia (because of their close proximity to the amenities of Philadelphia) and so can raise sufficient revenues from property taxes alone. However, distance from the city border is insignificant in the proxy-augmented hazards of Table 3. Moreover, the spillover theory could be invoked to explain the opposite pattern of wage tax levying: inner-ring suburbs have a greater need for wage tax revenues since they must pay higher salaries to their more unionized public employees. Finally, the Philadelphia spillover theory is unable to explain the presence of non-taxing communities which are quite distant from the city (see Map 3).
Wage taxes could be levied with the intention of attracting or appeasing certain firms or citizens. A wage tax would be beneficial to capital-intensive firms if it was used to lower property tax rates. Table 2 shows that taxing and non-taxing communities have roughly the same ratio of jobs to population (or to commercial land), suggesting that the wage tax is not associated with capital-intensive firms. In addition the percentage of commercial land is not significant when included in the
23
164 K.S. Strumpf / Journal of Public Economics 80 (2001) 141 –167
wage tax hazards (results omitted). Therefore, it seems unlikely that levying decisions revolve around the potential implications for firms. Similarly, a wage tax could be beneficial to citizens with low income, high property ownership, or exemption from home wage taxes. However, a wage tax levy does not have a significant effect on a community’s median income, income to property ratio, or the percentage of Philadelphia or interstate commuters (results omitted).
Finally, the proxies might reflect citizen demand for wage taxes due to some mechanism besides government credibility. For example, citizens could use the proxies to infer how efficiently their government transforms tax collections into useful services, for example the Rogoff (1990) model with unobserved politician competence. Just as with the credibility theory, citizens decide whether to allow a wage tax levy based on their beliefs about how the new revenues will be spent. The proxies used here could reasonably influence citizen perceptions of govern-ment efficiency. For example, overhead may measure the degree of governgovern-ment waste while strong public sector unions can preclude cost-cutting strategies. While it is not possible to rule out the efficiency theory with the available data, there is qualitative evidence favoring the credibility theory. Wage tax opponents con-sistently raised the issue of credibility but not efficiency in the public policy-making meetings covered in The Philadelphia Inquirer (1981–1992). In any event, the efficiency and credibility models have an identical policy implication: citizens restrain governments which they believe will act imperfectly in the future.
In conclusion none of the alternative hypotheses considered here are compatible with all of the evidence. The credibility interpretation of the proxies is fully consistent with the hazard estimates and the regressions in the unpublished appendix. It seems reasonable to conclude that government credibility has been at least a contributing factor in wage tax levying decisions.
6. Conclusion
The pattern of wage tax levies in the Philadelphia suburbs seems to violate self-interested behavior. While exempt citizens should support a wage tax, communities with the highest proportion of exempt citizens do not have the tax. One explanation involves concerns about government credibility. Citizens may block a new wage tax when they doubt their government’s promise to use the collections to decrease property taxes. This framework can be used to explain the pattern of wage taxation. The non-taxing governments with a large exempt population empirically have a lower credibility ranking and also must exceed a higher credibility threshold since their wage tax will raise less revenue.
K.S. Strumpf / Journal of Public Economics 80 (2001) 141 –167 165 number of exempt citizens. This means two governments with identical credibility, one in the Philadelphia area and the other located elsewhere in the state, will be treated quite differently because they face different credibility thresholds. Second, one could argue that the citizens in these communities are less skeptical of government than Philadelphia suburbanites. For example, a 1989 measure which sought to raise the wage tax cap lost by a 3-to-1 margin statewide but by a 7-to-1 margin in the Philadelphia suburbs. The leading argument raised against the measure was that politicians could not be entrusted with any new taxing privileges (The Philadelphia Inquirer, 11 March 1990).
While this paper has focused on the behavior of local governments, credibility concerns are also likely to restrict the federal government. A recent Harris poll documents the extent of public skepticism: while 70% of voters feel federal taxes are too high, ‘‘64% said they would be willing to pay more if they were sure the money would be spent ‘effectively’ on public needs’’ (Wall Street Journal, 8 January 1997). In other words, voters are willing to support new policy initiatives if the government can commit to an efficient course of action. The creation of constraining institutions, such as tying spending to a particular tax or trust fund, is one way of gaining the public’s trust. This line of reasoning suggests that counter to conventional wisdom, Medicare and Social Security reform is politically feasible. Both programs link a specific tax to a trust fund, so it would be difficult for future governments to deviate from promises made today (and such changes are very transparent). At the same time, the prospects for a new health care initiative are less promising unless policy-makers create a similar set of binding institutions. The absence of such a commitment mechanism seemed to contribute to the defeat of President Clinton’s 1994 health care proposal (Wall Street Journal, 28 September 1994) and helps explain the limited scope of his more recent proposals (New York Times, 8 December 1997). In short, government credibility may restrain the range of feasible policies. Credible governments may enjoy more policy instruments than do non-credible governments.
Because applied researchers have generally ignored government credibility, there is little evidence regarding its importance in practice. The three proxies employed in this paper could be used to test for credibility in other settings, since they are available for virtually any sample of local, state or federal governments. Investigating the extent to which government credibility influences policy out-comes should be a fruitful topic for future research.
Acknowledgements
166 K.S. Strumpf / Journal of Public Economics 80 (2001) 141 –167
earlier version of this paper circulated under the title ‘Credibility and the Structure of Taxes: The Local Earned Income Tax in Pennsylvania.’
References
Besley, T., Case, A., 1995. Does electoral accountability affect economic policy choices? Evidence from gubernatorial term limits. Quarterly Journal of Economics 110, 769–798.
Brennan, G., Buchanan, J., 1980. The power to tax: Analytical foundations of a fiscal constitution. Cambridge University Press, Cambridge.
Bureau of the Census (1972–1987). Census of Governments: Employment Summary Statistics; http: / / www.icpsr.umich.edu /
Bureau of the Census (1960–1990a). Census of Population and Housing: Summary Characteristics for Pennsylvania (Census Tracts); http: / / www.icpsr.umich.edu /
Bureau of the Census (1960–1990b). Census of Population: Characteristics of the Population for Pennsylvania; http: / / www.icpsr.umich.edu /
Bureau of the Census (various years a). Government Finances: Finances of Municipal and Township Governments, Washington, DC.
Bureau of the Census (various years b). State Government Finances, Washington, DC.
Bureau of Transportation Statistics, Department of Transportation (1980, 1990). Census Transportation Planning Package, Washington, DC.
County Board of Elections (1992). Voter Registration Figures. Unpubl. records from Bucks, Chester, Delaware and Montgomery counties.
Courant, P., Gramlich, E., Rubinfeld, D., 1980. Why voters support tax limitation amendments: The Michigan case. National Tax Journal 33, 1–20.
Delaware Valley Regional Planning Commission (1979, 1984, 1993). Employment Data, Philadelphia. Delaware Valley Regional Planning Commission (1984, 1994). Land Use in the Delaware Valley,
Philadelphia.
Department of General Services (1978–1993). The Pennsylvania Manual, Harrisburg.
Diamond, P., Hausman, J., 1984. The retirement and unemployment behavior of older men. In: Aaron, H.J., Burtless, G. (Eds.). Retirement and Economic Behavior. The Brookings Institution, Washing-ton, DC, pp. 97–134.
Gyourko, J., Tracy, J., 1989. Local public sector rent-seeking and its impact on local land values. Regional Science and Urban Economics 19, 493–516.
Han, A., Hausman, J., 1990. Flexible parametric estimation of duration and competing risk models. Journal of Applied Econometrics 5, 1–28.
Kalbfleisch, J., Prentice, R., 1980. The Statistical Analysis of Failure Time Data. John Wiley, New York.
Kiefer, N., 1988. Econometric duration data and hazard functions. Journal of Economic Literature 26, 646–679.
Ladd, H., Wilson, J., 1982. Why voters support tax limitations: Evidence from Massachusetts’
1
]
Proposition 2 . National Tax Journal 35, 121–148.2
Luce, T., Summers, A., 1987. Local Fiscal Issues in the Philadelphia Metropolitan Area. University of Pennsylvania Press, Philadelphia.
Martinez-Vazquez, J., Sjoquist, D., 1988. Property tax financing, renting, and the level of local expenditures. Southern Economic Journal 55, 424–431.
Mueller, D., 1989. Public Choice, Vol. II. Cambridge University Press, Cambridge.
Peltzman, S., 1992. Voters as fiscal conservatives. Quarterly Journal of Economics 107, 327–361. Pennsylvania Department of Community Affairs (various years a). Local Government Financial
K.S. Strumpf / Journal of Public Economics 80 (2001) 141 –167 167 Pennsylvania Department of Community Affairs (various years b). Register for Earned Income Taxes,
Harrisburg.
Pennsylvania Department of Community and Economic Development (1997). Open Meetings / Open Records: The Sunshine Act and the Right to Know Law; http: / / www.dced.state.pa.us / PA Exec /] DCED/ government / pdf / sunshine.pdf
Pennsylvania Department of Internal Affairs (1961). County Industry Report, Census of Manufacturing Industries, Harrisburg.
Persson, T., Tabellini, G. (Eds.), 1994. Credibility. Monetary and Fiscal Policy, Vol. 1. MIT Press, Cambridge, MA.
The Pew Research Center (1997). Trust and Citizen Engagement in Metropolitan Philadelphia: A Case Study; http: / / www.people-press.org / socrpt.htm
The Philadelphia Inquirer (1981–1992). News Vault; http: / / www.phillynews.com / search / archives-are-here.shtml
Rogoff, K., 1990. Equilibrium political business cycles. American Economic Review 80, 21–36. Stein, R., Hamm, K., Freeman, P., 1983. An analysis of support for tax limitation referenda. Public
Choice 40, 187–194.
Strumpf, K., 1998. A predictive index for the Flypaper Effect. Journal of Public Economics 69, 389–412.
Strumpf, K., 1999. Infrequent assessments distort property taxes: Theory and evidence. Journal of Urban Economics 46, 169–199.