Identification of Potential Student Academic Ability
Using Comparison Algorithm K-Means and Farthest First
Athanasia O. P. Dewi
Master of Information Systems,
Faculty of Information
Technology, Satya Wacana
Christian University, Indonesia
aopd_9@yahoo.co.id
Wiranto H. Utomo
Faculty of Information
Technology, Satya Wacana
Christian University, Indonesia
wiranto.utomo@staff.uksw.edu
Sri Yulianto J. P.
Faculty of Information
Technology, Satya Wacana
Christian University, Indonesia
sriyulianto@gmail.com
ABSTRACT
The paper is tell about how to measure the potential of students' academic skills by using the parameter values and the area by using clustering analysis comparing two algorithms, algorithm K-Means and Farthest First algorithm. The data used in this paper is the student data of private universities in Indonesia. Tools that used in this study is Weka data mining application. From the results observed, found that the origin of high school affect the values obtained during the lectures and the more the number of clusters desired, the more also the time required to perform the data clustering.
Keywords
Clustering algorithms, K-Means, Farthest First
1.
INTRODUCTION
Quality of students is an important component of the establishment of a college even though it is undeniable that the quality of the students themselves certainly did not escape the role of the lecturer. To be able to measure the academic potential of a student, are commonly used parameter grade point average (GPA), but the GPA is a collection of some value. The value of a variable in more detail than the GPA, therefore this study uses the variable value as the benchmark students' academic potential. Some aspects that may affect the value of the student is the origin of high school and the area, in addition to using the variable values, along with local high school of origin will be the variable in this study.
In some journals, K-Means method is used to perform the data clustering. In this study used comparison method, the K-Means algorithm and Farthest First algorithms to measure the performance of both algorithms. How long does it take to classify the same data and how the results obtained, whether producing members of the same or different clusters will be examined in this study.
2.
LITERATURE REVIEW
Research carried out based on several previous studies. The first study, entitled Application of k-Means Clustering algorithm for prediction of Students' Academic Performance [3] explained that the grade point average (GPA) is essential to measure the ability of students and evaluate progress in the academic environment. With the help of data mining methods such as clustering algorithms, makes it possible to find the core of student characteristics to predict student performance in the future. K-Means is used to classify the student with a
Observations are conducted three times with 3 clusters, 4 clusters, and 5 clusters.
In another study entitled Performance Evaluation of K-Means and Fuzzy C-Means Clustering Algorithms for Statistical Distributions of Input Data Points [12] explained that the two algorithms are implemented and its performance was analyzed based on the quality of the clustering. Behavior of both algorithms depends on the number of data points and the number of clusters. Testing is done by conducting two trials of each algorithm and each performed well testing uniform distribution and normal distribution. The first test using a 500 point clusters using K-Means algorithm, and is divided into 10 clusters by using a uniform distribution and normal distribution, as well as for Fuzzy C-Means algorithm. The second test uses 1,000 points tested cluster with K-Means algorithm, and is divided into 10 clusters by using a uniform distribution and normal distribution, do the same thing for Fuzzy C-Means algorithm. The results of this study are K-Means algorithm is better than the Fuzzy C-K-Means for the uniform distribution and normal distribution. And also in the calculation using Fuzzy C-Means algorithm takes much because there are calculations in the fuzzy algorithm.
The third research, entitled Prediction of Student Academic Performance by an Application of Data Mining Techniques [8] apply the kernel method as a data mining technique to analyze the relationship between behavior and achievement of their students and to develop predictive models of student performance. This is done by using the Smooth Support Vector Machine (SSVM) classification and clustering techniques kernel k-means. The results of this research is the prediction of academic performance models using psychometric factors as predictor variables.
In this research, the identification of students' academic abilities used two comparison data mining algorithms, namely K-Means and Farthest First.
3.
CLUSTERING ANALYSIS
Clustering in small groups that have the same nature carried out in two ways, namely by hierarchical and non-hierarchical clustering. Grouping hierarchy is a grouping that users can not determine how many clusters to be formed. While the non-hierarchical clustering is the grouping that can decide how many clusters will result from the data that is used, with the condition k <n.
3.1
K-Means
K-Means is a non-hierarchical clustering method that seeks to partition the data into the form of one or more clusters. This method partition the data into clusters so that the data have the same characteristics are grouped into one cluster are the same and the data that have different characteristics grouped into another cluster. In general, K-Means algorithm is as follows:
1. Determine the number of clusters
2. Determine the cluster center (centroid) randomly
3. Calculate the distance of each data to each cluster center. Distance space is used to calculate the distance between the data and the centroid. The equation that can be used one of them is the Euclidean Distance Space [1]:
2 2 2 2 2 1
1
)
(
)
...
(
)
(
)
,
(
XY X Y X Y Xm Ymd
m : dimensional data
4. Determine the distance to the nearest cluster to each data
5. Calculate new cluster centers (centroid)
6. Repeat steps 3 through 5 until the position data to the cluster has not changed.
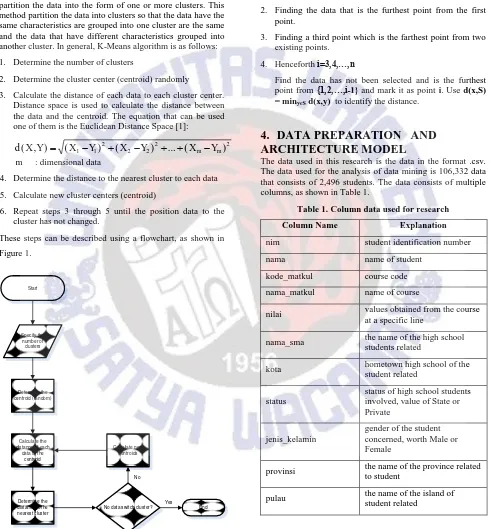
These steps can be described using a flowchart, as shown in
Figure 1. Start Specify the number of clusters Determine the centroid (random) Calculate the distance of each
data to the centroid
Determine the distance to the nearest cluster
No data switch cluster? Calculate new
centroids
End No
Yes
Figure 1: K-Means Algorithm Flowchart
3.2
Farthest First
Farthest first is a variant of K Means that places each cluster centre in turn at the point furthermost from the existing cluster centre. This point must lie within the data area. This greatly speeds up the clustering in most of the cases since less reassignment [11].
The steps of the algorithm are as follows:
1. Choose a random data as the center point first.
2. Finding the data that is the furthest point from the first point.
3. Finding a third point which is the farthest point from two existing points.
4. Henceforth i=3,4,…,n
Find the data has not been selected and is the furthest point from {1,2,…,i-1} and mark it as point i. Use d(x,S) = minyєS d(x,y) to identify the distance.
4.
DATA PREPARATION AND
ARCHITECTURE MODEL
The data used in this research is the data in the format .csv. The data used for the analysis of data mining is 106,332 data that consists of 2,496 students. The data consists of multiple columns, as shown in Table 1.
Table 1. Column data used for research
Column Name Explanation
nim student identification number
nama name of student
kode_matkul course code
nama_matkul name of course
nilai values obtained from the course at a specific line
nama_sma the name of the high school students related
kota hometown high school of the
student related
status
status of high school students involved, value of State or Private
jenis_kelamin
gender of the student concerned, worth Male or Female
provinsi the name of the province related to student
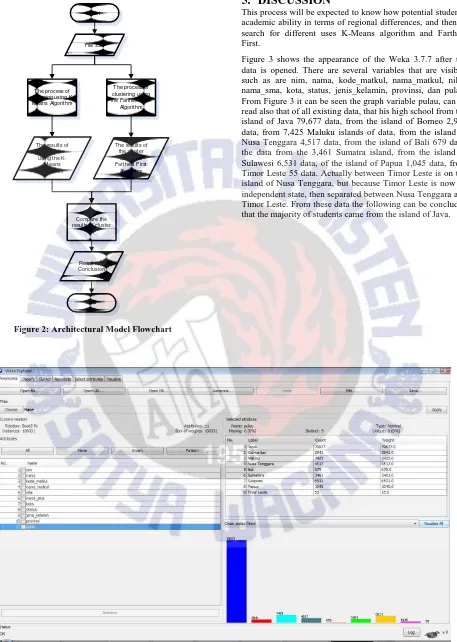
Start
File .csv
The process of clustering using
K-Means Algorithm
The process of clustering using the Farthest First
Algorithm
The results of the cluster
using the Farthest First
Algorithm The results of
the cluster using the K-Means Algorithm
Compare the results of cluster
Result and Conclusion
End
Figure 2: Architectural Model Flowchart
5.
DISCUSSION
This process will be expected to know how potential students' academic ability in terms of regional differences, and then to search for different uses K-Means algorithm and Farthest First.
5.1
Using K-Means Algorithm
In the implementation of K-Means algorithm, will be divided into 5 clusters and the distance between the centroid and data points will be calculated by the calculation of Euclidean Distance as can be seen in Figure 4.
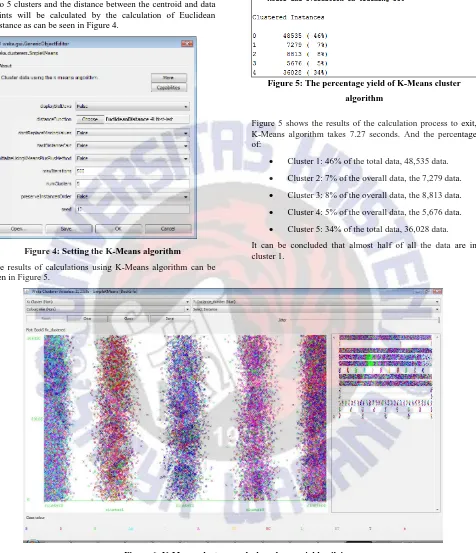
Figure 4: Setting the K-Means algorithm
The results of calculations using K-Means algorithm can be seen in Figure 5.
Figure 5: The percentage yield of K-Means cluster
algorithm
Figure 5 shows the results of the calculation process to exit, K-Means algorithm takes 7.27 seconds. And the percentage of:
Cluster 1: 46% of the total data, 48,535 data.
Cluster 2: 7% of the overall data, the 7,279 data.
Cluster 3: 8% of the overall data, the 8,813 data.
Cluster 4: 5% of the overall data, the 5,676 data.
Cluster 5: 34% of the total data, 36,028 data. It can be concluded that almost half of all the data are in cluster 1.
Figure 6: K-Means cluster graphs based on variable nilai
From Figure 6, it can be read that cluster 1 is dominated by students with grade AB, cluster 2 is dominated by students with the BC and CD, cluster 3 is dominated by students with a
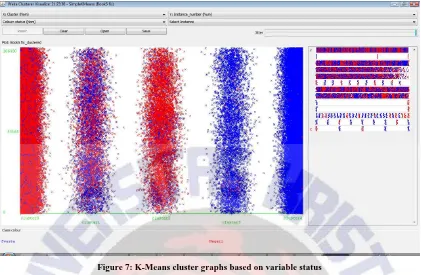
Figure 7: K-Means cluster graphs based on variable status
From Figure 7 it can be concluded, that in cluster 1 are dominated by students from public high schools. Cluster 2 is dominated between two status public and private high schools. Cluster 3 lots of high school students from the public
high schools. Cluster 4 majority coming from private high school. As for the cluster is dominated by five students from a private high school.
Figure 8: K-Means cluster graphs based on variable pulau
5.2
Using Farthest First Algortihm
After making implementation using K-Means algorithm, the next step is to conduct research using algorithms Farthest First.
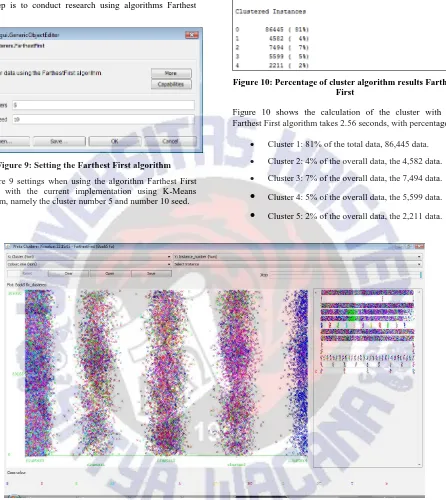
Figure 9: Setting the Farthest First algorithm
In Figure 9 settings when using the algorithm Farthest First equated with the current implementation using K-Means algorithm, namely the cluster number 5 and number 10 seed.
Figure 10: Percentage of cluster algorithm results Farthest First
Figure 10 shows the calculation of the cluster with the Farthest First algorithm takes 2.56 seconds, with percentages:
Cluster 1: 81% of the total data, 86,445 data.
Cluster 2: 4% of the overall data, the 4,582 data.
Cluster 3: 7% of the overall data, the 7,494 data.
Cluster 4: 5% of the overall data, the 5,599 data.
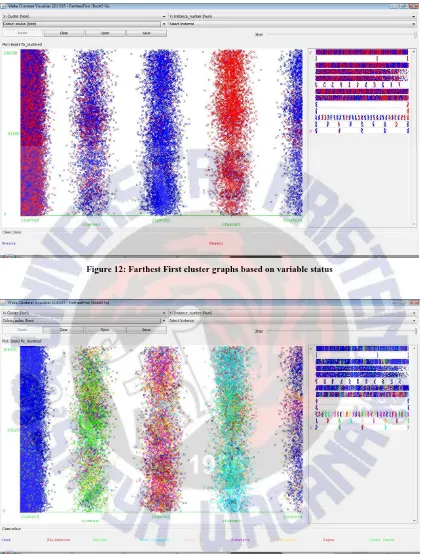
Cluster 5: 2% of the overall data, the 2,211 data.Figure 12: Farthest First cluster graphs based on variable status
Figure 13: Farthest First cluster graphs based on variable pulau
According to Figure 11, Figure 12, and Figure 13 it can be concluded that in cluster 1, the value of which dominate the A and AB, which dominated from public high school, and comes from the island of Java. Cluster 2 looks worth evenly, school status is dominated by private high school, the majority are students of the Maluku islands. Cluster 3 value looks uneven, dominated by students from the private high school, and the majority are students from Sulawesi island. Cluster 4
6.
ANALYSIS
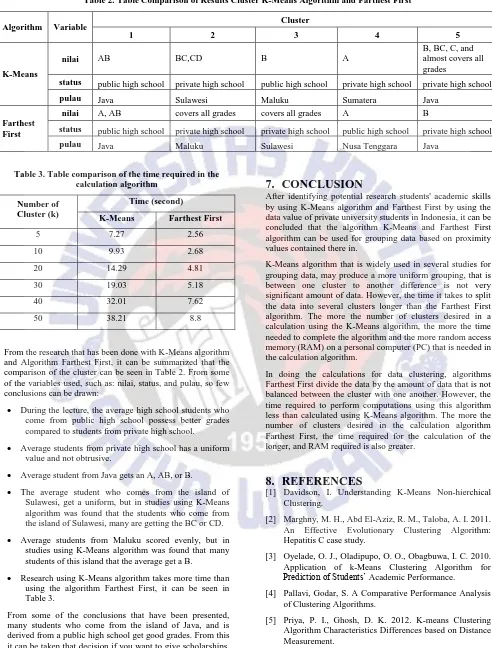
Table 2. Table Comparison of Results Cluster K-Means Algorithm and Farthest First
Algorithm Variable Cluster
1 2 3 4 5
K-Means
nilai AB BC,CD B A
B, BC, C, and almost covers all grades
status public high school private high school public high school private high school private high school
pulau Java Sulawesi Maluku Sumatera Java
Farthest First
nilai A, AB covers all grades covers all grades A B
status public high school private high school private high school public high school private high school
pulau Java Maluku Sulawesi Nusa Tenggara Java
Table 3. Table comparison of the time required in the calculation algorithm
Number of Cluster (k)
Time (second)
K-Means Farthest First
5 7.27 2.56
10 9.93 2.68
20 14.29 4.81
30 19.03 5.18
40 32.01 7.62
50 38.21 8.8
From the research that has been done with K-Means algorithm and Algorithm Farthest First, it can be summarized that the comparison of the cluster can be seen in Table 2. From some of the variables used, such as: nilai, status, and pulau, so few conclusions can be drawn:
During the lecture, the average high school students who come from public high school possess better grades compared to students from private high school.
Average students from private high school has a uniform value and not obtrusive.
Average student from Java gets an A, AB, or B.
The average student who comes from the island of Sulawesi, get a uniform, but in studies using K-Means algorithm was found that the students who come from the island of Sulawesi, many are getting the BC or CD.
Average students from Maluku scored evenly, but in studies using K-Means algorithm was found that many students of this island that the average get a B.
Research using K-Means algorithm takes more time than using the algorithm Farthest First, it can be seen in Table 3.
From some of the conclusions that have been presented, many students who come from the island of Java, and is derived from a public high school get good grades. From this it can be taken that decision if you want to give scholarships, this group is preferred.
7.
CONCLUSION
After identifying potential research students' academic skills by using K-Means algorithm and Farthest First by using the data value of private university students in Indonesia, it can be concluded that the algorithm K-Means and Farthest First algorithm can be used for grouping data based on proximity values contained there in.
K-Means algorithm that is widely used in several studies for grouping data, may produce a more uniform grouping, that is between one cluster to another difference is not very significant amount of data. However, the time it takes to split the data into several clusters longer than the Farthest First algorithm. The more the number of clusters desired in a calculation using the K-Means algorithm, the more the time needed to complete the algorithm and the more random access memory (RAM) on a personal computer (PC) that is needed in the calculation algorithm.
In doing the calculations for data clustering, algorithms Farthest First divide the data by the amount of data that is not balanced between the cluster with one another. However, the time required to perform computations using this algorithm less than calculated using K-Means algorithm. The more the number of clusters desired in the calculation algorithm Farthest First, the time required for the calculation of the longer, and RAM required is also greater.
8.
REFERENCES
[1] Davidson, I. Understanding K-Means Non-hierchical Clustering.
[2] Marghny, M. H., Abd El-Aziz, R. M., Taloba, A. I. 2011. An Effective Evolutionary Clustering Algorithm: Hepatitis C case study.
[3] Oyelade, O. J., Oladipupo, O. O., Obagbuwa, I. C. 2010. Application of k-Means Clustering Algorithm for
Prediction of Students’ Academic Performance. [4] Pallavi, Godar, S. A Comparative Performance Analysis
of Clustering Algorithms.
[6] Raghuwanshi, S. S., Arya, P. 2012. Comparison of K-means and Modified K-mean algorithms for Large Data-set.
[7] Sanjay Chakraborty, Nagwani, N. K., Dey, Lopamudra Dey. 2011. Performance Comparison of Incremental K-Means and Incremental DBSCAN Algorithm.
[8] Sembiring, S., Zarlis, M., Dedy Hartama, Ramliana S., Elvi Wani. 2011. Prediction of Student Academic Performance by an Application of Data Mining Techniques.
[9] Shanmugapriya, B., Punithavalli, M. 2012. A Modified Projected K-Means Clustering Algorithm with Effective Distance Measure.
[10]Sharma, N., Bajpai, A., Litoriya, R. 2012. Comparison the Various Clustering Algorithm of Weka Tools.
[11]Sunita, B. A., Lobo, L. M. R. J. 2012. A comparative Study for Selecting the Best Unsupervised Learning Algorithm in E-Learning System.
[12]Velmurugan, T., Santhanam, T. 2010. Performance Evaluation of K-Means and Fuzzy C-Means Clustering Algorithms for Statistical Distributions of Input Data Points.