UNOFFICIAL TRANSLATION
No. 10/ 02/ Yr.X 16 February 2007
ECONOMIC GROWTH IN INDONESIA, 2006
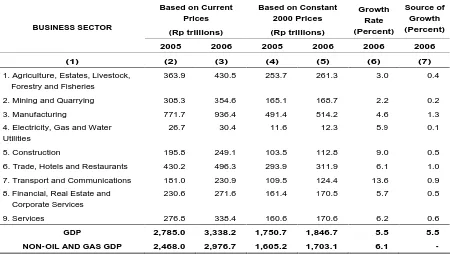
Indonesia s econom ic gr ow t h in 2006 m easur ed by t he rise in t he Gr oss Dom est ic Product (GDP) over 2005 reached 5.5 percent. Positive growth was recorded acr oss all sect or s, w it h t he t r anspor t and com m unicat ions sect or in t he lead at 13.6 percent and mining & quarrying behind all other sectors at 2.2 percent.
I ndonesia's GDP based on cur r ent pr ices r eached Rp 3,338.2 t r illion. I n const ant 2000 prices, GDP came to Rp 1,846.7 trillion.
I ndonesia s quar t er ly GDP in Q4/ 2006 w as dow n 1.9 per cent com par ed t o Q3/2006 (q- t - q), despite recording 6.1 percent growth over Q4/2005.
GDP gr ow t h in 2006 excluding oil and nat ur al gas reached 6.1 percent , ahead of the overall GDP growth rate of 5.5 percent.
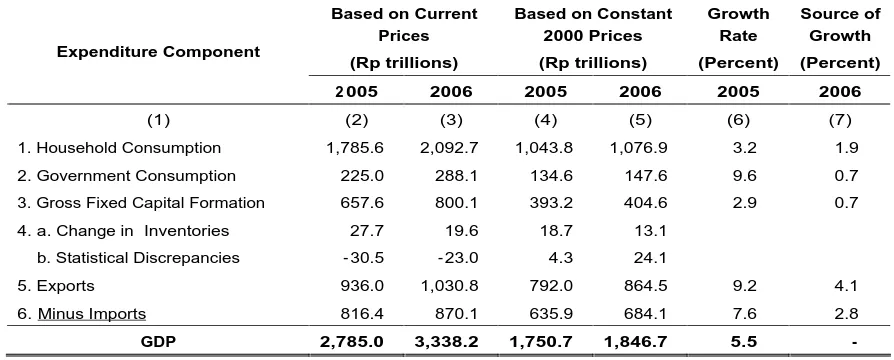
On t he expendit ur es side, t he lar gest share of GDP at 62.7 per cent w as used for household consum pt ion. Gover nm ent consum pt ion account ed for 8.6 per cent , gr oss fixed capit al for m at ion 24.0 per cent and net expor t s 4.8 per cent ( expor t s 30.9 percent and imports 26.1 percent).
Gr ow t h t ook place in all GDP expendit ur e com ponent s dur ing 2006. Leading in gr ow t h w as gover nm ent consum pt ion at 9.6 per cent , follow ed by expor t s at 9.2 per cent , household consum pt ion at 3.2 percent and gr oss fixed capit al for m at ion at 2.9 percent, with the effect of import growth recorded at 7.6 percent.
The m ost im por t ant sour ces cont ribut ing t o t he 5.5 per cent GDP gr ow t h w er e export s at 4.1 per cent , follow ed by household consum pt ion at 1.9 percent , governm ent consum pt ion at 0.7 per cent and gr oss fix ed capit al for m at ion at 0.7 percent before allowance for the 2.8 percent effect of imports.
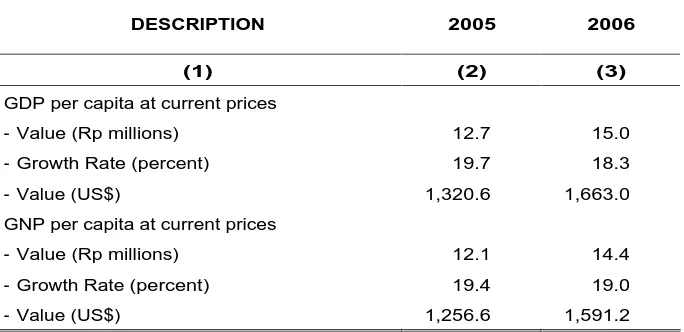
Per capit a GDP based on cur r ent pr ices in 2006 cam e t o Rp 15.0 m illion ( US$1,663.0) , up fr om Rp 12.7 m illion ( US$1,320.6) in 2005. Per capit a GNP in 2006 sim ilar ly r eached Rp 14.4 m illion, also up fr om t he pr evious year s level of Rp 12.1 million.
OFFICIAL BULLETIN OF STATISTICS
I. Economic Growth in 2006
Com par ed t o 2005, t he I ndonesian econom y in 2006 r ecor ded 5.5 per cent gr ow t h. GDP based on const ant pr ices r eached Rp 1,846.7 t rillion, up fr om Rp 1,750.7 t r illion in 2005. Measur ed in cur rent pr ices, t he 2006 GDP ex panded by Rp 553.2 t r illion fr om Rp 2,785.0 trillion in 2005 to Rp 3,338.2 trillion in 2006.
Table 1
GDP in 2005 and 2006
and 2006 Growth Rates by Business Sector
Based on Current gas and water utilities at 5.9 percent, financial services, real estate and corporate services at 5.7 percent , m anufact uring at 4.6 per cent , agr icult ur e at 3.0 per cent and m ining and quarr ying at 2.2 percent . Non- oil and gas GDP gr ow t h reached 6.1 per cent , ahead of t he overall GDP growth rate for 2006 recorded at 5.5 percent.
UNOFFICIAL TRANSLATION
m anufact ur ing, despit e chart ing only 4.6 percent gr ow t h, r em ained t he leading sour ces of growth w it h a 1.3 per cent cont r ibut ion t o t he gr ow t h rat e. Com plet e dat a on sources of growth is presented in Table 1.
Graph 1
Table 2
Quarterly GDP Growth Rates by Business Sector (Percent)
BUSINESS SECTOR Q3/2006 to
Q2/2006
Q4/2006 to Q3/2006
Q4/2006 to Q4/2005
(1) (2) (3) (4)
1. Agriculture, Estates, Livestock, Forestry and Fisheries
6.1 - 19.8 1.8
2. Mining and Quarrying 1.6 3.2 0.7
3. Manufacturing 3.6 0.6 5.9
4. Electricity, Gas and Water Utilities 2.5 1.9 8.1
5. Construction 3.6 3.0 10.4
6. Trade, Hotels and Restaurants 4.5 - 0.6 7.0
7. Transport and Communications 4.5 3.9 15.9
8. Financial, Real Estate and Corporate
Services
2.0 2.2 6.8
9. Services 2.4 0.8 6.0
GDP 3.7 - 1.9 6.1
NON- OIL AND GAS GDP 4.1 - 2.2 6.6
Measur ed year - on- year against Q4/ 2005, t he I ndonesian econom y r ecor ded 6.1 per cent grow t h in Q4/ 2006. Grow t h w as r ecor ded across all sect or s, led by t r anspor t at ion at 15.9 percent . Next w as const r uct ion w it h 10.4 percent gr ow t h, follow ed by elect r icit y, gas and w at er ut ilit ies at 8.1 per cent , t r ade, hot els and rest aur ant s at 7.0 per cent , financial ser vices, real est at e and cor por at e ser vices at 6.8 per cent , t he ser vices sect or at 6.0 percent , m anufact ur ing at 5.9 per cent , agr icult ur e at 1.8 percent and the m ining and quarrying sector at 0.7 percent.
III. GDP Structure by Business Sector, 2005 and 2006
UNOFFICIAL TRANSLATION
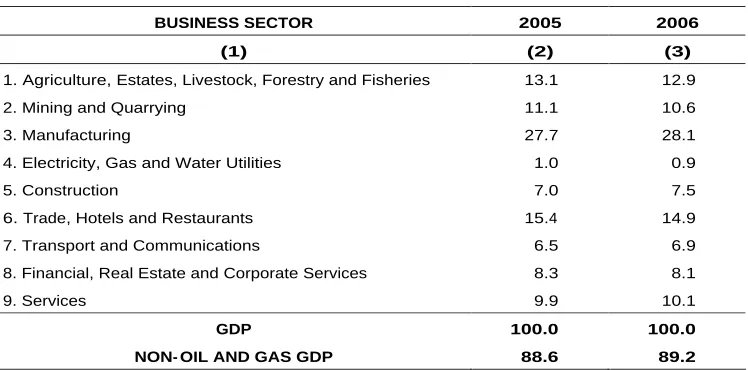
t o t ot al GDP. A significant drop t ook place in t he t r ade, hot els and r est aurant s sect or , w hich dim inished fr om 15.4 per cent of GDP in 2005 t o 14.9 per cent in 2006. I n a sim ilar vein, m ining and quar r ying narr ow ed fr om 11.1 per cent t o 10.6 per cent , agr icult ur e fr om 13.1 per cent t o 12.9 per cent , t he financial ser vices, real est at e and cor porat e ser vices sect or fr om 8.3 percent t o 8.1 per cent and elect r icit y, gas and w at er ut ilit ies from 1.0 per cent t o 0.9 percent . On t he ot her hand, const ruct ion widened fr om 7.0 per cent in 2005 t o 7.5 percent in 2006, t r anspor t at ion and com m unicat ions fr om 6.5 per cent t o 6.9 per cent , m anufact ur ing fr om 27. 7 percent t o 28.1 per cent and t he serv ices sect or fr om 9.9 percent to 10.1 percent. Analysed in aggregate form, the proportion of non- oil and gas GDP increased from 88.6 percent in 2005 to 89.2 percent in 2006.
Table 3
GDP Structure by Business Sector, 2005 - 2006 (Percent)
BUSINESS SECTOR 2005 2006
(1) (2) (3)
1. Agriculture, Estates, Livestock, Forestry and Fisheries 13.1 12.9
2. Mining and Quarrying 11.1 10.6
3. Manufacturing 27.7 28.1
4. Electricity, Gas and Water Utilities 1.0 0.9
5. Construction 7.0 7.5
6. Trade, Hotels and Restaurants 15.4 14.9
7. Transport and Communications 6.5 6.9
8. Financial, Real Estate and Corporate Services 8.3 8.1
9. Services 9.9 10.1
GDP 100.0 100.0
NON- OIL AND GAS GDP 88.6 89.2
IV. Expenditure- Based GDP
Table 4
Value and Growth Rates for Expenditure- Based GDP 2005 and 2006 review, as reported in detail in Table 4.
Gr ow t h in 2006 w as dr iven m ainly by expor t s of goods and ser vices. Of t he 5.5
UNOFFICIAL TRANSLATION
Thir d quart er gr ow t h in each expenditure com ponent w as up in com par ison t o t he second quar t er w it h t he except ion of governm ent expendit ur es, w hich under went cont r act ion. The highest gr ow t h r at es were recor ded in im por t s and expor t s, w hich clim bed 5.5 percent and 4.1 per cent . How ever , no significant change t ook place in household consum pt ion. Follow ing fr om t his, in Q4/ 2006 alm ost all GDP com ponent s r ecor ded expansion in r elat ion t o Q3/ 2006. The ex cept ion t o t his w as im por t s, w hich fell by minus4.3 per cent . On t he ot her hand, t he highest gr ow t h w as r ecor ded in gover nm ent consumption at 28.6 percent.
Measur ed against t he sam e quar t er in 2005, m ost ex pendit ure com ponent s w er e up in Q4/ 2006. Leading in gr ow t h w as im port s at 9.7 per cent , followed by gr oss fixed capit al form at ion at 8.2 per cent . Gr ow t h in expor t s and household consum pt ion cam e t o 6.1 percent and 3.8 percent.
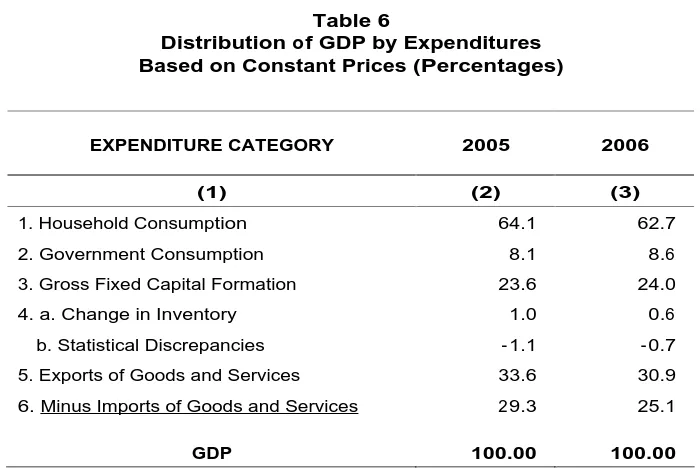
Analysis of the distribution of GDP expenditures shows that household expenditures are still the largest contributor to GDP expenditures in Indonesia despite a narrowing in its pr oport ion t o t ot al expendit ur es fr om 64.1 per cent in 2005 t o 62.7 per cent in 2006. Ot her com ponent s t hat r ecor ded decline w er e expor t s, dow n from 33.6 percent t o 30.9 per cent , and im port s, sim ilar ly dow n fr om 29.3 per cent t o 26.1 per cent in 2006. I n cont r ast , t he ot her expendit ur e com ponent w idened w it h gov er nm ent consum pt ion up fr om 8.1 percent t o 8.6 percent and gr oss fixed capit al for m at ion incr easing fr om 23.6 per cent t o 24.0 percent.
Table 6
Distribution of GDP by Expenditures Based on Constant Prices (Percentages)
EXPENDITURE CATEGORY 2005 2006
(1) (2) (3)
1. Household Consumption 64.1 62.7
2. Government Consumption 8.1 8.6
3. Gross Fixed Capital Formation 23.6 24.0
4. a. Change in Inventory 1.0 0.6
b. Statistical Discrepancies - 1.1 - 0.7
5. Exports of Goods and Services 33.6 30.9
6. Minus Imports of Goods and Services 29.3 25.1
GDP 100.00 100.00
V. GDP AND GNP PER CAPITA
GDP/GNP per capital is calculated as GDP/GNP (based on current prices) divided by t he t ot al populat ion at m id- year . I n 2006, t he GDP per capit a figur e is est im at ed at Rp 15.0 m illion ( US$1,663.0) , up 18.3 per cent fr om t he 2005 GDP per capit a of Rp 12. 7 m illion ( US$1,320.6) . Sim ilar ly, GNP per capit a clim bed fr om Rp 12.1 m illion in 2005 t o Rp 14.4 million in 2006, a rise of 19.0 percent.
Table 7
I n don e sia s GN P a n d GD P pe r ca pit a , 2 0 0 5 a n d 2 0 0 6
DESCRIPTION 2005 2006
(1) (2) (3)
GDP per capita at current prices
- Value (Rp millions) 12.7 15.0
- Growth Rate (percent) 19.7 18.3
- Value (US$) 1,320.6 1,663.0
GNP per capita at current prices
- Value (Rp millions) 12.1 14.4
- Growth Rate (percent) 19.4 19.0
- Value (US$) 1,256.6 1,591.2