Full Terms & Conditions of access and use can be found at
http://www.tandfonline.com/action/journalInformation?journalCode=cbie20
Download by: [Universitas Maritim Raja Ali Haji] Date: 18 January 2016, At: 00:25
Bulletin of Indonesian Economic Studies
ISSN: 0007-4918 (Print) 1472-7234 (Online) Journal homepage: http://www.tandfonline.com/loi/cbie20
How to keep trade policy open: the case of
Indonesia
M. Chatib Basri & Arianto A. Patunru
To cite this article: M. Chatib Basri & Arianto A. Patunru (2012) How to keep trade policy open: the case of Indonesia, Bulletin of Indonesian Economic Studies, 48:2, 191-208, DOI: 10.1080/00074918.2012.694154
To link to this article: http://dx.doi.org/10.1080/00074918.2012.694154
Published online: 27 Jul 2012.
Submit your article to this journal
Article views: 960
ISSN 0007-4918 print/ISSN 1472-7234 online/12/020191-18 © 2012 Indonesia Project ANU http://dx.doi.org/10.1080/00074918.2012.694154
HOW TO KEEP TRADE POLICY OPEN:
THE CASE OF INDONESIA
M. Chatib Basri* Arianto A. Patunru*
University of Indonesia, Jakarta Australian National University
We explore the ups and downs of trade protectionism in Indonesia since the Asian inancial crisis of 1997–98. The key constraints to unilateral trade reform include exchange rate factors, the political economy of consumer–producer behaviour, in-stitutional complexity and global pressures. We conclude that trade reform is likely to face dificulties, with protectionism on the rise again, but that, during the tem-porary halt in the World Trade Organization’s Doha Round of trade negotiations, Indonesia may be able to use regional and international engagement to counter-balance rising protectionism.
Keywords: trade liberalisation, political economy, international economic relations, ASEAN Free Trade Area
INTRODUCTION
The global inancial crisis (GFC) of 2008 was associated with a collapse in inter -national trade that affected many countries, including Indonesia. It is widely believed that one of the reasons Indonesia survived the GFC was its huge domes -tic market. This was true not only of Indonesia: data show that many countries that are well supported by their domestic economy performed better during the GFC than countries that are extremely dependent on exports. This raises the ques -tion of whether an export-led growth strategy is still appropriate. In the context of Indonesia, even Vice President Boediono, a brilliant technocrat and supporter of the market economy, has stated that
[t]he crisis underscores the importance of securing some ‘structure’ for the economy in the mid[st] of globalisation. The concept of a national economy remains relevant (Boediono 2009).
This statement does not imply that Boediono has changed his approach and become protectionist or inward looking. Rather, in our view, it relects support for a balance between export-oriented and inward-looking strategies.
* [email protected]; [email protected]. An early draft of this paper was presented at the conference on Globalization, Asian Economic Integration, and National Development Strategies: Challenges to Asia in a Fast Changing World, organised by the Forum on Debt and Development (Fondad) in Kuala Lumpur in August 2007. We thank the conference organisers and participants, especially Wing Thye Woo and Joel Helman.
192 M. Chatib Basri and Arianto A. Patunru
The notion of relying less on exports and focusing more on the domestic market has triggered lively discussion among commentators, politicians and policy makers in Indonesia. It has also afforded space for economic protectionism to re-emerge – a problem compounded by the global environment itself, which is less than condu-cive to an open trade regime at present. The failure to complete the WTO’s Doha Round of international trade negotiations seems to relect a lack of commitment among global leaders to realising a multilateral free trade agreement. Creeping pro-tectionism is evident around the world, and Indonesia is no exception.
Indonesia provides a valuable case study of the political economy of trade pro-tection. Its earlier high levels of protection have been declining, despite the cur-rent signs of resurgent protectionism. The level of trade protection changed from time to time between 1970 and the 1997–98 Asian inancial crisis (AFC) (Basri and Hill 2004). The trade regime became more open after the International Monetary Fund (IMF) embedded conditions in its AFC rescue program for Indonesia. Its recommendations were not unexpected. Soesastro and Basri (1998) point out that a structural adjustment program necessitated the liberalisation of the economy. This was the boldest trade reform undertaken in Indonesia’s history. In 1998, domestic trade in agricultural products was fully deregulated. Most non-tariff barriers (NTBs) were also removed, further liberalising the economy.
Since 2001, however, protectionism has begun to creep back, as exempliied by increased protection especially of food crops. In addition, the government has imposed trade regulations and licensing requirements on textiles, steel, sugar and cloves. This recent protection is less obvious than previous measures, however, for three reasons. First, the level of protection in Indonesia is now lower than that of other Asian countries, including Thailand (Basri and Hill 2011a: 24). Second, the current Ministry of Trade continues to reduce the number of tariff lines that are subject to import restrictions. Third, the Indonesian government has been able to maintain an average tariff of less than 10%.
Nevertheless, it would be unwise to assume that pressures for trade protection will subside. Resistance to market reform from protectionist groups cannot be under-estimated. These groups are still prevalent and command some key posi-tions in both the government and the business sector. This invites the question of how to keep Indonesia’s trade policy open – a question of particular importance given the trend towards Asian integration. This paper aims to elucidate how con-lict over trade policy has been managed in Indonesia since the AFC, and to exam -ine the prospects for further trade liberalisation. But irst it is useful to offer a brief review of export performance.
EXPORT PERFORMANCE
Between 1990 and 1996, before the AFC, the dollar value of Indonesia’s total non-oil exports grew by an average of 17.6% per annum. Exports of manufactured goods grew by around 20%, giving manufacturing a share in total exports of more than 50% (Papanek 2011). This remarkable export performance was interrupted when the crisis broke in mid-1997. Total export growth plunged to 6% per annum in 1997, and manufactured goods exports grew by only 12%. In 1998, export growth remained sluggish at around 12.6% per annum (Papanek 2011). There was a rever -sal between 1999 and 2000, when exports recovered signiicantly, owing to massive
depreciation of the rupiah – the ‘J-curve effect’ (Athukorala 2006)1 – and a dramatic
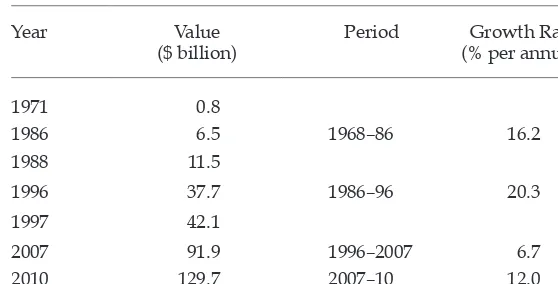
contraction of domestic demand for tradables (Rosner 2000). These factors caused Indonesia’s non-oil primary and manufacturing sectors to grow by 10% and 35% respectively in 2000. However, this recovery was short-lived. Between 2001 and 2004 Indonesia failed to restore its pre-crisis export performance, despite a sig-niicant improvement in the world economic environment after 2001. Table 1 sum -marises the performance of Indonesian exports between 1971 and 2010. It shows a sharp decline in export growth between 1986–96 and 1996–2007. Indonesia’s exports began to recover only in 2005, thanks to high commodity prices in inter-national markets, before collapsing during the GFC (Basri and Patunru 2006; Athu -korala 2006). Between 2007 and 2010, non-oil exports recovered from the effects of the GFC and grew by a remarkable 12% per annum.
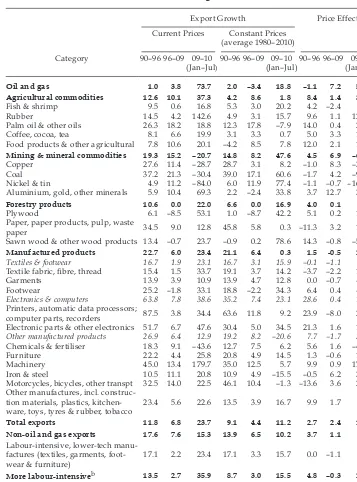
The decomposition of Indonesia’s non-oil export growth shows that the effect of changes in international prices (the price effect) was positive for most agricul-tural commodities and most mining and minerals commodities between 1996 and 2009, but was negative for labour-intensive sectors (table 2). In terms of volume, the export growth of labour-intensive manufactured goods (textiles, footwear and furniture) declined signiicantly, from 24% in 1990–96 to only 4% in 1996–2010 (Papanek 2011). Table 2 also indicates that the increase in Indonesia’s non-oil exports in 2009–10 was driven mainly by rising international commodity prices. This is shown by the signiicant increases in the price effects of exports in this period. For example, the price effect for agricultural commodities rose from 8% in 1990–96 to 36% in 2009–10 – almost ivefold – whereas that for manufactured products increased from 2% to 23%. This raises a question about the sustainability of Indonesia’s export performance.
Soesastro and Basri (2005) argue that external demand is not a constraining fac-tor for Indonesia’s exports. Rather, it is the supply side that suffers from serious and apparently systemic problems. The slowdown of Indonesian exports can be
1 The ‘J-curve effect’ in this context refers to depreciation resulting in a short-run deterio-ration in the trade balance, followed by a longer-run improvement.
TABLE 1 Non-oil and Gas Exports, 1971–2010
Year Value
($ billion)
Period Growth Rate (% per annum)
1971 0.8
1986 6.5 1968–86 16.2
1988 11.5
1996 37.7 1986–96 20.3
1997 42.1
2007 91.9 1996–2007 6.7
2010 129.7 2007–10 12.0
Source: Calculated from data supplied by the Central Statistics Agency (BPS).
194 M. Chatib Basri and Arianto A. Patunru
TABLE 2 Export Growth and Price Effecta
(annual change, %)
Export Growth Price Effect
Current Prices Constant Prices (average 1980–2010) Agricultural commodities 12.6 10.1 37.3 4.2 8.6 1.8 8.4 1.4 35.5
Fish & shrimp 9.5 0.6 16.8 5.3 3.0 20.2 4.2 –2.4 -3.3
Rubber 14.5 4.2 142.6 4.9 3.1 15.7 9.6 1.1 126.9
Palm oil & other oils 26.3 18.2 18.8 12.3 17.8 –7.9 14.0 0.4 26.7
Coffee, cocoa, tea 8.1 6.6 19.9 3.1 3.3 0.7 5.0 3.3 19.2
Food products & other agricultural 7.8 10.6 20.1 –4.2 8.5 7.8 12.0 2.1 12.3
Mining & mineral commodities 19.3 15.2 –20.7 14.8 8.2 47.6 4.5 6.9 –68.3
Copper 27.6 11.4 –28.7 28.7 3.1 8.2 –1.0 8.3 –36.9
Coal 37.2 21.3 –30.4 39.0 17.1 60.6 –1.7 4.2 –91.0
Nickel & tin 4.9 11.2 –84.0 6.0 11.9 77.4 –1.1 –0.7 –161.4
Aluminium, gold, other minerals 5.9 10.4 69.3 2.2 –2.4 33.8 3.7 12.7 35.6
Forestry products 10.6 0.0 22.0 6.6 0.0 16.9 4.0 0.1 5.1
Plywood 6.1 –8.5 53.1 1.0 –8.7 42.2 5.1 0.2 10.9
Paper, paper products, pulp, waste
paper 34.5 9.0 12.8 45.8 5.8 0.3 –11.3 3.2 12.5
Sawn wood & other wood products 13.4 –0.7 23.7 –0.9 0.2 78.6 14.3 –0.8 –54.9
Manufactured products 22.7 6.0 23.4 21.1 6.4 0.3 1.5 -0.5 23.1 Textiles & footwear 16.7 1.9 23.1 16.7 3.1 15.9 –0.1 –1.1 7.2
Textile fabric, ibre, thread 15.4 1.5 33.7 19.1 3.7 14.2 –3.7 –2.2 19.5
Garments 13.9 3.9 10.9 13.9 4.7 12.8 0.0 –0.7 –1.8
Footwear 25.2 –1.8 33.1 18.8 –2.2 34.3 6.4 0.4 –1.2
Electronics & computers 63.8 7.8 38.6 35.2 7.4 23.1 28.6 0.4 15.5
Printers, automatic data processors;
computer parts, recorders 87.5 3.8 34.4 63.6 11.8 9.2 23.9 –8.0 25.2
Electronic parts & other electronics 51.7 6.7 47.6 30.4 5.0 34.5 21.3 1.6 13.1
Other manufactured products 26.9 6.4 12.9 19.2 8.2 –20.6 7.7 –1.7 33.5
Chemicals & fertiliser 18.3 9.1 –43.6 12.7 7.5 6.2 5.6 1.6 –49.8
Furniture 22.2 4.4 25.8 20.8 4.9 14.5 1.3 –0.6 11.3
Machinery 45.0 13.4 179.7 35.0 12.5 5.7 9.9 0.9 174.0
Iron & steel 10.5 11.1 20.8 10.9 4.9 –15.5 –0.5 6.2 36.3 Motorcycles, bicycles, other transpt 32.5 14.0 22.5 46.1 10.4 –1.3 –13.6 3.6 23.8
Other manufactures, incl. construc-tion materials, plastics,
kitchen-ware, toys, tyres & rubber, tobacco 23.4 5.6 22.6 13.5 3.9 16.7 9.9 1.7 5.9
Total exports 11.8 6.8 23.7 9.1 4.4 11.2 2.7 2.4 12.5 Non-oil and gas exports 17.6 7.6 15.3 13.9 6.5 10.2 3.7 1.1 5.0
Labour-intensive, lower-tech manu-factures (textiles, garments,
foot-wear & furniture) 17.1 2.2 23.4 17.1 3.3 15.7 0.0 –1.1 7.7
More labour-intensiveb 13.5 2.7 35.9 8.7 3.0 15.5 4.8 –0.3 20.3 Less labour-intensivec 21.1 13.1 –3.2 17.2 9.2 17.0 3.9 3.8 –20.2 Commodity-based exports 7.5 7.5 18.9 5.0 3.2 20.7 2.5 4.3 –1.9
a The price effect is the difference in value at current and at constant prices; it is used to observe whether the
increase in the value of exports is due more to price changes in international markets or to volume changes.
bMore labour-intensive: ish & shrimp; rubber; coffee; cocoa; tea; food products & other agricultural exports;
plywood; textiles; footwear; furniture; other manufactures.
cLess-labour intensive: palm oil & other oils; minerals; paper & paper products; sawn wood & other wood
products; chemicals & fertiliser; machinery; iron & steel; motorcycles; bicycles; other transport.
Source: Papanek (2011), using BPS data supplied by Tim Buehrer and the World Bank.
attributed to supply problems including the high cost of doing business (the ‘high-cost economy’), weak industrial relations policy, rigidities in the labour market and poor infrastructure. These factors have prevented exports from growing rapidly. Moreover, supply is relatively inelastic to the price effect arising from increased market access. Market access, although important, is therefore not the main concern in efforts to boost Indonesia’s export performance. The burning question is how to improve the supply side. Without good support from ‘supply-side factors’, Indo-nesia will not be able to reap the full beneits of access to partners’ markets. Supply-side problems will lower the incentive for Indonesia to participate actively in market access negotiations. The beneits from negotiating for further trade liberalisation are small because the gains cannot be realised fully in the short term. Bhagwati et al. (2011: 27–9) reinforce this argument and urge the importance of ‘aid for trade’ – the provision of trade-related funding, capacity building and technical assistance – to help developing countries, including Indonesia, to enhance their capacity to partici-pate in the international trading system and enter into trade agreements.
TRENDS IN TRADE PROTECTION
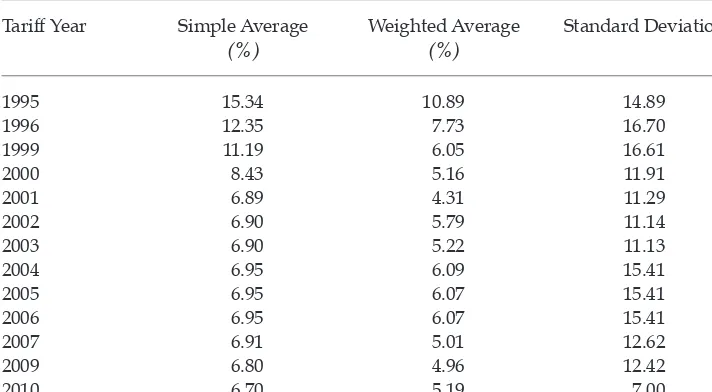
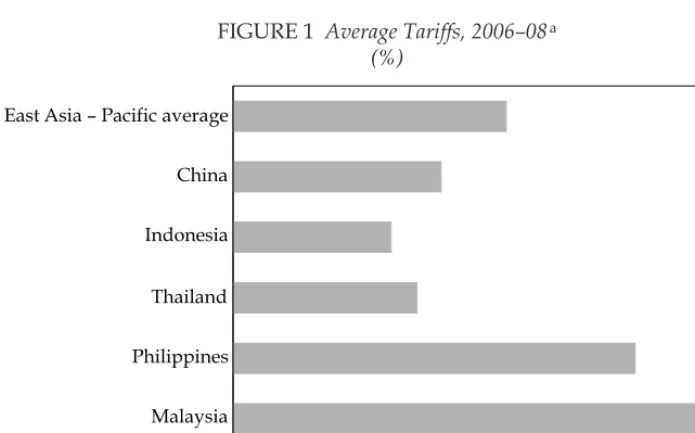
According to Patunru and Basri (2011: 204), Indonesia ‘has been making efforts to increase eficiency by removing restrictions on trade, investment and pro -duction, and by streamlining procedures at the border.’ As a consequence, it has been able to afford tariff reductions to a weighted average of less than 10% since 1996. Table 3 lays out the structure of Indonesia’s most-favoured-nation (MFN) tariffs from 1995 to 2010. Figure 1 shows that Indonesia’s average tariff was lower than that of several countries in Asia in 2006–08, and lower than the East Asian average. A shortcoming of the average tariff as a measure, how-ever, is that it does not capture the impact of NTBs or subsidies, which are also
TABLE 3 Structure of Indonesia’s Most-Favoured-Nation (MFN) Tariffs, 1995–2010
Tariff Year Simple Average (%)
Weighted Average (%)
Standard Deviation
1995 15.34 10.89 14.89
1996 12.35 7.73 16.70
1999 11.19 6.05 16.61
2000 8.43 5.16 11.91
2001 6.89 4.31 11.29
2002 6.90 5.79 11.14
2003 6.90 5.22 11.13
2004 6.95 6.09 15.41
2005 6.95 6.07 15.41
2006 6.95 6.07 15.41
2007 6.91 5.01 12.62
2009 6.80 4.96 12.42
2010 6.70 5.19 7.00
Source: World Bank, World Integrated Trade Solution (WITS) data.
196 M. Chatib Basri and Arianto A. Patunru
forms of trade protection. A measurement is needed that can incorporate the various forms of trade protection, including NTBs and subsidies. This need can be met by nominal rates of protection (NRPs, deined as the percentage differ -ence between the domestic price and the world price at the border converted at the oficial exchange rate) and effective rates of protection (ERPs, deined as ‘the proportion by which value added per unit of output with distortive poli-cies in effect exceeds the level under free trade’; Marks and Rahardja 2012: 59). Marks and Rahardja (2012) analyse movements in these measures for Indonesia between 1995 and 2008.
While tariff rates have fallen or remained stable, non-tariff barriers have lour -ished in recent times. In the agriculture sector, sensitive products such as rice, cloves, salt, sugar, corn and soybeans have been subject to special import licens-ing; the irst three have also been to the subject of exclusive import rights granted to domestic producers (World Bank 2004). According to the WTO (2007: 47), ‘Indonesia continues to ban imports of chicken parts, a ban originally imposed in September 2000 by the Directorate General of Livestock Services in the Min-istry of Agriculture. It also imposes quantitative restrictions on imports of meat and poultry products, requiring an Importer Letter of Recommendation …, which may affect the quantity allowed to enter’.
Marks and Rahardja (2012: 81, table 9) show that both NRPs and ERPs for food crops increased between 1995 and 2008, from 11% to 17% and 16% to 24% respec -tively. In assessing the protective effect, the authors calculate not only the level of the ERP or NRP, but also the dispersion or deviation of individual activity rates from the average, which relects the distortionary effects of the structure of protection. The coeficients of variation for both NRPs and ERPs increased
FIGURE 1 Average Tariffs, 2006–08a
(%)
a Overall Trade Restrictiveness Index (applied tariff, including preferences and non-tariff measures;
all goods).
Source: World Bank, World Trade Indicators.
between 1995 and 2008, from 2.2% to 3.9% and 2.9% to 4.9% respectively. These igures provide evidence of a tendency to creeping protectionism in Indonesia in this period.
The case of rice: who is being protected?2
Rice is the most important staple food in Indonesia. Rice growing is also the main livelihood of small farmers and agricultural households in Indonesia. Rice repre-sents 7.2% of average consumer expenditure and provides employment for 7.1% of the total workforce ‘at the farm level alone’ (Warr 2005: 429–30). It is also a major source of employment for the poor: 35% of poor people work as rice farm -ers, while 33% farm other commodities and 32% are non-farmers (McCulloch 2008: 52). Per capita consumption of rice in Indonesia is around 140 kilograms per annum, compared with that for corn (for food), crude palm oil (for cooking oil) and soybean of 22, 18 and 8 kilograms, respectively (Patunru and Basri 2011: 205, 225).
But Indonesia has been a long-time net importer of rice (Dawe 2008: 119). Furthermore, over three-quarters of the poor were net consumers of rice in 2004 (World Bank 2007; McCulloch 2008: 54). So rice price increases are bound to hurt the poor on average. One would therefore expect strong public resistance against trade protection of rice. The reverse is true, however. In fact, rice has always been protected since 2000, with little resistance from consumers.
The Indonesian government has two objectives in setting rice policy. First, it seeks to maintain a national stockpile to deal with disasters and to ensure access for the poor to rice. Second, it aims to stabilise the domestic price at levels consid-ered reasonable for both producers and consumers.
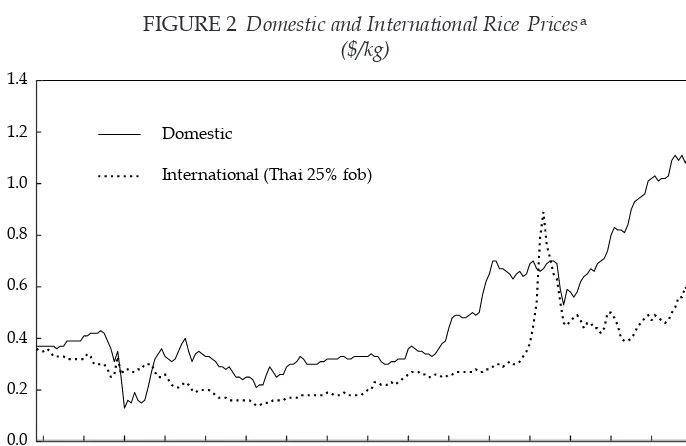
The Indonesian rice sector was basically unprotected in 1998, following the IMF structural reform package. However, this state of affairs was short-lived. The government imposed a speciic tariff of Rp 430/kg in 2000, then raised this to Rp 450/kg in 2005. In addition, NTBs such as import arrangements, controls and restrictions were imposed. In 2004, the Ministry of Industry and Trade issued a decree that effectively prohibited imports except when explicitly authorised by the minister. Owing to large stock levels before the increase in NTBs in January 2004, plus a very good harvest, there seemed to be no price pressure during 2004. But the rice price began to rise in the second half of 2005, as the stock was begin-ning to thin (igure 2).
The impact of government policies on the price of rice is measured by the NRP, which is negative when rice is taxed and positive when it is protected.3 Figure 3 shows that the increase in the NRP was consistent with divergence between the domestic and world prices. The NRP rose signiicantly after the import tariff was imposed in 2000. It rose markedly again when the tariff was
2 This section draws heavily on Patunru and Basri (2011).
3 The NRP may not accurately capture the impact of NTBs or subsidies, but if an NTB reduces available supplies, prices will respond such that the NRP will in fact relect the existence of the NTB. On the other hand, if a subsidy does not affect the price, it will not be captured in the NRP measure. In the case of rice, however, there were few subsidies; instead, an NTB was used as the policy instrument. We therefore chose to use a simple NRP in this analysis.
198 M. Chatib Basri and Arianto A. Patunru
increased in 2005. Domestic and world prices diverged substantially from December 2005 in response to domestic supply shortages caused partly by the government ban on rice imports since 2004 (World Bank 2007). So the domestic price of rice is affected by trade protection.
The ratio of domestic rice prices to international prices rose by 28% between mid-2005 and mid-2006 (Warr 2011: 62). The incidence of poverty had been declin -ing continuously since the mid-1970s, except for a reversal dur-ing the 1997–98 Asian inancial crisis. However, it rose again in this period, from 16% in 2005 to 17.8% in 2006. And unlike the previous rise, which occurred in a context of con -tracting GDP growth, this increase took place when GDP was growing at over 5% per annum (Warr 2011: 47–9).
In 2006, budget stringency led the government to allow the maintenance of a stock well below the ‘iron stock’ level.4 But much of the previous limited stock
had been used up in helping the victims of natural disasters. After long delibera-tion, the government decided to import a large amount of rice in order to keep to the budgeted stock level. As was the case in the past, the decision to import rice created much controversy, with strong opposition from the Indonesian Farm -ers Association (Himpunan Kerukunan Tani Indonesia, HKTI), memb-ers of the
4 The ‘iron stock’ level is the quantity considered an adequate buffer to safeguard food security at any given time in case of a rice deicit (Patunru and Basri 2011: 226, footnote 11).
FIGURE 2 Domestic and International Rice Pricesa
($/kg)
a Figures 2 and 3 are updated versions of igures 8.1 and 8.2 in Patunru and Basri (2011). The inter
-national rice price used in both graphs is that for Thai 25% broken rice, which is similar in quality to Indonesian rice. Prices are fob (free on board – the price at point of export, not including insurance and freight to destination). Domestic price data are for medium wholesale rice in Indonesia.
Source: CEIC Asia Database; Indonesian price data prior to 2000 were provided by Peter Rosner; Thai price data prior to 2000 are from Saifullah (2001).
legislature, and several NGOs, as well as from independent observers. The public debate turned on welfare and poverty issues.
McCulloch (2008: 46–7) cites a World Bank (2006) claim that around 75% of the rise in poverty in 2005–06 was accounted for by an increase of 33% in the price of rice during this period. Given that more than three-quarters of the poor are net consumers of rice, and therefore must be expected on average to be hurt by rice price increases, it is remarkable that opposition to rice imports is always so pro-nounced. No matter how sensible the decision to import rice, political interests always create obstacles to its implementation.
To make matters worse, government oficials often make confusing statements, claiming that the imported rice will not affect the domestic rice price. Of course, this contradicts the stated objective of the policy itself, namely to stabilise prices. Rice traders know that the purpose of having the stockpile is precisely to push prices down if they become too high, and to provide a supply of heavily subsi-dised rice to the poor and those stricken by natural disasters. So they make their own adjustments as soon as the intention to import is announced. Knowing that demand for market-sourced rice will decrease because consumers will be sup-plied by the government, they decrease their buying price even before the import policy becomes effective.
Patunru and Basri (2011) offer two explanations for the public attitude to rice import protection in Indonesia. First, the demand for import protection tends to increase when Indonesia’s real effective exchange rate appreciates. For rice, this was particularly true in 2006, when the real effective exchange rate appre -ciated by almost 90% of its pre-GFC value. Second, the large group of net rice
FIGURE 3 Nominal Rate of Protection (NRP)a and Price Wedgeb for Rice
a For rice price data used in the NRP calculation and the price wedge, see igure 2, note a. In igure 3,
prices are adjusted for per tonne additional freight and transport costs of $10, $15, $20, $25, $30 and $35 respectively for the periods 2000–01, 2002–04, 2005–06, 2007–08, 2009–11 and 2012–present.
b The price wedge is the difference between Indonesia’s rice price and the world price.
Source: CEIC Asia Database.
200 M. Chatib Basri and Arianto A. Patunru
consumers
, who stand to lose from protection, have less incentive to ight against
protection than the smaller group of net producers have to ight for it. Because to oppose protection will bring relatively thin net beneits to be shared among the many individual consumers, they rationally opt not to ight. On the other hand, the net producer group have strong incentives to ight for protection, and as a consequence they appear stronger than the net consumer group. It is therefore predictable that the government will side with the producer group in support of protection, and that this will lead to higher prices and hence hurt the poor. In addition, it is widely believed that trade protection safeguards jobs for the poor. This argument has been used extensively by protectionists, and has had an inlu -ence on public perceptions.
Non-tariff measures for other products
As in the case of agriculture, for certain sensitive manufactured products (such as textiles, textile products, footwear, electronics and toys) non-tariff protection has been maintained or even strengthened since 2002 through special licences (World Bank 2004). In 2002 the then Minister of Industry and Trade issued a decree concerning textile import arrangements, which stated that only those com-panies with production facilities that use imported fabrics as inputs for inished products were permitted to obtain import licences. The WTO (2007: 47) reports expressions of concern by Indonesia’s trading partners that these import licens-ing requirements restrict and distort trade. In the same year, in response to pres-sure from local manufacturers, Indonesia introduced a regulatory framework in 2002 ‘to safeguard … domestic industry against a surge in the import of goods’ (Presidential Decree 84/2002). To overcome the problem of smuggling, the Min-ister of Industry and Trade issued another decree in 2002 requiring importers of certain products, including corn, rice, soybeans, sugar, textiles and related prod-ucts, shoes, electronics and toys, to obtain a special importer identiication code number. Products not covered by an importer identity card risked being detained at ports (WTO 2007: 47).
The trend towards protectionism continues and has become even stronger recently. For example, the import of salt is now prohibited on a seasonal basis, and the 2010 Horticulture Law states that businesses must give priority to local products (Hill and Wihardja 2011). Early this year the Minister of Agriculture also announced restrictions on imports of certain horticultural goods through the main seaport of Tanjung Priok in Jakarta (Olivia and Yamauchi 2012: 157, in this issue).
On the export side, the new Minister of Trade,5 Gita Wirjawan (formerly the chair
of the Investment Coordinating Board), announced a ban on the export of raw and semi-processed rattan from January 2012 to assist domestic producers of rattan fur -niture (Jakarta Post, 1/1/2012). In 2005 the government imposed export taxes on raw skins (25%), white tanned hides (15%) and coal (5%). Furthermore, in response to strong pressure from consumers, domestic cooking oil producers and the Ministry of Industry, the government imposed an export tax on crude palm oil (see below).
5 In October 2004 the Ministry of Industry and Trade was broken up into separate minis-tries for industry and trade.
Export taxes: crude palm oil and cooking oil
The international price of palm oil surged in the irst half of 2007 owing to strong demand and slowing production. Demand was driven primarily by the bio-diesel industry, especially in European countries, and by demand for household cooking oil in China and India. Meanwhile production was slow, especially in Malaysia, a major producer of crude palm oil. In June 2007 the price reached a 23-year high growth rate of 4.5% (World Bank 2007).
In Indonesia this meant increasing tension between the producers of crude palm oil (CPO) and those of cooking oil. Like Malaysia, Indonesia has been a large exporter of CPO. Cooking oil, on the other hand, is used mainly by the domestic market. The high international price created a strong incentive for CPO producers to focus their resources on exports. This increased the domestic price by reducing supply, thus hurting the cooking oil industry, which uses CPO as its main input.
The price of cooking oil is of public importance because the product is needed by virtually everybody to cook meals. Not surprisingly, the media quickly spread the bad news. On the other hand, the export of CPO is not of direct concern to the majority of the populace. Therefore, the producers’ response to the rising international price was judged rather negatively as being ‘insensitive to domestic needs’. The Ministry of Industry echoed this concern and suggested that CPO supply to the domestic market should be made mandatory. The Ministry of Trade and the Ministry of Finance, on the other hand, were more inclined to rely on price policy, that is, an export tax. Previously, the export of CPO had been subject to a 1.5% tax. Given the international price boom in mid-2007, after long delib-eration the government decided in August 2007 to increase the export tax to the surprisingly high rate of 6.5%. This decision relected a compromise between the opposing ministries in the cabinet. By early 2012, the CPO export tax had risen to 15% (Bisnis Indonesia, 22/12/2011).
The foregoing discussion provides ample evidence that, despite the continued decline in import tariffs, NTBs and export taxes have been on the rise.6 Since the separation of the industry and trade portfolios in October 2004, there has been tension between the two ministries over trade protection. The previous trade min-ister, Mari Pangestu, made signiicant efforts to reduce NTBs, including those on sugar and rice. However, she encountered strong resistance from the Ministry of Agriculture, the Ministry of Industry and protectionist groups. In 2011, Pangestu was replaced as trade minister and assigned the new post of Minister for Tourism and Creative Economy. It is too early to assess the position of the new trade minis-ter, Gita Wirjawan. But some evidence about the protection of domestic industries such as salt, horticultural goods and ish suggests that further opening of the trade regime may be less likely in the years ahead. As the 2014 election nears, the presi-dent seems to be trying to strike a compromise between trade liberalisation and protectionist sentiment.
6 A reviewer of this paper noted that measuring NTBs is a very challenging task precisely because of their ‘non-tariff’ nature. In Patunru and Basri (2011), we assumed that the NTB on rice, for example, is captured in the measurable NRP, albeit inaccurately (see footnote 3). That study showed that the NRP increased substantially following the government ban on rice imports.
202 M. Chatib Basri and Arianto A. Patunru
CAN INDONESIA MAINTAIN ITS OPEN TRADE POLICY?
Basri and Hill (2004) offer some possible explanations for Indonesia’s success in liberalising
its trade regime in the mid-1980s. First, the exchange rate depreciation
of that period suppressed the demand for protection. Second, trade reform was undertaken in order both to pre-empt and to overcome economic crisis. Third, greater reliance on market forces, part of a general global economic trend, par-ticularly in East Asian countries, contributed to pressure for trade reform in the mid-1980s. Fourth, there was pressure from the public, especially the so-called ‘liberal epistemic community’, which vigorously advocated economic deregula-tion in Indonesia in the mid-1980s (Mallarangeng 2000).7
The question now is whether Indonesia can maintain its open trade regime. The likely explanatory factors for the dynamics of trade policy are real exchange rate appreciation; political attitudes to trade reform (the competing interests of tech-nocrats, politicians, the media, the bureaucracy and civil society); economic crisis; and involvement in international agreements. We have discussed the impact of the real exchange rate on the protection of rice.8 We will now focus on the
tax-onomy of political attitudes to trade reform and on the global environment.
The distributive consequences of reform
Although the political economy of trade protection can seemingly be explained by the simplest short-run, proit-seeking political economy model, the reality is considerably more complex. As the real exchange rate can only partly explain creeping protectionism, we need to look also at the distributive consequences of reform. Support for, or objection to, trade reform is determined by its dis-tributional impact on various interest groups. This approach argues that the politics of trade liberalisation usually focuses on conlict among interest groups attempting to increase their share of national income. In other words, trade lib-eralisation is closely associated with income distribution (Rodrik 1998).9 This
framework will help us to understand the taxonomy of political attitudes to trade reform in Indonesia.
7 The term ‘liberal epistemic community’ in this context refers to a group in Indonesian so-ciety that tried to convince both the government and the people that the best solution to the growing economic problems was economic liberalisation (Mallarangeng 2000). The mem-bers of the ‘liberal epistemic community’, who included prominent Indonesian economists such as Iwan Jaya Azis, Anwar Nasution, Sjahrir, Mari Pangestu, Mohammad Sadli and Hadi Soesastro, and editorial writers of some major newspapers and magazines, viewed deregulation as a powerful force for broader liberal transformation.
8 In fact, with the continuing depreciation of the rupiah caused by the European debt crisis, and relatively low inlation, Indonesia has recently been able to improve the com-petitiveness of its real exchange rate.
9 Although this framework can help to conigure the winners and losers from trade re-form, it has its own limitations. As Rodrik (1998) admits, by its very nature, trade liber-alisation creates many winners whose identity cannot be predicted prior to the reform. For example, in the medium or even the long term, some import-competing industrialists could transform themselves into export-oriented industrialists, and eventually support trade reform. The full coniguration of winners and losers becomes apparent only after the reform has taken place.
In the current Indonesian political system the president is directly elected by the people, who also elect the members of the parliament. With some key differences, Indonesia’s political system is comparable with that of the US. It is essentially a multi-party presidential system, in which ‘the political parties dominate both houses, and the president’s party has thus far not enjoyed a majority’ (Basri and Hill 2011b: 101). As a result, the political parties have become increasingly domi -nant and, in order to have a working majority in the parliament, President Susilo Bambang Yudhoyono has had to build a cabinet that takes the form of a ‘rainbow coalition’ (Basri and Hill 2011b: 101). He has had to accept that the cabinet must relect political reality and cannot be based only on technocratic merit. Against this political backdrop, the success of trade reform will depend heavily on sup-port from various political actors. Table 4 presents a taxonomy of political supsup-port for trade reform.
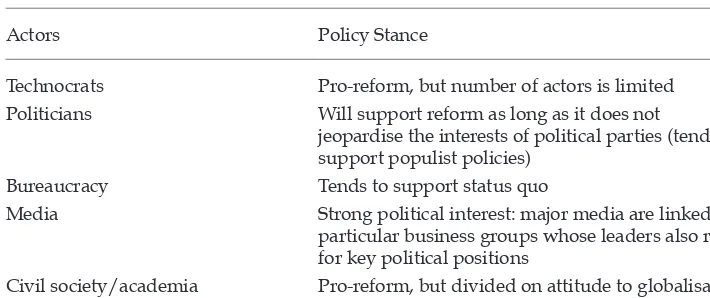
The most ‘reliable’ proponents of reform are the technocrats. While it is true that some key economic positions in the government are still held by technocrats, their numbers are limited. In the 2011 cabinet reshufle, the president replaced the Minister of Trade, Mari Pangestu, whose market-friendly approach had made her an icon of the Indonesian technocratic tradition. In 2010, one of the most able technocrats in the history of Indonesian economic policy making, Sri Mulyani Indrawati, resigned as inance minister. Many analysts, including Hill (2010), have linked her resignation to political pressure placed on her over the provision of a bail-out for the troubled Bank Century in 2008 (Patunru and Von Luebke 2010: 10–12). The reasons for her resignation are in fact dificult to sepa -rate from political tensions that arose between her and Aburizal Bakrie, chair of the Golkar Party. In an interview published in the Asian Wall Street Journal (10/12/2009), Indrawati stated that the tension between herself and Bakrie was connected with her opposition in 2008 to an extension of the closure of Indo-nesia’s stock exchange amidst a run on companies controlled by Bakrie. The departure of these two reformist ministers from key economic portfolios illus-trates the challenges facing unilateral trade reform.
What about the role of politicians, the bureaucracy, the media and civil soci-ety in driving trade reform (table 4)? Politicians are often ambivalent about trade
TABLE 4 Taxonomy of Political Attitudes to Trade Reform in Indonesia
Actors Policy Stance
Technocrats Pro-reform, but number of actors is limited Politicians Will support reform as long as it does not
jeopardise the interests of political parties (tend to support populist policies)
Bureaucracy Tends to support status quo
Media Strong political interest: major media are linked to particular business groups whose leaders also run for key political positions
Civil society/academia Pro-reform, but divided on attitude to globalisation
204 M. Chatib Basri and Arianto A. Patunru
reform. They will support it so long as it strengthens their political position, but will reject it once it becomes unpopular. Unfortunately, the classic dilemma of trade
reform is that the costs are immediate while the beneits appear only in the medium to long term. Thus, it is more likely that politicians, with their short-term perspective, will oppose trade reform. As for the bureaucracy, its members on the whole tend to support the status quo. While it is true that there is a spirit among some bureaucrats to push for further reform, its implementation will reduce their power and their potential to earn ‘extra income’. The media and civil society are widely divided on the issue of globalisation and hence on trade reform. The Indonesian media and NGOs tend to oppose globalisation. Finally, the political interests of media owners may be hurt by trade reform through their business networks.
Against this backdrop, trade reform in Indonesia can be expected to face seri-ous challenges. The decline in Indonesia’s competitiveness due to supply-side constraints and the possibility of economic slowdown in response to the Euro-pean debt crisis will also make further unilateral trade liberalisation more difi -cult. Thus, the tug-of-war between protectionists and trade reform advocates will continue. Of course this simple taxonomy may not relect the political economy of the future if technocrats begin to work with the media, civil society and politi-cians. However, we argue that this will not happen in the short term, especially as Indonesia approaches the 2014 elections.
Multilateral reform or bilateral agreements?
If supply constraints, exchange rate appreciation and the domestic political econ-omy coniguration do not lend support to unilateral trade reform, will Indonesia’s trade reforms backtrack? Fortunately, as Basri and Hill (2011b) suggest, there are two factors that may prevent this.
The irst is Indonesia’s commitment to the provisions of the WTO and, most importantly, to regional trade agreements including the ASEAN Free Trade Area (AFTA) and the ASEAN–China Free Trade Area (ACFTA). Despite strong domestic resistance towards ACFTA, Indonesia will not renegotiate the agree -ment. Instead, it will merely rebalance trade between Indonesia and China by implementing strategies such as imposing an obligation on China to purchase certain goods from Indonesia or ASEAN, conducting promotional cooperation, and requesting Chinese assistance with capacity building in a number of sectors (Bisnis Indonesia, 12 April 2012).
Second, Indonesia does not want to be left out of ‘competitive liberalisation’, that is, keeping up with the reforms of other countries. If it does not participate in trade agreements, it may suffer through possible trade diversion. Thus, it is important to look at trade policy in the context of multilateral and regional trade agreements.
Indonesia has been actively involved in both multilateral and regional/bilat-eral trade agreements. It is a member of the WTO and a strong supporter of its Doha Development Agenda. Indonesia also plays important roles in the Asia-Paciic Economic Cooperation (APEC) forum and ASEAN, and was a key actor in the establishment of AFTA. It also supports the development of ‘ASEAN+’ agreements (with China, Japan, Korea, Australia, New Zealand and India). At the same time it engages with individual countries to establish cooperation in
the form of free trade areas (FTAs) or preferential trade agreements (PTAs) such as those with Pakistan, India and Iran, and its economic partnership agreement (EPA) with Japan.10
However, Indonesia’s engagement in FTA talks may not be going as smoothly as planned. Despite a series of negotiations, few FTA schemes show progress with regard to trade liberalisation. There are three factors that contribute to this. First, thus far FTA facilities have been under-utilised (Baldwin 2006). Second, the pro -liferation of FTAs diverts resources away from multilateral (WTO) agreements. Third, FTAs are prone to overlap, and this can create highly complex conlicts among rules of origin – the ‘spaghetti bowl effect’ described by Bhagwati (1995). This should not be under-estimated, because in any FTA negotiation there are competing protectionist interests from all sides.
Further unilateral liberalisation is not easy in an environment of creeping pro -tectionism, and the multilateral agenda is still in limbo, with the Doha Round of negotiations stalled (Bhagwati et al. 2011). So Indonesia is left in the dificult posi -tion of relying on FTAs and PTAs for trade liberalisa-tion. There are at least three principles that Indonesia should uphold so as to achieve optimal gains from trade with other countries. First, FTAs should be in line with MFN non-discriminatory principles. Second, engagement in any trade arrangement with foreign partners should be consistent with efforts to improve the quality of institutions at home. Third, when progress has been made on the supply side, further unilateral liber-alisation should be resumed.
Recent developments are rather mixed in relation to the irst of these three prin -ciples So far, AFTA seems to be on track, but some bilateral FTAs may lead to trade diversion rather than trade creation. The Indonesian government considers regional cooperation as a building block for longer-term multilateral trade liber-alisation. It views AFTA and APEC as being consistent with the Multilateral Trad -ing System of the WTO, and the General Agreement on Trade in Services (GATS) (WTO 2007).
A few institutional reforms such as those in customs have been initiated, partly in order to comply with trade arrangements such as the ASEAN National Single Window. The EPA scheme with Japan seems to contribute to institutional reform. However, the rules of origin problem could lead to great confusion and complex-ity as Indonesia enters into other bilateral FTAs. If the ASEAN Economic Com -munity is added to this, with yet another set of rules of origin, it is dificult not to be concerned about a likely ‘spaghetti bowl’ effect.11
Government procurement is a major unresolved problem. Indonesia is not a signatory to the WTO Agreement on Government Procurement (GPA), which is designed to ensure that procurement does not involve protection of domestic products or services. However, if the government were to sign the GPA, it could use this scheme to push for institutional improvements at home.
10 The EPA goes beyond trade cooperation, covering rules of origin, customs procedures, investment, services, movement of persons, competition policy and energy cooperation. 11 We could add to this list ASEAN participation in the Trade and Investment Agreement (TIFA) with the US, the Trade and Investment Framework (TIF) with Australia and the Trade and Investment Cooperation Arrangement (TICA) with Canada.
206 M. Chatib Basri and Arianto A. Patunru
Indonesia’s rising importance in the international arena (for example, as chair of ASEAN in 2011 and of APEC in 2013, and as an active member of the G20) should be exploited to the greatest extent possible to help push the multilateral trade agenda. As the former trade minister, Mari Pangestu, said in May 2011:
Indonesia remains highly committed to an ambitious, comprehensive, and balanced Doha Round as a single undertaking. … Asia or ASEAN must … play a leadership role and ensure that regional accords become building blocks …. But in the absence of an updated WTO framework, I think … regionalism [is in] danger of becoming a stumbling block and not a complement to the multilateral trading system. [There-fore] all regional and bilateral agreements should have WTO-plus standards.12
It is clear that Indonesia sees the recent proliferation of FTAs and PTAs as infe -rior to participation in the WTO framework. However, such agreements are inevi-table in the absence of a completed Doha Round. Therefore it is essential for the government to prepare for easy transition to WTO implementation by coordinat-ing all the various agreements it enters into. This includes, for example, a scoordinat-ingle rules of origin and customs classiication system.
THE WAY AHEAD AND POLICY IMPLICATIONS
The economy seems to be headed in the right direction. GDP growth continues to accelerate, rising from 6.1% in 2010 to 6.5% in 2011. The government has suc -cessfully managed some external threats, including a high oil price and natural disasters, while maintaining political stability. Nevertheless, we cannot assume that pressures for trade protection will subside soon. In light of the determi-nants of trade protection, the tug-of-war between the pro– and anti–trade reform groups is likely to continue and to involve extremely complex bargaining and coalition between rent-seekers, interest groups and various government agen-cies. In addition, real exchange rate appreciation, rigidities in the labour market and the high-cost economy have eroded Indonesia’s competitiveness. This will make further unilateral trade liberalisation more dificult. Unless Indonesia can maintain the competitiveness of its real exchange rate by controlling inlation, overcoming supply-side problems (in part through revision of the current labour law), improving infrastructure and curbing the high-cost economy through fur-ther economic deregulation, the prospects for furfur-ther trade liberalisation will not be good. Nevertheless, Indonesia’s commitment to the WTO, as well as to AFTA and the creation of an ASEAN Economic Community, could help counterbalance protectionist pressures.
12 This is a part of Minister Pangestu’s address to a conference on ‘Asia Paciic Perspec-tives on the Future of the World Trade System’, organised by the US Asia Paciic Council on 23 May 2011; the address was published by the East West Center in Washington Report,
Vol. 3, July 2011.
REFERENCES
Athukorala, P. (2006) ‘Post-crisis export performance: the Indonesian experience in regional perspective’, Bulletin of Indonesian Economic Studies 42 (2): 177–211.
Baldwin, R.E. (2006) ‘Multilateralising regionalism: spaghetti bowls as building blocs on the path to global free trade’, World Economy 29 (11): 1,451–1,518.
Basri, M.C. and Hill, H. (2004) ‘Ideas, interests and oil price: the political economy of trade reform during Soeharto’s Indonesia’, World Economy 27 (5): 633–55.
Basri, M.C. and Hill, H. (2011a) ‘Indonesian growth dynamics’, Working Papers in Trade and Development No. 2010/10, Arndt–Corden Department of Economics, Crawford School of Economics and Government, ANU College of Asia and the Paciic, Australian National University, available at <http://www.crawford.anu.edu.au/acde/ publications/publish/papers/wp2010/wp_econ_2010_10.pdf>.
Basri, M.C. and Hill, H. (2011b) ‘Indonesian growth dynamics’, Asian Economic Policy Review 6 (1): 90–107.
Basri, M.C. and Patunru, A.A. (2006) ‘Survey of recent developments’, Bulletin of Indonesian Economic Studies 42 (3): 295–319.
Bhagwati J. (1995) ‘U.S. trade policy: the infatuation with free trade agreements’, in The Dangerous Drift to Preferential Trade Agreements, eds J. Bhagwati and A.O. Krueger, AEI
Press, American Enterprise Institute, Washington DC.
Bhagwati, J., Sutherland, P., Baldwin, R., Amoako, K.Y., Basri, M., Guth, E., Serra, J., Togan, S. and Von Hagen, J. (2011) Last Chance for the Doha Round, Final Report produced by the
High Level Trade Expert Group, May, available at <http://www.bis.gov.uk/assets/ biscore/international-trade-investment-and-development/docs/w/11-964-world-trade-and-the-doha-round.pdf>.
Boediono (2009) Indonesia: lessons and responses to the global crises, Public lecture, Raja-ratnam School for International Studies, Singapore, 28 July.
Dawe, D. (2008) ‘Can Indonesia trust the world rice market?’, Bulletin of Indonesian Eco-nomic Studies 44 (1): 115–32.
Hill, H. (2010) ‘Where the power lies in Indonesia’, Wall Street Journal, 17 May.
Hill, H. and Wihardja, M. (2011) ‘Indonesia’s reform reversal’, Wall Street Journal, 30 November.
McCulloch, N. (2008) ‘Rice prices and poverty in Indonesia’, Bulletin of Indonesian Economic Studies 44 (1): 45–63.
Mallarangeng, R. (2000) ‘Liberalizing New Order Indonesia: Ideas, Epistemic Community, and Economic Policy Change, 1986–1992’, Unpublished PhD thesis, Ohio State Univer-sity, Columbus OH.
Marks, S. and Rahardja, S. (2012) ‘Effective rates of protection revisited for Indonesia’, Bul-letin of Indonesian Economic Studies 48 (1): 57–84.
Olivia, S. and Yamauchi, C. (2012) ’Survey of recent developments’, Bulletin of Indonesian Economic Studies 48 (2): 143–71, in this issue.
Papanek, G. (2011) Employment and the growth and stagnation of labour-intensive exports, 1975–2010: a return to dependence on commodity exports, Jakarta, mimeo.
Patunru, A.A and Basri, M.C. (2011) ‘The political economy of rice and fuel pricing in Indo-nesia’, in Poverty, Food, and Global Recession in East Asia, eds A. Ananta and R. Barichello, Institute of Southeast Asian Studies, Singapore.
Patunru, A.A and Von Luebke, C. (2010) ’Survey of recent developments’, Bulletin of Indo-nesian Economic Studies 46 (1): 7–31.
Rodrik, D. (1998) ‘The rush of free trade in the developing world: Why so late? Why now? Will it last?’, in The Political Economy of Reform, eds F. Sturzenegger and M. Tomassi, MIT
Press, Cambridge MA: 207–39.
208 M. Chatib Basri and Arianto A. Patunru
Rosner
, L.P. (2000) ‘Indonesia’s non-oil export performance during the economic crisis: dis -tinguishing price trends from quantity trends’, Bulletin of Indonesian Economic Studies
36 (2): 61–95.
Saifullah, A., 2001. ‘Peran Bulog dalam kebijakan perberasan nasional [The role of Bulog in the national rice policy]’, in Bunga Rampai Ekonomi Beras [Selected Papers on Rice Economics], eds A. Suryana and S. Mardianto, LPEM-FEUI (Institute for Economic and Social Research, Faculty of Economics, University of Indonesia), Jakarta.
Soesastro, H. and Basri, M.C. (1998) ‘Survey of recent developments’, Bulletin of Indonesian Economic Studies 34 (1): 3–54.
Soesastro, H. and Basri, M.C. (2005) ‘The political economy of trade policy in Indonesia’,
ASEAN Economic Bulletin 22 (1): 3–18.
Warr, P. (2005) ‘Food policy and poverty in Indonesia: a general equilibrium analysis’, Aus-tralian Journal of Agricultural and Resource Economics 49 (4): 429–51.
Warr, P. (2011) ‘Poverty, food prices and economic growth’, in Employment, Living Stand-ards and Poverty in Contemporary Indonesia, eds C. Manning and S. Sumarto, Institute of Southeast Asian Studies, Singapore: 47–65.
World Bank (2004) Rebuilding Indonesia’s export competitiveness, World Bank, Jakarta, mimeo.
World Bank (2006) Managing Through a Global Downturn, East Asia Update, World Bank, East Asia and Paciic Region, Washington DC.
World Bank (2007) Issues in Indonesian rice policy, World Bank, Jakarta, mimeo.
WTO (World Trade Organization) (2007) Trade Policy Review: Indonesia 2007, WTO, Geneva, November, available at <http://www.wto.org/english/tratop_e/tpr_e/ tp_rep_e.htm>.