Full Terms & Conditions of access and use can be found at
http://www.tandfonline.com/action/journalInformation?journalCode=vjeb20
Journal of Education for Business
ISSN: 0883-2323 (Print) 1940-3356 (Online) Journal homepage: http://www.tandfonline.com/loi/vjeb20
Is Grade Inflation Related to Faculty Status?
Boualem Kezim , Susan E. Pariseau & Frances Quinn
To cite this article: Boualem Kezim , Susan E. Pariseau & Frances Quinn (2005) Is Grade Inflation Related to Faculty Status?, Journal of Education for Business, 80:6, 358-364, DOI: 10.3200/JOEB.80.6.358-364
To link to this article: http://dx.doi.org/10.3200/JOEB.80.6.358-364
Published online: 07 Aug 2010.
Submit your article to this journal
Article views: 83
View related articles
n the Chronicle of Higher Education, Kohn (2002) reported charges of grade inflation at Harvard as early as 1894. He cited the Harvard University Report of the Committee on Raising the Standard, 1894, as stating “Grades A and B are sometimes given too readily—Grade A for work of not very high merit, and Grade B for work not far above medioc-rity” (p. B7). Advancing forward over 100 years, in October 2001, the Boston Globeheadlines proclaimed, “Harvard’s Quiet Secret: Rampant Grade Inflation” and “Harvard’s Honors Fall to the Mere-ly Average” (HeaMere-ly, 2001a, 2001b). Healy’s reports (2001a) in the Boston Globe suggested that grade inflation at Harvard was exacerbated by the war in Vietnam and that “inflated grades became the moral equivalent of opposi-tion to the war” (p. A1). Whereas grade inflation seems to be most rampant at Harvard, other elite universities have capped honors. For example, although “91 percent of Harvard seniors graduat-ed with honors in 2001, the honors rate was 51 percent, 44 percent, 42 percent, 40 percent, 25 percent, and 8 percent at Yale, Princeton, Brown, Dartmouth, Columbia, and Cornell,” respectively (Healy, 2001b, p. B1).
In 1966, 22% of Harvard undergradu-ate students received As, and in 1973, 31% of undergraduates at Princeton received As (Ivy League Grade
Infla-tion, 2002). By 1996 and 1997, respec-tively, 46% of Harvard students and 43% of Princeton students received As (Ivy League Grade Inflation, 2002). In 1997, 88% of all grades at Princeton were above B range. Between the 1995–1996 and 1999–2000 school years, Central Michigan University’s examination of grades showed an increase in grade inflation in all academic colleges, except the health professions (Central Michigan University, n.d.).
Arthur Levine, president of the Teach-ers’ College at Columbia University, and Jeanette S. Cureton (1998) compiled results from a national study of
under-graduates at all types of universities. The results of the study showed that grades of A grew from 7% to 26% and grades of C fell from 25% to 9%, respectively, for the years 1969 and 1993.
Rojstaczer’s (2003b) results suggest that grade point averages (GPAs) increased on average by 0.6 from 1967 to 2001. Although both public and pri-vate schools showed trends indicating grade inflation over that 35-year period, the mean GPA at private schools was 0.3 higher than public schools, and the rate of inflation was also 25% to 30% higher at these institutions. Over the past 35 years, GPAs increased by approximately 0.15 per decade. In a previous article by Rojstaczer (2003a), he suggested that the “marketplace mentality,” in which employers, parents, and students all expect higher grades, may be responsi-ble for grade inflation. Parents, in partic-ular, suppose that if they are to pay high costs for education, their students should receive higher grades to obtain better job opportunities.
Several researchers have examined the relationship between grades and sta-tus of college instructors with respect to either tenure or their full-time or adjunct relationship with their institutions. Moore and Trahan (1998) examined the hypothesis that untenured and part-time faculty submit higher grades than tenured faculty. They argued that “since
ABSTRACT.The authors performed a statistical analysis to investigate whether grade inflation existed in the business school at a small private col-lege in the northeast region of the United States. The results showed that grade inflation existed and exhibited a linear trend over a 20-year period. The authors found that grade inflation was related to faculty status with sig-nificant differences seen between mean grade point averages of students being taught by tenured and adjunct faculty and between those students taught by nontenured and adjunct fac-ulty. They also found that average grades given by adjunct faculty were higher than those of either tenured or nontenured faculty. Thus, the results indicate the increased use of adjunct faculty exacerbates grade inflation in higher education.
Is Grade Inflation Related to
Faculty Status?
BOUALEM KEZIM SUSAN E. PARISEAU
FRANCES QUINN
Merrimack College North Andover, MA
I
merit, tenure, and promotion decisions are based on the performance of an instructor in the classroom which is pre-dominately measured by course evalua-tions, the less secure the faculty posi-tion, the greater the benefits of using a grading scale based on low academic standards” (Gohmann & McCrickard, 2001, p. 2). Moore and Trahan sampled 417 introductory courses. These courses were across disciplines and taught by faculty of all ranks. They concluded that untenured faculty and part-time faculty tended to grade higher than tenured fac-ulty. They offered reasons substantially different from those of Rojstaczer (2003a). They concluded that higher grade inflation from adjunct and untenured faculty could result from lack of teaching experience and therefore an inability of the faculty to distinguish grades. They also offered the explana-tion that new teachers are better trained and more motivated, which leads to more effective teaching. Finally, they concluded that untenured faculty may “buy” tenure through higher faculty evaluations, which have a direct correla-tion to higher grades.
Greenwald and Gilmore (1997) simi-larly found that if students are given grades even one standard deviation above, rather than below, the mean, they will increase the instructor’s percentile rank in student ratings by one full stan-dard deviation.
Gohmann and McCrickard (2001) examined two of Moore and Trahan’s (1998) grade inflation relationships: (a) new faculty is less experienced in deter-mining grades and (b) tenure and grade inflation are linked. They examined grade distributions of faculty in a south-ern college school of business during the 8 years from fall 1991 to spring 1998. They concluded that faculty grade better as they gain experience in distinguishing good student performance from poorer performance. Using time series data, they found that untenured faculty actual-ly grade harder over time. Their results showed that untenured faculty members raise their grading standards as they approach tenure, which supports the notion that faculty start off grading leniently, but gradually grade harder as they gain experience. Their results do not, however, support the hypothesis that
untenured faculty give higher grades to receive better evaluation results.
Sonner (2000) conducted a study over a 2-year period at a small public university where approximately 70% of the courses are taught by part-time fac-ulty. Initial analyses indicated that class size, subject, and class level were fac-tors related to average class grades. After controlling for these factors using analysis of covariance (ANCOVA), Sonner found that average grades given by adjunct instructors were still signifi-cantly higher than average grades given by full-time faculty. Sonner suggested that it was reasonable to conclude that adjunct faculty is reluctant to give lower grades that might result in student com-plaints and failure to be rehired in sub-sequent quarters.
During the period from 1980–1999, Eiszler (2002) studied 983,491 students in over 37,000 sections at a mid-sized public university in the midwestern United States. The number of students expecting to receive grades of A and A-was mostly stable during the 1980s but increased during the 1990s with 47% of the students reporting expectations of A or A- in spring 1999. He found a similar pattern in examining ratings of teach-ing. Eiszler found the correlation between expected grades and teaching ratings to be statistically significant. At this public university, a new president was hired in 1992 and established the principle of the “student as a customer” (Eiszler, p. 499). Although the faculty was encouraged to provide multiple indicators of teaching effectiveness, stu-dent ratings were considered to be the primary basis for evaluation. Thus, there is some evidence that the grade inflation found at the university was driven by the extensive use of student evaluations of teaching in the reappointment, tenure, and promotion process.
METHOD
In this study, we examined the GPAs of business students at a small private undergraduate college in the northeast region of the United States over a 20-year period from fall 1983 through spring 2003. During fall 1983, approxi-mately 44% of the students enrolled at the college were studying business
administration. In spring 2003, approxi-mately 39% were enrolled in business. The ratio of students by gender remained fairly stationary with male students representing 57% of the popu-lation in 1983 and 56% in 2003. During spring 2003, the ethnicity of more than 93% of the students was classified as Caucasian or unknown. Most of the stu-dents enrolled at the institution were of traditional college age (i.e., they enrolled at the college immediately fol-lowing high school).
During the 20-year period from 1983–2003, 29% of business adminis-tration courses at the college we studied were taught by adjunct professors. The percentages ranged from a low of 23% in 1988–1989 to a high of 41% in 1999–2000. Three of the highest four percentages occurred during the last 4 years of the study. The increasing use of adjunct professors is endemic in higher education today. A Yale study conclud-ed that “full-time tenure-track faculty taught only 30 percent of Yale’s classes, while adjunct instructors and graduate students taught the other 70 percent” (Arenson, 1999, p. B4). A 2004 report in Business Week concluded that “B-schools are relying more on adjuncts with fewer students getting doctorates in business and fewer of those choosing to teach” (Chambers, 2004, p. 94).
We performed a statistical analysis to investigate whether the widely reported grade inflation existed at the institution we studied and to test whether there were differences in mean GPAs among students of adjunct, untenured, and tenured faculty.
RESULTS
We examined the grade distributions for all classes, both introductory and advanced, taught in the business school at the college over a 20-year period from fall 1983 to spring 2003. The data consisted of the grades recorded for any faculty member employed during that period of time. We grouped the faculty members into three categories: (a) adjuncts, (b) nontenured, and (c) tenured. This partition allowed us to compare the mean GPAs of students taught by faculty among the three cate-gories, and we used it to investigate how
grade inflation varied among them. We attempted to answer the following ques-tions: (a) Does the adjunct faculty have a tendency to inflate grades in an effort to retain positions as suggested by Son-ner (2000)? (b) Does the nontenured faculty inflate grades to help secure tenure and promotions as suggested by Eiszler (2002)? To respond to these questions, we first performed an analy-sis of variance (ANOVA) to determine whether there were significant differ-ences in mean GPAs for students taught by the three categories of faculty. Next, to measure the difference in the mean GPAs given among these groups, we performed a multiple regression analy-sis. Moreover, we performed a paired t test to determine whether differences existed in the mean GPAs given by fac-ulty before and after tenure.
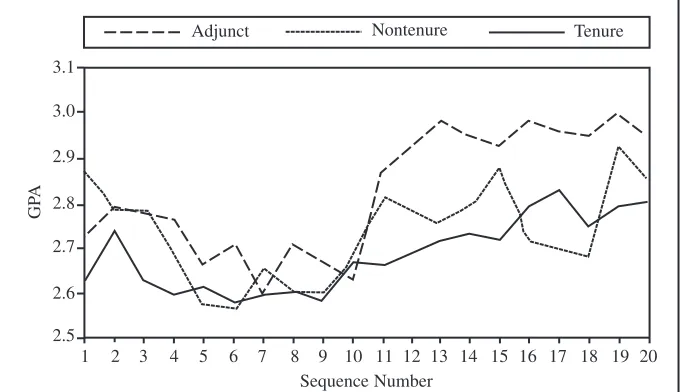
Figure 1 shows plots of GPAs of stu-dents taught by adjunct, nontenured, and tenured faculty over the 20-year period from fall 1983 through spring 2003. An examination of these plots reveals differ-ences among the mean GPAs of students taught by the three faculty groups. Over-all, and for the majority of years, the mean GPAs of students taught by adjunct faculty are higher than those taught by either the tenured or non-tenured faculty. Clearly, beginning with the academic year 1993–1994, the mean GPAs of students taught by adjunct fac-ulty are consistently higher than those of students taught by the others. During that same period of time, the variability increased radically.
ANOVA: Differences Among Faculty
To determine whether the difference in the mean GPAs we observed (see Fig-ure 1) was statistically significant, we performed a one-way ANOVA. Table 1 shows the descriptive statistics of the GPAs of students taught by the three faculty categories and Table 2 contains a summary of the ANOVA results, which indicate clear evidence of significant differences between at least two classi-fications of faculty.
The Levene test results (p = .003) indicate that the assumption of homo-geneity of variances is violated. We used the Tamhane test, which is
appro-priately used when variances cannot be assumed equal, to perform a post hoc pairwise comparison to determine which means differed significantly. As Table 3 shows, we found statistically
significant differences between adjunct and tenured faculty and, to a lesser extent, between adjunct and nontenured faculty. Differences in mean GPAs between students taught by tenured
fac-FIGURE 1. Mean grade point averages (GPAs) by faculty classification and year.
3.1
3.0
2.9
2.8
2.7
2.6
2.5
1 2 3 4 5 6 7 8 9 10 11 12 13 14 15 16 17 18 19 20
Adjunct Nontenure Tenure
GP
A
Sequence Number
TABLE 1. Descriptive Statistics of Grade Point Averages by Faculty Category
Category Sample size M SD
Adjunct 20 2.8268 0.1366
Nontenured 20 2.7363 0.1066
Tenured 20 2.6872 0.0816
Total 60 2.7501 0.1233
TABLE 2. ANOVA Results of Grade Point Averages by Faculty Category
Source Sum of squares df MS F p
Between groups 0.201 2 0.100 8.209 .001 Within groups 0.697 57 0.012
Total 0.898 59
TABLE 3. Post Hoc Comparison
Factor Mean difference SE p
Adjunct compared with nontenured 0.0925 0.0387 .074 Adjunct compared with tenured 0.1397 0.0356 .001 Nontenured compared with tenured 0.0491 0.0300 .297
ulty and those taught by nontenured fac-ulty were not significant.
Multiple Regression: Trend and Status
Next, to measure the difference in the mean GPAs among these groups, we developed a multiple regression model for the GPAs, incorporating trend with dummy variables to account for the three categories of faculty classification. The multiple regression model was defined as follows:
Model 1:GPA= β0 + β1 year+ β2 adj+
β3NT+ ε,
where GPA= grade point average; year= the year of the study, 1–20; adj = 1 if adjunct professors, and 0 otherwise; and NT= 1 if nontenured, 0 otherwise. The variable tenuredwas the reference group. We assumed the error terms to be inde-pendent and identically normally distrib-uted with mean zero and variance σ2.
The fitted model we obtained was: E(GPA) = 2.569 + 0.0113 year + 0.140 adj + 0.049NT, with R2 = .507 and an adjusted R2 = .48. Table 4 shows the estimated coefficients we obtained with the regression model.
All the coefficients, with the exception of the nontenured variable, were highly significant and it appeared that we had a good fit. A significant positive coefficient on the variable yearindicated the mean GPAs did increase at a rate of 0.0113 points (on a 4-point scale) for each year over the study period. The coefficient on the variable adj was also significant, inducing that there was a significant mean difference between the adjunct variable and the tenuredvariable. On the one hand, the GPAs for students graded by adjunct faculty were higher, on aver-age, by 0.140 points. On the other hand, the mean difference between nontenured and tenured faculty had weak statistical significance. The GPAs for students graded by nontenured faculty were high-er, on average, by 0.049 points.
DISCUSSION
Multiple Regression: Trend, Status, and Autocorrelated Errors
Because data collected over time are often found to exhibit autocorrelations
among the observations, we used the Durbin-Watson (DW) test to determine if serial correlation was present. The value of the Durbin-Watson statistic was 0.891, clearly indicating positive serial correlation among the residuals. Because DW = 0.891 < 1.00 = DW lower bound with three independent variables, we concluded that the residu-als were positively correlated at the 5% level of significance. Furthermore, a plot of the residuals clearly exhibited a known pattern of clusters of residuals with the same sign, thus illustrating the presence of positive serial correlation. Therefore, the assumption of uncorre-lated errors in the regression model was violated. This definitively invalidated the inferences (tand p) we made using the usual assumption of independent error terms. Moreover, a plot of the residual autocorrelations for the first 16 lags showed dependence among the error terms with a Ljung-Box statistic equal to 70.061 (p= 0.000). The results of this test supported our findings and, thus, we concluded that the residuals could not be considered as white noise. The first step in correcting the model was to replace the presumed independent errors in the regression model for GPAs with a possibly dependent series of noise terms,ut,t= 1, 2, …,n. An analysis of the
residual autocorrelations and partial auto-correlations indicated that residuals could be modeled using an autoregressive model of order one,ut = φut-1 + εt,t= 1, 2, …,n. We developed the following multi-ple regression model, which incorporated autocorrelated errors:
Model 2:GPA= β0 + β1 year+ β2 adj+
β3NT+ u,
where the random variable ufollows an autoregressive process of order one. A SAS program (version 8.01, SAS Insti-tute, Cary, NC) generated the results we present in Table 5.
The multiple regression analysis pro-vided evidence that, overall, GPAs sig-nificantly increased at a rate of 0.0075 per year over the period from fall 1983 through spring 2003. Although using the model incorporating autocorrelated errors (Model 2) provided results simi-lar to the first multiple regression analy-sis we presented (Model 1), the values of the estimates and their respective t values have been affected by incorporat-ing an autocorrelation parameter among the error terms. In Model 2, all the coef-ficients were significant except non-tenured. This implies that there was no significant difference in the average GPAs of students graded by nontenured and tenured faculty. In Model 1, we
TABLE 4. Least Squares Estimates
Variable Coefficient t(56) p
Constant 2.569 89.054 .000
Year 0.0113 5.671 .000
Adjunct 0.140 4.967 .000
Nontenured 0.049 1.7460 .086
TABLE 5. Maximum Likelihood Estimates
Variable Estimate SE t(55)
Constant 2.6097 0.04414 59.12**
Year 0.0075 0.00265 2.84**
Adjunct 0.1136 0.05656 2.01*
Nontenured 0.0738 0.04998 1.48
Autoregressive parameter 0.6354 0.10356 6.14**
*p= .05. **p= .01.
observed mild significance (p= 0.086) between these two faculty classifica-tions. The annual rate of increase in GPAs found in Model 2 (0.0075) was less than the annual increase found in Model 1 (0.0113), a decrease of 34%. The difference in mean GPAs of stu-dents of adjunct faculty and those of tenured faculty decreased to 0.1136 in Model 2 from 0.140 in Model 1, a decrease of approximately 19%. Clear-ly, the addition of the autoregressive parameter had changed the coefficients and provided evidence that the change in average GPAs resulting from trend and from faculty classification was less than initially suspected.
The autoregressive parameter has an estimated value of 0.6354 with a highly significant t value, t(55) = 6.14. As expected, this indicated a moderate autocorrelation among the observations. The autocorrelations of the residuals from Model 2 were all negligible. The p value for the Ljung-Box statistic, defined as a weighted sum of squares of residual autocorrelations for a group of consecutive lags, was not significant. This provided evidence that the errors were white noise and supported the use of the multiple regression model with autocorrelated errors (Model 2).
Paired tTest: Before and After Tenure
To determine whether grades given by faculty were higher before tenure, we examined the mean student GPAs by year for all faculty teaching at the col-lege during the period of study who met the following criteria: (a) were awarded tenure during the 20-year period, (b) were at the college 5 years before gain-ing tenure and these 5 years occurred during the period of study, and (c) were at the college 5 years after gaining tenure and these 5 years occurred during the period of study. Joint use of these three criteria resulted in a sample size of seven. Figure 2 shows the mean GPAs of the seven professors for the 5 years before and after tenure. The graph shows that for two faculty members, the aver-ages were lower after tenure with the remaining faculty showing increases in average GPAs of their students. Overall, the mean GPAs of students graded by
faculty before and after tenure appeared similar. We did, however, notice an upward trend in GPAs for students who were graded by professors both before and after the faculty members were appointed tenure. This is interesting because the faculty have been ordered according to the year in which they were awarded tenure. During the 20-year time period, Professor 1 was the first to receive tenure; Professor 7 was the last. This provides some additional evidence of grade inflation over time because the first faculty member awarded tenure tended to grade lower than the last.
A paired ttest (Table 6) showed that, according to student GPAs, there was no significant difference in the way professors graded before and after receiving tenure. This corroborated our visual inspection of the graph shown in Figure 2.
Conclusion
An examination of grades in business administration courses at this small
pri-vate undergraduate institution revealed that the percentage of grades in the A category (A and A-) did not indicate the same dramatic climb as seen in the Ivy League universities. During the 1st year of our study (1983–1984), 23.6% of the grades were in the A category and 24.3% were in the C category (C-, C, C+). Dur-ing the final year of the study (2002–2003), the percentages of As and Cs were 26.4 and 20.9, respectively. The percentage of A category grades (26.4%) was far less than the 47% reported by Eiszler (2002) in a 1999 study of a mid-sized public university in the midwest-ern United States. A grade of C was far more prevalent (20.9%) than the 9% reported by Levine and Cureton (1998) in a 1993 study of higher education.
Rojstaczer (2003b) reported a GPA increase of 0.15 per decade, whereas, using our multiple regression analysis (Model 2), incorporating autoregressive errors, we found an increase of only 0.075 per decade. At the same time, using Model 1, which incorrectly assumed independent error terms, we
FIGURE 2. Plot of grade point averages (GPAs) by professor before and after tenure.
3.5
3
2.5
2
1.5
1
0.5
1 2 3 4 5 6 7
Before Tenure After Tenure
GP
A
Individual Professor 0
TABLE 6. Paired Two Samples Test for Means
Status Years M SE t(6) p
Before tenure 5 2.5991 0.2494 –1.0987 .3140 After tenure 5 2.6923 0.2883
found an increase of 0.113 per decade. Although the results yielded by our incorrectly stated model were closer to those reported by Rojstaczer, our cor-rected results showed less inflation.
Moore and Trahan (1998) concluded that the grades given by both untenured and part-time faculty tended to be high-er than those given by tenured faculty for introductory courses. However, our study, which included grades for both introductory and advanced courses, negated the conclusion with respect to the nontenured faculty, it supported the conclusion regarding the adjunct facul-ty. In Model 2, the coefficient for adjunct was significant with an increase of 0.1136 over the mean GPA of stu-dents graded by tenured faculty.
One of the explanations offered by Moore and Trahan (1998) was that untenured faculty may “buy tenure” by giving higher grades. From our paired t test results, comparing the mean GPAs of students taught by individual faculty both before and after tenure, we found no difference in mean GPAs. This finding offers additional support for the lack of significance of the non-tenure parameter in our model incor-porating autoregressive error terms (Model 2) and provides additional evi-dence for disagreement with the hypothesis that untenured faculty may buy tenure. Thus, our findings support those of Gohmann and McCrickard (2001).
In a study conducted over a 2-year period at a small public university where approximately 70% of the courses were taught by part-time faculty, the author found that the grades of students taught by adjunct professors were higher (Son-ner 2000). In our study, conducted over a 20-year period, we came to the same conclusion for a small private institution where only 29% of the courses were taught by adjunct professors. Sonner demonstrated that a relationship exists
between grades and faculty status using ANCOVA, whereas, in our study, we quantified the relationship using a multi-ple regression model incorporating auto-correlated errors.
Eiszler (2002) found positive correla-tion between expected grades and teach-ing evaluations and surmised that exten-sive use of student evaluations of teaching in the reappointment process could lead to grade inflation. This, and the argument proposed by both Moore and Trahan (1998) and Sonner (2000), stating that less secure faculty reap more benefits from giving high grades, may be supported by our findings. The adjunct faculty members have the least secure positions in the academic envi-ronment and so, to maintain their posi-tions, they may inflate grades to obtain higher teaching evaluations.
Despite the call for increased rigor and differentiation in the grading process, an increase in the proportion of courses taught by adjunct faculty may contribute to increased grade inflation in higher education. Our 20-year study showed a significant increase in stu-dents’ GPAs at a rate of 0.0075 per year for all faculty classifications. The mean GPAs for students of adjunct faculty were 0.1136 points (on a 4-point scale) higher than the mean GPAs of students of tenured faculty. Thus, an increase in the proportion of courses taught by adjunct faculty will result in additional grade inflation.
Limitations and Future Research
Generalization of the results of this study is limited because of the use of data from one business school at a small private undergraduate college in the northeast region of the United States with a homogeneous student population with respect to age, ethnicity, and domi-cile. However, we provided a methodol-ogy that may be used by others in the
study of institutions with greater diver-sity in their demographics.
NOTE
For further information, please direct correspon-dence to: Susan E. Pariseau, Merrimack College, Girard School of Business and International Com-merce, 315 Turnpike Street, North Andover, MA 01845, susan.pariseau@merrimack.edu.
REFERENCES
Arenson, K. W. (1999, March 30). Staff on tenure track is teaching less at Yale, a study says. The New York Times, p. B4.
Central Michigan University Office of Institution-al Research and Planning (n.d.). An examina-tion of grades assigned Central Michigan Uni-versity’s undergraduate students. Mt. Pleasant, MI: Author.
Chambers, E. (2004, October 18). Too much of a good thing: Adjunct faculty are hot. But B-schools may be going overboard. Business Week,394, 94.
Eiszler, C. F. (2002). College students’ evaluations of teaching and grade inflation. Research in Higher Education, 43(4), 483–501.
Gohmann, S. F., & McCrickard, M. J. (2001, Fall). Tenure status and grade inflation: A time series approach. Journal of the Academy of Business Education, 2, 1–8.
Greenwald, A. G., & Gilmore, G. M. (1997). Grading leniency is a removable contaminant of student ratings. American Psychologist, 52, 1209–1217.
Healy, P. (2001a, October 7). Harvard’s quiet secret: Rampant grade inflation. The Boston Globe, p. A1.
Healy, P. (2001b, October 8). Harvard’s honors fall to the merely average. The Boston Globe, p. B1.
Ivy League Grade Inflation. (2002, February 7). USA Today.Retrieved February 24, 2004, from http://www.usatoday.com
Kohn, A. (2002, November 8). The dangerous myth of grade inflation. Chronicle of Higher Education, p. B7.
Levine, A., & Cureton, J. S. (1998). When hope and fear collide: A portrait of today’s college student. San Francisco: Jossey-Bass.
Moore, M., & Trahan, R. (1998). Tenure status and grading practices. Sociological Perspec-tives, 41(4), 775–781.
Rojstaczer, S. (2003a, January 28). Where all grades are above average. Washington Post, p. A21.
Rojstaczer, S. (2003b, March 17). Grade inflation at American colleges and universities. Retrieved February 24, 2004, from http://www. gradeinflation.com
Sonner, B. S. (2000). A is for ‘adjunct’: Examin-ing grade inflation in higher education. Journal of Education for Business, 76, 5–8.