Prediction of Jamar Grip Strength Value Using Modified Aneroid
Spyhgmomanometer Cuff Method
Lusia Pujianita, Tertianto Prabowo, Marietta Shanti Prananta
Department of Physical Medicine and Rehabilitation, Faculty of Medicine, Universitas Padjajaran-Dr. Hasan Sadikin General Hospital
Abstract Objective: To examine the prediction of Jamar grip strength value by using aneroid sphygmomanometer cuff method in adults.
Methods: This study involved 120 subjects, aged 20–59 years old. The grip strength of subjects were measured using Jamar dynamometer and aneroid sphygmomanometer cuff method. Spearman analysis was used to evaluate the correlation between variables and grip strength. Forward stepwise was used to analyze the regression of Jamar dynamometer using aneroid sphygmomanometer cuff method.
Results: There was a weak correlation (r<0.4) between grip strength with age and BMI, moderate correlation (r = 0.4–0.6) for grip circumference, and also strong correlation r= (0.6–0.8) for sex, hand length, and hand width. Jamar grip strength value can be predicted using spyghmomanometer with the formula of (0.1157 x Sphygmomanometer grip strength value) – (5.696 x sex) + (0.0824 x age) (female =1, male= 0).
Conclusions: Grip strength correlates with physiological variables. The variables to predict Jamar grip strength using sphygmomanometer are sex and age. Regression analysis shows that spyhgmomanometer can be used as an alternative to measure grip strength and has a valid value to predict the Jamar grip strength value.
Keywords: Adult, grip strength, Jamar dynamometer, sphygmomanometer, prediction formula
pISSN: 2302-1381; eISSN: 2338-4506; http://doi.org/10.15850/ijihs.v5n1.958 IJIHS. 2017;5(1):1–7
Received: May 31, 2016
Revised:
October 18, 2016
Accepted: February 27, 2017
Correspondence:
Lusia Pujianita, Department of Physical Medicine and Rehabilitation, Faculty of Medicine, Universitas Padjajaran-Dr. Hasan Sadikin General Hospital Jl. Pasteur No. 38, Bandung, Indonesia e-mail: [email protected]
Introduction
Grip strength value is an important parameter to evaluate the management procedure of hand region, monitor the progression of hand disability, set up the realistic targets for a rehabilitation program, and also to evaluate the ability to return to work.1 Grip strength
is also used to predict the total muscle strength in healthy children, adolescents, and young adults.2 Clinical and epidemiological
studies have shown the potential use of grip strength as one of the predictors of mortality
and morbidity of several systemic diseases. Patients with grip strength disturbance have higher postoperative complications, longer duration of hospitalization, and also a higher rate of rehospitalization.3 Grip strength is a physiological variable influenced by age, sex,
and anthropometry.4
Previous studies have proven that there is an association between the grip strength and various anthropometry dimensions.4–6 A study
of anthropometry between Indonesian and
Singaporean population showed significant
mean differences. Geographical origin affects variations of anthropometry. This has been
confirmed by reports from another research
in Turkish population. Geographical region
has a significant effect on stature and weight
of the Turkish population. Another factor
socioeconomic factor. Higher socioeconomic status implies higher income and is associated with better education, resulting in better nutrition, better child care, and better medical and social services.7
The association between grip strength and anthropometry in some countries has shown variations in results. The normative value or prediction formula in one population should not be used in other population. A study on grip strength normative value in Netherlands found that body weight and height have no
significant association with grip strength, but sex has significant association.8 Another study
in Australia presents a different result as it is
able to discover the presence of association between grip strength and body mass index; however, their normative value is lower than that of the international literature.9
The standard instrument to measure grip strength worldwide is Jamar dynamometer.10
However, Jamar is rarely found in developing countries such as Indonesia. This instrument may be unsuitable for some people due to its weight and rigidity. There is a need for an alternative instrument to measure the grip strength. The aneroid sphygmomanometer had the potential to be used as an alternative instrument to measure grip strength.4 This
instrument is cheaper and readily available in
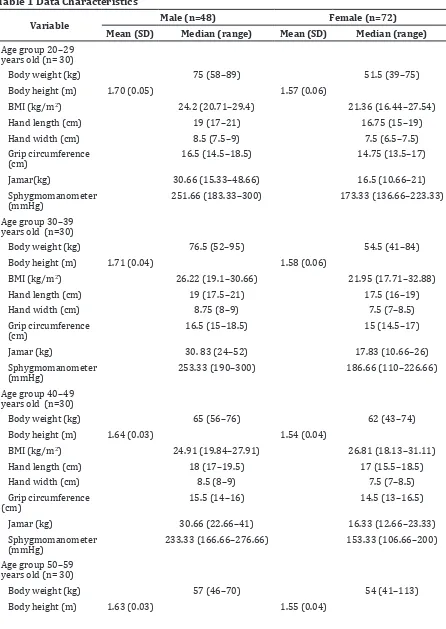
Table 1 Data Characteristics
Variable Male (n=48) Female (n=72)
Mean (SD) Median (range) Mean (SD) Median (range)
Age group 20–29 years old (n= 30)
Body weight (kg) 75 (58–89) 51.5 (39–75)
Body height (m) 1.70 (0.05) 1.57 (0.06)
BMI (kg/m2) 24.2 (20.71–29.4) 21.36 (16.44–27.54)
Hand length (cm) 19 (17–21) 16.75 (15–19)
Hand width (cm) 8.5 (7.5–9) 7.5 (6.5–7.5)
Grip circumference (cm)
16.5 (14.5–18.5) 14.75 (13.5–17)
Jamar(kg) 30.66 (15.33–48.66) 16.5 (10.66–21)
Sphygmomanometer (mmHg)
251.66 (183.33–300) 173.33 (136.66–223.33)
Age group 30–39 years old (n=30)
Body weight (kg) 76.5 (52–95) 54.5 (41–84)
Body height (m) 1.71 (0.04) 1.58 (0.06)
BMI (kg/m2) 26.22 (19.1–30.66) 21.95 (17.71–32.88)
Hand length (cm) 19 (17.5–21) 17.5 (16–19)
Hand width (cm) 8.75 (8–9) 7.5 (7–8.5)
Grip circumference (cm)
16.5 (15–18.5) 15 (14.5–17)
Jamar (kg) 30. 83 (24–52) 17.83 (10.66–26)
Sphygmomanometer (mmHg)
253.33 (190–300) 186.66 (110–226.66)
Age group 40–49 years old (n=30)
Body weight (kg) 65 (56–76) 62 (43–74)
Body height (m) 1.64 (0.03) 1.54 (0.04)
BMI (kg/m2) 24.91 (19.84–27.91) 26.81 (18.13–31.11)
Hand length (cm) 18 (17–19.5) 17 (15.5–18.5)
Hand width (cm) 8.5 (8–9) 7.5 (7–8.5)
Grip circumference (cm)
15.5 (14–16) 14.5 (13–16.5)
Jamar (kg) 30.66 (22.66–41) 16.33 (12.66–23.33)
Sphygmomanometer (mmHg)
233.33 (166.66–276.66) 153.33 (106.66–200)
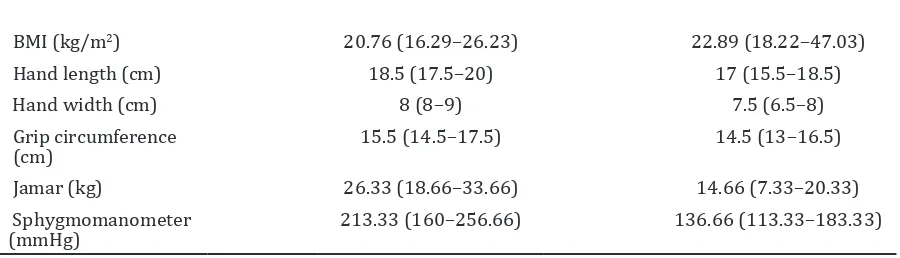
Age group 50–59 years old (n= 30)
Body weight (kg) 57 (46–70) 54 (41–113)
BMI (kg/m2) 20.76 (16.29–26.23) 22.89 (18.22–47.03)
Hand length (cm) 18.5 (17.5–20) 17 (15.5–18.5)
Hand width (cm) 8 (8–9) 7.5 (6.5–8)
Grip circumference (cm)
15.5 (14.5–17.5) 14.5 (13–16.5)
Jamar (kg) 26.33 (18.66–33.66) 14.66 (7.33–20.33)
Sphygmomanometer (mmHg)
213.33 (160–256.66) 136.66 (113.33–183.33)
all health facilities. This instrument also has an accuracy that is equivalent with the mercury sphygmomanometer.11 Sphygmomanometer
has softer surface and it is lighter than Jamar dynamometer. It is also more comfortable to be used by individuals with hand disability, such as rheumatoid arthritis, or those who are in the recovery phase of a post-hand injury.
The grip measurement that is performed using sphygmomanometer will require some
adaptation. Unmodified sphygmomanometer can cause difficulties in grip stabilization and change in diameter during inflation.
Cuff method needs to be simple with quick preparation.12 This method is suitable for
everyday use because it does not require a dedicated sphygmomanometer as it still can be used for blood pressure measurement.
Hamilton et al.13 discovered that the use
of sphygmomanometer for measuring grip strength is valid. This study also produced a prediction formula of Jamar grip strength value using sphygmomanoter in young women (25–39 years old).
There is currently no study on Jamar grip strength value using sphygmomanometer for
all adult population (20–59 years old) yet. The prediction formula from Hamilton study does not account the age, sex, and anthropometry. This study aimed to discover the predictability
of Jamar grip strength value using a modified
sphygmomanometer cuff method in adults aged 20–59 years old.
Methods
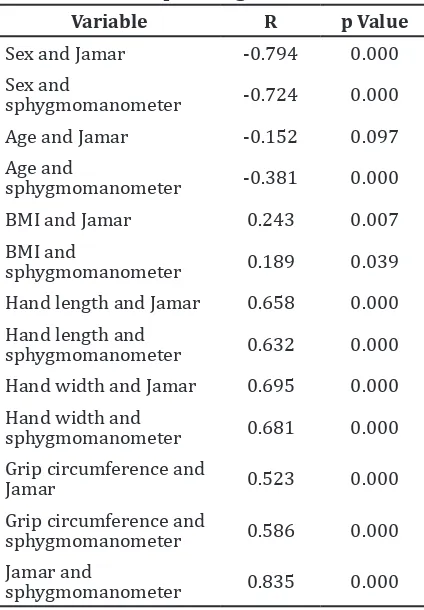
Variable R p Value
Sex and Jamar -0.794 0.000
Sex and
sphygmomanometer -0.724 0.000
Age and Jamar -0.152 0.097
Age and
sphygmomanometer -0.381 0.000
BMI and Jamar 0.243 0.007
BMI and
sphygmomanometer 0.189 0.039
Hand length and Jamar 0.658 0.000
Hand length and
sphygmomanometer 0.632 0.000
Hand width and Jamar 0.695 0.000
Hand width and
sphygmomanometer 0.681 0.000
Grip circumference and
Jamar 0.523 0.000
Grip circumference and
sphygmomanometer 0.586 0.000
Jamar and
sphygmomanometer 0.835 0.000
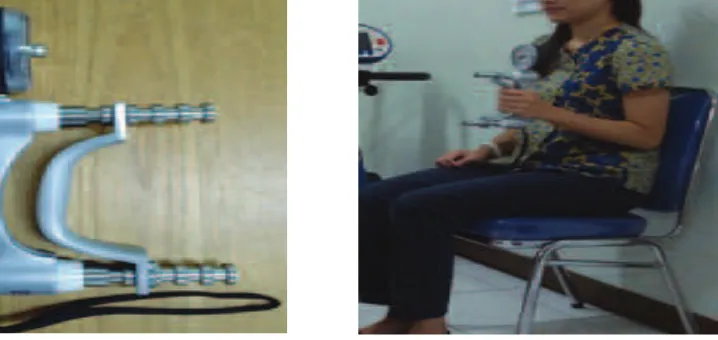
The grip strength measurement used Jamar dynamometer and sphygmomanometer aneroid. Jamar dynamometer has 5 handle positions, and the second handle position was used for all subjects.14
The adaptation used for shygmomanometer
aneroid is the cuff method. The inflatable
part was folded into four equal parts and the remainder part of the cuff was wrapped around
the inflatable part and fixed with a Velcro cuff. The sphygmomanometer was inflated to 100
mm Hg and its valve was kept closed to remove
the folds from the inflatable portion. Then, the
pressure was reduced to 20 mm Hg, and the valve was closed again to prevent leakage.
Subject’s identity, age, and sex data were collected. Each participant was measured for body weight, body height, hand width, hand length, hand grip circumference, and hand grip strength. The hand width was measured from ulnar part of distal palmar crease to radial part. Hand length was measured from distal wrist
crease to the tip of middle finger. Hand grip
circumference was measured by gripping the cone where the tip of the thumb and middle
finger met, then the cone circumference was
measured.
Examination position during grip strength measurement was in accordance with the rules of the American Society of Hand Therapists (ASHT). This testing position is described as sitting in a straight-backed chair with the feet
flat on the floor, the shoulder adducted and neutrally rotated, elbow flexed at 900, forearm
in a neutral position, and, in all cases, the arm should not be supported by the examiner or by an armrest. The grip strength measurement using dynamometer is presented vertically and in line with the forearm to maintain the standard forearm and wrist positions.
Participants were asked to grip up to 3 seconds using the dominant hand with 3 times repetition and a minute rest between the grips. All participants were measured using Jamar
dynamometer first, then sphygmomanometer
aneroid cuff method.
Spearman’s correlation test was used to understand the relationship between the two instruments and between the hand grip with anthropometry factor. The analysis was continued with linear regression.
Results
There were 120 participants (48 males and 72 females). The normality test using Shapiro Wilk shows that only body height that had normal distribution (Table 1). Adult’s hand grip reached the peak value in age group 30–39 years old, and decreased after 40 years old, both in males and females (Fig. 3). Correlations between the two instruments and others variables were tested using Spearman
Correlation test and a confidence interval of
95% is listed (Table 2)
Age and Jamar do not show any significant
correlation, whereas others variables had
significant correlations with both Jamar and
sphygmomanometer. Age and BMI had a weak correlation with the grip strength (r<0.4). The moderate correlation (r=0.4–0.599) was between grip circumference and grip strength. The strong correlation (r=0.6–0.799) was between sex, hand length, hand width and grip strength. The strongest correlation (r>0.8) was found between grip strength by Jamar and sphygmomanometer.
The regression analysis was performed using the forward stepwise method. The
Variables that are accounted into the regression
were grip strength, sex, and age. The hand length, hand width, and grip circumference have had correlation with sex already. They are not accounted to regression analysis to
avoid the autocorrelation. During the analysis, there were 4 outliers found. After excluding the outliers from the regression analysis, the
regression coefficient for Jamar grip strength
was calculated (Table 3).
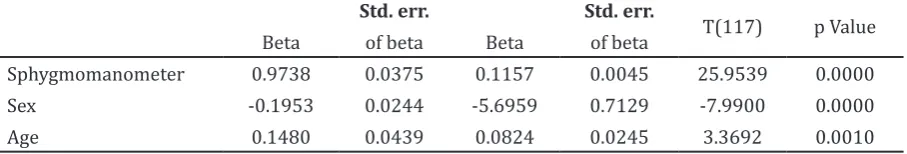
The variables had a significant regression coefficient towards Jamar grip strength with
a prediction value of R = 0.986. This residue of prediction was tested, producing a mean of = 0.015 and SD 3.79 (Table 3). T test for the residu presented a t count = 0.43 (p>0.05). This means that the mean of residu = 0. The normality test with Shapiro Wilk produced W = 0.977 (p=0.346), which presented a normal distribution of the residu.
Based on the residu testing, this prediction was valid to predict Jamar grip strength of dominant hand using sphygmomanometer in West Java adult population. The formula is Jamar grip strength value using sphygmomanometer = (0.1157 x sphygmomanometer grip strength value) – (5.696 x sex) + (0.0824 x age). (constanta for sex : 1 for female, 0 for male).
Discussion
Grip strength reaches its peak value in the age group of 30–39 years old and decreases after 40 years old. This result corresponds with previous studies in Australia, Netherland, and England.8,915Previous study involved
participants aged 20–34 years old, making the description of association between grip strength and age does not represent all adult
population. This study involves a wider range of age and found a weak correlation between grip strength and age. This weak correlation is
caused by insignificant muscle mass reduction
that happens with age. The muscle mass is started to reduce during the middle age and is
significantly reduced after 60 years old.16,17
Sex has a strong correlation with grip strength. Males has a higher grip strength compared to females. Male and female grip strength is almost equal before puberty. The increased testosterone level during puberty leads to hypertrophy that would cause the male strength quickly rise after puberty. This study also found that hand width, hand length, and grip circumference in males are larger than in females. The larger muscle mass will lead to larger muscle strength.9,15
The highest correlation was found between Jamar grip strength and sphygmomanometer
with a correlation coefficient of 0.835. This
supports the prediction of Jamar grip strength value using the sphygmomanometer. A
modified sphygmomanometer can potentially
be used in daily clinical practice, due to its portability, lower price, and softer surface, making it more comfortable to grip.12,13
This study has produced the a formula to predict the Jamar grip strength value using sphygmomanometer in adult. Based on the statistical analysis, this formula is valid to be used in adults in West Java population. Further research is needed to learn whether the prediction formula can be used in the population of people with disability and larger healty adult population.
Table 3 Regression Coefficient for Jamar Grip Strength
Std. err. Std. err.
T(117) p Value
Beta of beta Beta of beta
Sphygmomanometer 0.9738 0.0375 0.1157 0.0045 25.9539 0.0000
Sex -0.1953 0.0244 -5.6959 0.7129 -7.9900 0.0000
Age 0.1480 0.0439 0.0824 0.0245 3.3692 0.0010
3. Norman K, Stobaus N, Gonzalez C, Schulzke J-D. Hand grip strength: outcome predictor and marker of nutritional status. Clin Nutr J. 2010;30(2):135–42.
4. Chandrasekaran B, Ghosh A, Prasad C, Krishnan K, Chandrasharma B. Age and anthropometric traits predict hand grip strength in healthy normals. J Hand Microsurg. 2010;2(2):58–61. 5. Koley S, Yadav MK. An association of hand grip
strength with some anthropometric variables in Indian cricket players. Physical Education Sport. 2009;7(2):113–23.
6. Fallahi AA, Jadidian AA. The effect of hand dimensions, hand shape and some anthropometric characteristics on handgrip strength in male grip athletes and non-athletes. J Hum Kinet. 2011;29(2):151–9.
7. Chuan TK, Hartono M, N K. Anthropometry of the Singaporean and Indonesian population. Int J Industr Ergonom. 2010;40(6):757–66.
8. Peters MJ, Nes SIv, Vanhoutte EK, Bakkers
M, Doorn PAv, Merkiers IS, et al. Revised normative value for grip strength with the jamar dynamometer. J Peripher Nerv Syst. 2011;16(1):47–50.
9. Massy-Westropp NM, Gill TK, Taylor AW, Bohannon RW, Hill CL. Hand grip strength:
age and gender stratified normative data in
a population based study. BMC Res Notes [serial on the internet]. 2011 Apr [cited 2016 Jun 12];4(127):[about 5p.]. Available from: https://www.ncbi.nlm.nih.gov/pmc/articles/ PMC3101655/.
10. Roberts HC, Denson HJ, Martin HJ, Patel HP, Syddall H, Cooper C, et al. A review of the
measurement of grip strength in clinical and epidemiological studies towards a standardised approach. Age Ageing. 2011;40(4):1–7.
11. Ma Y, Temprosa M, Fowler S, Prineas RJ, Montez MG, Friday JB, et al. Evaluating the accuracy of an aneroid sphygmomanometer in a clinical trial setting. Am J Hypertens. 2009;22(3):263– 6.
12. Souza LA, Martins JC, Moura JB, Salmela
LFT, Paula FVD, Faria CD. Assessment of muscular strength with the modified
spyhgmomanometer test: what is the best method and source of outcome values? Braz J Phys Ther. 2014;18(2):191–200.
13. Hamilton GF, McDonald C, Chenier TC. Measurement of grip strength: validity and reliability of the sphygmomanometer and jamar grip dynamometer. J Orthop Sports Phys Ther. 1992;16(5):215–9.
14. Trampish, Franke J, Jedamzik N, Hinrichs T, Platen P. Optimal jamar dynamometer handle position to assess maximal isometric hand grip strength in epidemiological studies. J Hand Surg Am. 2012;37(11):2368–73.
15. Dodds RM, Syddall HE, Cooper R, Benzeval M, Deary IJ, Dennison EM. Grip strength across the life course: normative data from twelve british studies. Plos One. 2014;9(12):1–15.
16. Palmio J, Udd B. Borderlines between sarcopenia and mild late-onset muscle disease. Frontiers Aging Neurosci. 2014;6(2):267–72. 17. Yahin A, Moeliono MA, Prananta MS. Handgrip