www.elsevier.com / locate / livprodsci
The heritability of degenerative joint disease in the distal tarsal
joints in Icelandic horses
a ,
*
´
b c d´
¨
´
Sigrı
)
ur Bjornsdottir
, Thorvaldur Arnason , Mats Axelsson , Per Eksell ,
e d
Helgi Sigur
)
sson , Johan Carlsten
a
´ ´ ´
Holar Agricultural College, 551 Sau)arkrokur, Iceland
b
˚
International Horse Breeding Consultant AB, Knubbo, 74494 Morgongava, Sweden
c
Department of Large Animal Clinical Sciences, Faculty of Veterinary Medicine, Swedish University of Agricultural Sciences, 750 07 Uppsala, Sweden
d
Department of Clinical Radiology, Faculty of Veterinary Medicine, The Swedish University of Agricultural Sciences, 750 07 Uppsala, Sweden
e
´ Institute for Experimental Pathology, University of Iceland, Keldur, 128 Reykjavık, Iceland Received 13 October 1998; received in revised form 14 April 1999; accepted 19 April 1999
Abstract
The heritability of radiographic signs of degenerative joint disease (DJD) in the distal tarsal joints and hind limb lameness after flexion test of the tarsus was estimated in a population of Icelandic horses being used for riding. Furthermore, the genetic and phenotypic correlation between the radiographic signs and lameness was estimated. Of the 614 examined horses, aged 6–12 years, 420 belonged to progeny groups from 17 selected stallions and 194 were sired by unselected stallions. The heritability was analyzed by two statistical models based on the threshold liability concept, a non-linear sire model and a linear animal model. The heritability of radiographic signs of DJD in the distal tarsal joints was not found to be significantly
2
different from zero. The h estimate for lameness was higher and in the order of 0.4. A positive genetic and phenotypic correlation was identified between radiographic signs of DJD in the distal tarsal joints and lameness. The results indicate that the prevalence of DJD in the distal tarsal joints could be reduced in Icelandic riding horses by breeding selection based on
flexion test of the tarsus followed by radiographic examination. 2000 Elsevier Science B.V. All rights reserved.
Keywords: Equine; Bone spavin; DJD; Icelandic horse; Heritability
1. Introduction the native population has been isolated from other
horse breeds for about 11 centuries (Adalsteinsson, The Icelandic horse, also known as the Icelandic 1981). Based on different traits of the riding per-toelter horse, is the only horse breed in Iceland and formance and the conformation, organized horse breeding has been practiced in Iceland since the beginning of this century (Hugason, 1994). Since
*Corresponding author. Tel.: 1354-4536-300; fax: 1
354-1986, the Best Linear Unbiased Prediction (BLUP)
4536-301.
¨ ´
E-mail address: [email protected] (S. Bjornsdottir) method has been used to evaluate the breeding
values in an index, where all pedigree information is sires was avoided. Additionally, horses of the same included (Arnason, 1984). A list of horses with the age, sired by other, unselected stallions were in-highest indexes is published annually. The registra- cluded in the material. Information on the pedigrees tion of horses in Iceland is voluntary and includes was collected from the owners and the official mostly breeding horses. Consequently, the register register of horses in Iceland and was traced as far does not represent the age, gender or genetic back- back as possible. The paternity of the offspring from ground of the entire population. Examination for the selected stallions was tested by blood typing. diseases that are suspected to be inherited is, current- The material consisted of 614 horses, of which ly, not included in the breeding program. 420 were in the progeny groups (half-sibs) and 144 Degenerative joint disease (DJD) of the distal were sired by 83 other identified stallions. The tarsal joints, sometimes called bone spavin, (Bar- paternity of 50 horses was unknown. The mean age neveld, 1983; Butler et al., 1993) has been reported was 7.9 years and the distribution of gender was 24 to be a common condition in Icelandic horses (Eksell (3.9%) stallions, 403 (65.6%) geldings and 187 et al., 1998). Radiographic examination is considered (30.5%) mares.
essential for the diagnosis (Stashak, 1987; Butler et
al., 1993) but palpation of the distal tarsus and hind 2.2. Radiographic examination limb motion evaluation before and after flexion test
of the tarsus have also been shown to be of impor- The radiographic examination included latero-58 -tance (Axelsson et al., 1998). proximal-mediodistal (L5Pr-MDi), dorso-358 -lateral-The aetiology of DJD in the distal tarsal joints is plantaromedial oblique (D35L-PlMO) and plantaro-not clear but has been considered to be multifactorial 458-lateral-dorsomedial oblique (Pl45L-DMO) views (Wyn-Jones, 1988). It has been related to poor of each tarsus. The diagnostic criteria for radiog-conformation and horses with sickle hocks and cow raphic signs of DJD in the distal tarsal joints were: hocks have been reported to be predisposed for rarefaction of subchondral bone, narrowing or col-developing bone spavin indicating an inheritable lapse of intertarsal joint spaces (Eksell, 1998a). The character (Rooney, 1968; Gabel, 1980; Barneveld, presence of the radiographic signs was classified as 1983; Stashak, 1987). In German riding horses, the all-or-none trait, based on the consensus of two heritability of bone spavin, based on a radiographic radiologists. Horses with equivocal radiographic
2
diagnosis, has been estimated to be low, h 50.02– findings, were classified as radiographically normal. 0.04 on an observed scale (Winter et al., 1996).
The purpose of the present study was to estimate
2.3. Clinical examination the heritability of radiographic signs of DJD in the
distal tarsal joints and hind limb lameness in a
Hind limb lameness was first evaluated while population of Icelandic horses being used for riding
trotting the horse by hand on a firm surface 25–30 m in Iceland.
straight away from the examiner and back. After which a flexion test was performed by flexion of each tarsus for 1 min before repeating the above
2. Materials and methods
motion evaluation. Lameness after flexion test was classified as all-or-none trait. In doubtful cases, 2.1. Horses
horses were classified as free from lameness. The clinical examination was performed, and the results By an official advertisement, horseowners in the
were recorded after the consensus of the same two south, west and north of Iceland were invited to
clinicians throughout the study. submit horses, aged 6–12 years and being used for
riding, to the study. Offspring from 17 selected sires
that were in use for breeding in the years 1982–1989 2.4. Statistical methods and having a breeding index (BLUP) higher than
distal tarsal joints (RS), lameness, RS and lameness, Alternatively to the non-linear threshold model, an and, RS and / or lameness. animal model, using the complete additive genetic The statistical models for the analysis of the relationship between all animals was fitted to the heritability of the binary variables were based on the data. Tracing the pedigrees of the 614 horses in the threshold liability concept (Falconer, 1989). The material as far back as they were registered resulted material was analyzed with two conceptually differ- in 1261 horses available for the analysis. The male ent models. The following non-linear, sire model was paths were 2.8 generations on average with maxi-fitted to the progeny data. mum tracing of six generations, while the corre-sponding figures on the female side were 0.5 and 3,
Yijkl5h 1gi1mj1sk1wijkl respectively. The unrecorded individuals which did not have pedigree ties with more than one other where Yijkl5the l-th observation (one or two) within horse provided no information to the analysis and the i-th age class (i51,..., 7; 6–12 years) and within were pruned. This left 1055 horses which were the j-th sex class on the k-th sire;h5the localization informative for the analysis, of which 122 were (fixed effect) of the threshold on the scale of the identified sires and 92 were identified dams with standard normal distribution; gi5the fixed effect of progeny records. Corresponding number of grand-the i-th age class (i51,..., 7; 6–12 years); mj5the sires and grand-dams with progeny records were 42 fixed effect of the j-th sex class (male, female); and 29, respectively.
sk5the random effect of the k-th sire (k51,..., 17)5 The following linear model was assumed:
2
NID(0, ss) and wijkl5random residual term5 2
NID(0, sw). Y 5s 1g 1m 1a 1e
ijkl i j k ijkl The heritability is defined as the ratio of additive
genetic variance to phenotypic variance, commonly threshold model equations of Gianola and Foulley (i51,..., 7; 6–12 years); mj5the fixed effect of the (1983) were solved by the CMMAT computer j-th sex class (male, female); ak5the random effect programs of Misztal et al. (1989). In threshold of the breeding value of the k-th animal (k51,...,
2
models only the relative size of the variance com- 614)5N(0, Asa) where A is the matrix of numeric
2
ponents are of interest and thesw components may genetic relationship between 1055 animals and eijkl5 2
for convenience be set arbitrarily to one. random residual term5NID(0,se).
The standard errors of the estimated threshold and The DFREML programs of Meyer were used for heritabilities were obtained by simulating 1000 sam- estimating the heritabilities on the observable scale ples of data with 17 progeny groups, each composed by locating the maximum of the restricted maximum of 25 members. The binary variables, Y, were formed likelihood function by a derivative free approach according to the truncated value of a normally (Meyer, 1993).
distributed underlying variable, x, in relation to the The heritability estimates were transformed to the estimated thresholds. The underlying variables were]]]] underlying scale by the transformation formula of
2 2 2 2
generated as x5s1w5zh / 21z9
œ
(121 / 4h ), Robertson: hund5hobsp(12p) /z , where z is thewhere z and z9are independent and normally distrib- ordinate of the standardized normal distribution at uted deviates with zero means and unit variance and the truncation point corresponding to the frequency are obtained by the Box–Muller method (Press et al., affected, p (Dempster and Lerner, 1950).
(r ) and phenotypic (r ) correlations were estimatedA P mated location of the thresholds for six-year-old by the standard procedure (Falconer, 1989). males corresponds to the frequency values, p50.23 for RS, 0.28 for lameness, 0.17 for RS and lameness, and, 0.34 for RS and / or lameness.
3. Results The results from the analysis based on the linear
animal model are shown in Table 2.
The prevalence of radiographic signs of DJD in A bivariate analysis of RS and lameness, accord-the distal tarsal joints (RS) was 30.3%. Hind limb ing to an animal model, yielded the following lameness after flexion test (lameness) was identified estimates of genetic and phenotypic correlations: in 32.4% of the horses. The combination RS and rA50.70 and rP50.30.
lameness was found in in 16.4% while RS and / or Corresponding estimates between RS and RS and lameness were found in 46.3%. Horses with the lameness were obtained: rA50.93 and rP50.66. radiographic signs had four-times higher odds of
being lame than horses without them (P,0.001).
Results from the heritability analysis according to 4. Discussion
the non-linear threshold sire model are summarized
in Table 1. Solutions for the fixed effects were The heritability for lameness was, in the two obtained by constraining the first level of all fixed models, estimated to be 0.4, which is considerably
2
effects exceeding the threshold to zero. The esti- higher than for RS, where the estimated h was 0.1
Table 1
a
Results from the non-linear threshold sire model analysis
b
Variables
RS Lameness Lameness Lameness
and RS and / or RS
Threshold 0.737 0.598 0.965 0.406
S.E. threshold 0.080 0.100 0.097 0.095
Corresponding p 0.230 0.275 0.167 0.342
Age (years)
6 0 0 0 0
7 20.065 20.227 0.258 20.394
8 20.251 0.121 0.022 20.139
9 20.571 0.049 20.074 20.439
10 20.432 20.033 0.086 20.460
11 20.724 0.017 20.197 20.489
12 20.864 20.578 20.835 20.682
Sex
Male 0 0 0 0
Female 0.176 20.174 0.193 20.126
Sire variance
2
ss 0.023 0.107 0.076 0.076
Heritability
2
h 0.088 0.385 0.284 0.282
2
S.E. h 0.109 0.204 0.187 0.176
a
Solutions to the fixed effects of the threshold, age and sex, and estimates of sire variances and of heritability.
b
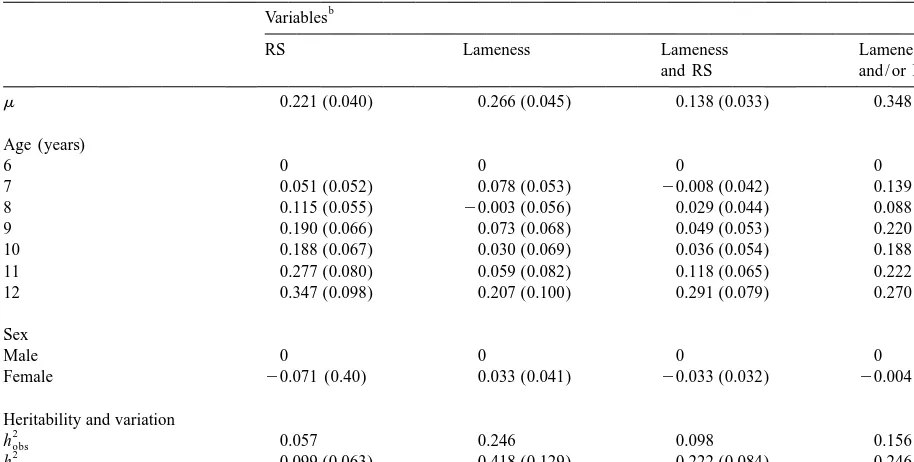
Table 2
a
Results from the linear model analysis
b
Variables
RS Lameness Lameness Lameness
and RS and / or RS
m 0.221 (0.040) 0.266 (0.045) 0.138 (0.033) 0.348 (0.046)
Age (years)
6 0 0 0 0
7 0.051 (0.052) 0.078 (0.053) 20.008 (0.042) 0.139 (0.056)
8 0.115 (0.055) 20.003 (0.056) 0.029 (0.044) 0.088 (0.060)
9 0.190 (0.066) 0.073 (0.068) 0.049 (0.053) 0.220 (0.072)
10 0.188 (0.067) 0.030 (0.069) 0.036 (0.054) 0.188 (0.074)
11 0.277 (0.080) 0.059 (0.082) 0.118 (0.065) 0.222 (0.088)
12 0.347 (0.098) 0.207 (0.100) 0.291 (0.079) 0.270 (0.107)
Sex
Male 0 0 0 0
Female 20.071 (0.40) 0.033 (0.041) 20.033 (0.032) 20.004 (0.043)
Heritability and variation
2
hobs 0.057 0.246 0.098 0.156
2
hund 0.099 (0.063) 0.418 (0.129) 0.222 (0.084) 0.246 (0.094)
sP 0.449 0.466 0.363 0.493
a
Solutions to the fixed effects of age and sex (6S.E.). Estimates of phenotypic variance and heritability on the observed and the underlying scale.
b
RS5Radiographic signs of degenerative joint disease in the distal tarsal joints; lameness5hind limb lameness after flexion test of the tarsus.
and not significantly different from zero. The radiog- whether they have developed RS at the time of
2
raphic diagnosis is considered to be specific for DJD examination. However, the h estimates in the pres-in the distal tarsal jopres-ints and once present, the ent study corresponds well to figures reported for radiographic signs persist with bone remodelling bone spavin (radiographic diagnosis) in 3–8 years over time. The linear increase in the prevalence of (mean age53.9 years) German riding horses (Winter RS in the age range of 6–12 years suggest that the et al., 1996).
disposition is present in the majority of Icelandic Hind limb lameness after flexion test of the tarsus horses. If the linear increase is continuous, all the is regarded as a less specific method for the diag-horses will show RS if they get old enough. The nosis of DJD in the distal tarsal joints than radiog-linear effect of age on the radiographic signs might raphy (Stashak, 1987). The presence of lameness be partly genetic. Inclusion of the fixed effects of age connected with the disease has also been shown to in the linear model might therefore cause a serious vary (Stashak 1987; Butler et al., 1993). The reduction in the estimated sire variance component heritability estimates for lameness need therefore to and consequently result in underestimation of the be interpreted with care. As no other specific con-heritability of RS. Exclusion of age from the model ditions are known to affect the tarsal or stifle joints
2
DJD of the distal tarsal joints, the result is similar to reproduce before before the age of six, this type of what was found for lameness in the present study. selection would move the threshold value for six-The results of these two studies indicate that the year-old males from the current value of 0.965 to disposition for lameness may be inherited more than 1.011 in ten years. This means a reduction from the the correlated trait (RS). present frequency of 0.167 to 0.156 in ten years. There was no linear trend in the effect of age on Selection based on progeny testing or a combined the frequency of lameness. It may be that horses can index could possibly lead to somewhat greater be lame in the early stage of the disease and the genetic response. According to the higher estimated lameness can improve over time. It may also indicate heritability of lameness, a higher response in RS and that the presence of lameness is not dependent on the even in lameness and RS might be expected from an same factors as developing of the radiographic signs. indirect selection for lameness alone. However, since The estimated heritability for the two combined the inclusion of age effects in the linear model might variables (RS and lameness, and, RS and / or lame- have caused underestimation of the genetic variance ness) was found to be similar and in the order of in RS, the combined criterium should, of caution, be 0.25. They were significantly different from zero recommended in practice until further knowledge according to the animal model. will be available.
The results from the two statistical models show Cost–benefit analysis needs to be performed for good agreement for the heritability estimates. The different selection programs, weighing the expected animal model, utilizing the additional information gain in relation to the cost of the disease, the about relationship ties across the population, did not diagnostic tests and the lowered genetic gain that alter the results obtained by the sire model. It could be expected for other important traits. indicates that the dams represent a random sample. More sensitive diagnostic methods such as sci-The size of the data set is however limited for ntigraphy (Lamb and Koblik, 1988) and in the future heritability estimates, which are susceptible to rather methods based on genetic markers could make the large sampling errors. The standard errors for the selection more favorable.
estimates are higher in the sire model as expected, since the animal model uses more observations and
accounts for the entire pedigree structure in the data. Acknowledgements
The phenotypic correlation between RS and
lame-ness was medium high (0.3) in the present study. The study was supported by grants from the The estimated genetic correlation is higher (0.7) but Icelandic Research Council and The Agricultural is a subject to a large sampling error. It corresponds Productivity Fund of Iceland.
to an environmental correlation in the order of 0.2 and together these positive correlations supports the
relationship between RS and lameness. References A positive lameness examination followed by
radiographic examination demonstrating DJD in the Adalsteinsson, S., 1981. Origin and conservation of farm animal
distal tarsal joints, could be used as excluding populations in Iceland. Zeitschrift Tierzuchtung Zuchtungsbiol. 98, 43–52.
criterion for breeding horses. The heritability for the
´ ¨ ¨ ¨
Axelsson, M., Eksell, P., Roneus, B., Brostrom, H., Haggstrom, J.,
combined variable RS and lameness is estimated to
Carlsten, J., 1998. Relationship between hind limb lameness
be medium and the genetic correlation of the com- and radiographic signs of bone spavin in Icelandic horses in bined variable and RS is high. For example, stall- Sweden. Acta. Vet. Scand. 39 (3), 349–357.
ions, with RS and lameness at the age of six years, Arnason, Th., 1984. Genetic studies on conformation and per-formance of Icelandic toelter horses. IV. Best linear unbiased
could be excluded from the breeding. The generation
prediction of ten correlated traits by use of an ‘‘animal model’’.
interval of the Icelandic horse is approximately nine
Acta Agric. Scand. 34, 450–462.
years in males and 11 years in females (Hugason et Barneveld, A., 1983. Spavin in the horse. Ph.D. Thesis, Utrecht al., 1985). Assuming that the estimates in Table 1 are University, Utrecht.
1993. The tarsus. In: Clinical Radiology of the Horse, Black- Klein, J.P., Moeschberger, M., 1997. Survival Analysis, Springer, well Scientific Publications, Oxford, pp. 211–247. New York.
Dempster, E.R., Lerner, I.M., 1950. Heritability of threshold Lamb, C.R., Koblik, P.D., 1988. Scintigraphic evaluation of characters. Genetics 35, 212–235. sceletal disease and its application to the horse. Vet. Radiol. 29, Dolvik, N.I., Gaustad, G., 1996. Estimation of the heritability of 16–27.
lameness in standardbred trotters. Vet. Record 138, 540–542. Meyer, K., 1993. DFREML, User Notes 2.1. University of New
¨ ´ ¨ ¨
Eksell, P., Axelsson, M., Brostrom, H., Roneus, B., Haggstrom, J., England, Armidale, NSW, Australia.
Carlsten, J., 1998. Prevalence and risk factors of bone spavin in Misztal, I., Gianola, D., Foulley, J.L., 1989. Computing aspects of Icelandic horses in Sweden. Acta Vet. Scand. 39 (3), 339–348. nonlinear method of sire evaluation for categorical data. J. Eksell, P., Uhlhorn, H., Carlsten, J., 1998. Evaluation of different Dairy Sci. 72, 1557–1568.
projections for radiographic detection of tarsal degenerative Press, W.H., Flannery, B.P., Teukolsky, S.A., Vetterling, W.T., joint disease in Icelandic horses. Vet. Radiol. in press. 1989. In: Numerical Recipes, Cambridge University Press, Falconer, D.S., 1989. In: Introduction to Quantitative Genetics, Cambridge, pp. 191–213.
Longman Scientific and Technical, Essex, pp. 300–312. Rooney, J.R., 1968. Lameness of the hind limb. In: Biomechanics Gabel, A.A., 1980. Lameness caused by inflammation in the distal of Equine Lameness, Williams and Wilkins, Baltimore, MD,
hock. Vet. Clin. North. Am. (Lg. Anim. Pract.) 2, 101–124. pp. 197–218.
Gianola, D., Foulley, J.L., 1983. Sire evaluation for ordered Stashak, T.S., 1987. The tarsus. In: Stashak, T.S. (Ed.), Adam-´
´ ´ ´
categorical data with a threshold model. Genet. Sel. Evol. 15, s Lameness in Horses, 4th ed, Lea and Febiger, Philadelphia,
201–224. PA, pp. 694–704.
Hugason, K., Arnason, Th., Jonmundsson, J.V., 1985. A note on Winter, D., Bruns, E., Glodek, P., Hertsch, B., 1996. Genetic the fertility and some demographical parameters of Icelandic disposition of bone diseases in sport horses. Zuchtungskunde toelter horses. Livest. Prod. Sci. 12, 161–167. 68 (2), 92–108.
Hugason, K., 1994. Breeding of Icelandic toelter horses: an Wyn Jones, G., 1988. Tarsal osteoarthritis (‘‘spavin’’). In: Equine overview. Livest. Prod. Sci. 40, 21–29. Lameness, Blackwell Scientific Publications, Oxford, pp. 140– Hugason, K., 1997. Hrossaræktin 1996, The Agricultural Society 150.