www.elsevier.com / locate / livprodsci
The effects of the ratio of grass silage to concentrates in the
diet and restricted dry matter intake on the performance and
carcass composition of beef cattle
a,b,c ,
*
b,cR.W.J. Steen
, D.J. Kilpatrick
a
Agricultural Research Institute of Northern Ireland, Hillsborough, Co. Down BT26 6DR, UK
b
Department of Agriculture for Northern Ireland, Newforge Lane, Belfast BT9 5PX, UK
c
The Queen’s University of Belfast, Newforge Lane, Belfast BT9 5PX, UK
Received 21 July 1998; received in revised form 23 March 1999; accepted 1 April 1999
Abstract
The effects of the proportion of concentrates in grass silage-based diets and of restricted dry matter (DM) intake were examined using 156 Simmental cross Friesian steers which were initially 389 kg live weight. The animals were reared on high-forage diets until 14 months of age and were then given grass silage ad libitum and supplemented with rolled barley which constituted (1) 0, (2) 120, (3) 240 and (4) 360 g / kg total DM intake. Diet 5 consisted of grass silage only until 510 kg live weight and diet 4 thereafter, while diet 6 consisted of 640 g silage DM and 360 g barley / kg DM and was offered at 80% of ad libitum intake. Representative groups of animals were slaughtered initially and serially for each diet at 510, 560 and 610 kg live weight. Increasing the proportion of concentrates in the diet increased metabolisable energy intake and carcass gain by 0.042 (S.E. 0.007) MJ / day and 0.728 (S.E. 0.036) g / day per g / kg increase in the proportion of concentrates in the diet but did not significantly affect carcass fat content. Restricting dry matter intake by 21% reduced carcass, lean and fat gains by 31, 29 and 37%, respectively, and carcass fat content by 13 g / kg. The response in carcass gain per MJ reduction in ME intake was 60% greater when ME intake was reduced by reducing the proportion of concentrates in the diet rather than restricting DM intake. Increasing slaughter weight increased carcass fat content by 39 g / kg per 100 kg increase in slaughter weight. It is concluded that reducing energy intake by restricting DM intake or reducing the proportion of concentrates in the diet reduced the efficiency of carcass and lean gains. All strategies used to reduce energy intake had only small to modest effects on carcass fat content and hence the effect of reducing energy intake on carcass fat content were equivalent to those of reducing slaughter weight by only 18 to 45 kg. Consequently for cattle reared on high-forage diets reducing slaughter weight is likely to be a more effective approach to reducing carcass fat content than reducing energy intake during the finishing period. 2000 Elsevier Science B.V. All rights reserved.
Keywords: Beef cattle; Grass silage; Concentrates
1. Introduction
The efficient production of lean beef suitable for
*Corresponding author. Tel.: 144-1846-682-484; fax: 1
44-1846-689-594. current consumer demand necessitates effective
tioning of beef cattle. Current feeding standards for harvester. The grass was ensiled without wilting or beef cattle within the United Kingdom (e.g. ARC, additive treatment in concrete-lined trench silos 1980; AFRC, 1990) predict that a reduction in which were filled simultaneously. The barley used in energy intake produces a large reduction in per- both years was undried and was treated with propi-formance with little effect on the energy or fat onic acid at a rate of 6 l / t prior to storage. In both contents of the gain and consequently that food years, the silages were removed from the silos in efficiency improves with increasing food intake up to vertical layers using a block cutter and were offered ad libitum intake. However, in a number of studies, to the animals (except those receiving diet 6) once restricting dry matter intake has improved food daily in sufficient quantities to allow a refusal of 50 efficiency (e.g. Andersen and Ingvartsen, 1984). On to 100 g / kg intake. Animals given diet 6 were the other hand, diets containing a high proportion of offered 80% of the silage and concentrate DM which grass silage have sustained lower growth rates and those given diet 4 had consumed at a similar live resulted in a greater proportion of fat in the gain than weight. The barley and mineral and vitamin supple-when similar quantities of energy and protein have ment were offered together with the silage, but there been given in the form of high-concentrate diets was little mixing of the silage and concentrate (Thomas et al., 1988; Baker et al., 1992). The effects portions of the ration.
of a change in energy intake on the performance and
carcass composition of beef cattle are therefore likely 2.2. Animals and management to depend on whether this change is achieved by
restricting the quantity of dry matter given, or One hundred and fifty-six Simmental cross, cas-increasing the forage:concentrate ratio in a diet given trated male cattle (steers) which were initially 14 ad libitum. The present experiment was carried out months old and 389 (S.E. 5.5) kg live weight were to examine the effects of the proportion of concen- used over the 2 years of the experiment, 78 in each trates in a grass silage-based diet and ad libitum year. They were purchased at 1 to 2 weeks of age in versus restricted dry matter (DM) intake on the September and October 1989 and 1990. They were performance, carcass composition and efficiency of artificially reared, weaned at 6 weeks of age and lean meat production by steers. given grass silage ad libitum and supplemented with a maximum of 2.0 kg concentrates per head daily until turnout to pasture in April. They grazed
peren-2. Materials and methods nial ryegrass swards without concentrate supple-mentation until housing in October. During a 3-week 2.1. Treatments and diets acclimatisation period they were given grass silage ad libitum and supplemented with 2 kg of cereal-The dietary treatments consisted of grass silage based concentrates per head daily, and were treated offered ad libitum and supplemented with rolled for internal and external parasites using ivermectin barley which constituted (1) 0; (2) 120; (3) 240 and (1.0% w / v, Ivomec, MSD, Agvet). At the beginning (4) 360 g / kg total DM intake. The animals given of the experiment they were divided according to diet 5 received silage only until 510 kg live weight live weight into six blocks each of 13 animals in and diet 4 thereafter, while diet 6 consisted of 360 g each year. One animal was chosen at random from rolled barley and 640 g grass silage / kg DM and was each block to form a pre-experimental slaughter offered at 80% of the ad libitum intake of the group. The remaining 12 animals in each block were animals given diet 4 at a similar live weight. In further divided into two blocks of six according to addition all animals received 50 g per head daily of a weight, and were then allocated to the treatments at mineral and vitamin supplement. The experiment random within each block.
animals of similar live weight. To this end blocks 1, sides of each carcass and weighed. The carcasses 6, 9 and 10 were allocated to the same pen, as were were graded visually for fatness and conformation blocks 2, 5, 8 and 11 and blocks 3, 4, 7 and 12. The using the five-point scales of the European Carcass three groups of animals on each treatment were Classification Scheme as described by Kempster et allocated at random to target slaughter weights of al. (1982). They were divided between the 10th and 510, 560 and 610 kg. In the second year, the animals 11th ribs and the depth of subcutaneous fat over the were housed in groups of 12 in slatted pens, and M. longissimus dorsi muscle was measured at points were fed individually through electronically operated a quarter, half and three quarters way across the feeding doors (American Calan plc). When the live maximum width of the muscle on both sides of each weight of the heaviest animals approached 510 kg, carcass as described by Kempster et al. (1986). The all animals were allocated to the three slaughter amount of marbling fat in the cut surface of the L. weights, 510, 560 and 610 kg. The 12 animals on dorsi was assessed independently by two individuals
each treatment were divided into four groups of three using the eight-point scale of the United States according to live weight and were allocated to the Department of Agriculture photographic standards three slaughter groups at random within each group. (ARC, 1965). A photograph was taken of the cut surface of the L. dorsi on both sides of each carcass 2.3. Measurements and its area was determined using a Delta-T-devices
leaf area machine (Model AM2).
The quantities of silage and concentrates offered The left side of each carcass was dissected into 14 were recorded throughout the experiment and refus- primal joints, lean trim, fat trim and bone using a als were removed and recorded twice per week. commercial jointing procedure. Hind-quarters were Refusals were assumed to be entirely silage DM as divided into shin, silverside, topside, thick flank (or there were no visible signs of any barley in them. knuckle), rump, loin, thin flank and fillet and fore-Silage DM intakes were calculated using daily oven quarters into fore-rib, flank, shoulder, brisket, chuck DM determinations and were converted to an alcohol (including neck) and shin. Subcutaneous fat was corrected toluene DM basis using a correction factor trimmed to a maximum depth of 6 mm and inter-which was calculated from the oven and alcohol muscular fat to a standard specified by a group of corrected toluene DM determinations made twice retailers in Continental Europe. Saleable meat was weekly on the same composite samples. The appar- calculated as the total weight of joints plus the lean ent digestibilities of the diets were determined on trim and the saleable meat in high-priced joints as two occasions in each year of the experiment, using the total weight of the silverside, topside, thick flank, three steers for each diet on each occasion. The diets rump, loin, fillet and fore-rib joints. The fore-rib were offered for 3 weeks prior to the collection of joint (which was removed as described by Kempster faeces and urine. The digestibilities of the silages et al. (1980) without being trimmed to facilitate the were also determined on four occasions in each year prediction of carcass composition from the com-of the experiment, using four castrated male sheep position of the joint) from the left side of each on each occasion, which were offered the silages at carcass was further dissected into separable lean, maintenance level of energy intake. The procedures separable fat and bone using the method described for the determination of digestibilities were as de- by Cuthbertson et al. (1972).
scribed by Steen (1984). The compositions of the carcasses of all animals The animals were weighed every 2 weeks through- used in the experiment were estimated from the out the experiment to monitor performance. They composition of the fore-rib joints using the following were also weighed on 2 consecutive days at the equations which were provided by the Meat and beginning of the experiment and prior to slaughter, Livestock Commission in Great Britain:
and live-weight gains were calculated by difference Carcass lean concentration529224.07a10.607b using the mean of the two values.
Carcass fat concentration518.515.53a10.638c After slaughter the omental, mesenteric,
where a is the weight of the fore-rib joint (kg); b is of animals on which it was based (i.e. four in year 1 the lean concentration in the fore-rib joint (g / kg); c and one in year 2). Data for live-weight, carcass and is the fat concentration in the fore-rib joint (g / kg) tissue gains and carcass data were analysed by and d is the bone concentration in the fore-rib joint regression procedures (Genstat 5 Committee, 1989) (g / kg) (A.J. Kempster, personal communication). with the fitted model removing the effects of years. Relationships between live weight and weights of Tests were made for quadratic relationships with carcass, lean, fat and bone, were developed for the slaughter weight but these proved non-significant 12 animals slaughtered initially using least squares (P.0.05). The fitted model allowed the estimation regression analysis, to estimate the initial weights of of means corresponding to the target slaughter carcass and tissues in the animals used in the feeding weights.
experiment. However these relationships were not significant and so the mean contents of carcass, lean,
fat and bone in the live weight of the initial slaughter 3. Results
group were used to estimate the initial weights of
tissues in the animals used in the feeding experiment. The chemical composition of the silages and The estimated weights of carcass and tissues initially concentrates are given in Table 1. The silages were were then used to calculate carcass, lean, fat and of high digestibility and were well preserved as bone gains for each animal. indicated by their low pH values and relatively low Procedures for sampling feeds, faeces and urine contents of ammonia and butyrate and high contents for chemical analyses and the methods of chemical of true protein. The apparent digestibilities and analyses were as described by Steen (1989). metabolisable energy (ME) concentrations in the diets are given in Table 2. The ME concentrations of 2.4. Statistical analyses the diets were calculated using determined gross energy intakes and faecal and urinary energy outputs, Data for food and energy intakes were expressed methane energy being taken as 8% of gross energy as means for each group of four animals in year 1 intake for the diets offered ad libitum and 5.3% of and for individual animals in year 2 and analysed by gross energy intake for the restricted diet, as these analysis of variance using slaughter weight as a values have been obtained by indirect calorimetry for covariate, each value contributing to the final mean similar diets offered in previous studies at this values for the treatments in proportion to the number Institute (Kirkpatrick et al., 1997). Increasing the
Table 1
Chemical composition of foods (mean6S.E.; g / kg unless otherwise stated)
No. of Silage No. of Barley
analyses analyses Years 1 and 2
Year 1 Year 2
Dry matter 104 19061.4 20561.8 102 81162.4
pH 104 3.960.02 3.960.02
Composition of dry matter
Crude protein 104 14861.5 14561.5 102 10660.5
True protein 27 7861.0 7760.9 32 9961.3
Ammonia N (g / kg total N) 104 9862.7 8262.3
Modified acid detergent 54 34662.1 34762.6 102 7260.7
fibre
Ash 54 8361.2 8461.2 102 2460.2
Lactate 104 8463.1 12063.0
Acetate 104 9.660.65 26.861.04
Butyrate 104 2.560.25 1.860.29
Table 2
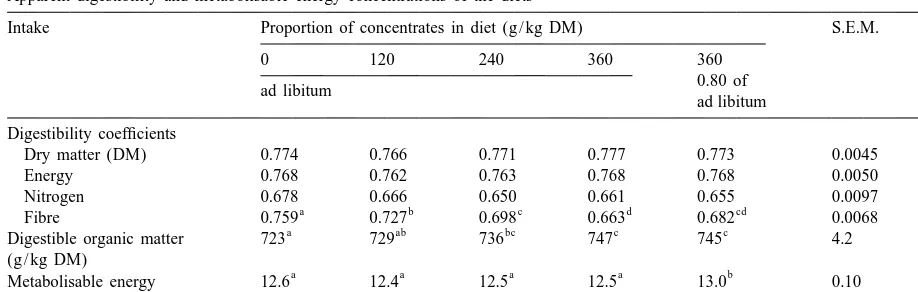
Apparent digestibility and metabolisable energy concentrations of the diets
Intake Proportion of concentrates in diet (g / kg DM) S.E.M. Sig.
0 120 240 360 360
0.80 of ad libitum
ad libitum
Digestibility coefficients
Dry matter (DM) 0.774 0.766 0.771 0.777 0.773 0.0045
Energy 0.768 0.762 0.763 0.768 0.768 0.0050
Nitrogen 0.678 0.666 0.650 0.661 0.655 0.0097
a b c d cd
Fibre 0.759 0.727 0.698 0.663 0.682 0.0068 ***
a ab bc c c
Digestible organic matter 723 729 736 747 745 4.2 **
(g / kg DM)
a a a a b
Metabolisable energy 12.6 12.4 12.5 12.5 13.0 0.10 ***
concentration (MJ / kg DM)
a,b,c,d
Means with the same superscript are not significantly different.
proportion of concentrates in the diets from zero to metabolisable protein requirements as given by the 360 g / kg total DM did not affect the digestibilities UK Metabolisable Protein System (AFRC, 1992). of DM, energy or nitrogen or the ME concentration Increasing the proportion of concentrates in the of the diets. However it significantly increased (P, diets offered ad libitum significantly increased (P,
re-Table 3
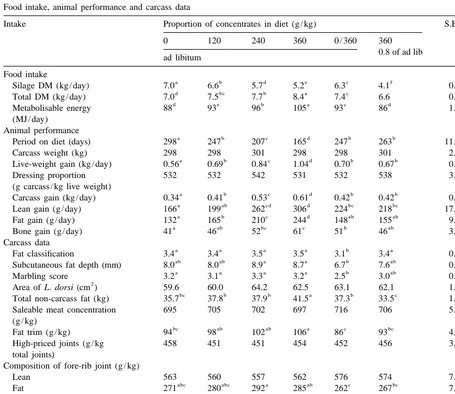
Food intake, animal performance and carcass data
Intake Proportion of concentrates in diet (g / kg) S.E.M. Sig.
0 120 240 360 0 / 360 360
Metabolisable energy 88 93 96 105 93 86 1.05 ***
(MJ / day) Animal performance
a b c d b b
Period on diet (days) 298 247 207 165 247 263 11.4 ***
Carcass weight (kg) 298 298 301 298 298 301 2.1
a b c d b b
Live-weight gain (kg / day) 0.56 0.69 0.84 1.04 0.70 0.67 0.026 ***
Dressing proportion 532 532 542 531 532 538 3.2
(g carcass / kg live weight)
Fat classification 3.4 3.4 3.5 3.5 3.1 3.4 0.09 *
ab ab a a b ab
Subcutaneous fat depth (mm) 8.0 8.0 8.9 8.7 6.7 7.6 0.52 *
a a a a b ab
Marbling score 3.2 3.1 3.3 3.2 2.5 3.0 0.18 *
2
Area of L. dorsi (cm ) 59.6 60.0 64.2 62.5 63.1 62.1 1.45
bc b b a b c
Total non-carcass fat (kg) 35.7 37.8 37.9 41.5 37.3 33.5 1.29 ***
Saleable meat concentration 695 705 702 697 716 706 5.2 *
(g / kg)
bc ab ab a c bc
Fat trim (g / kg) 94 98 102 106 86 93 4.0 *
High-priced joints (g / kg 458 451 451 454 452 456 3.8
total joints)
Composition of fore-rib joint (g / kg)
Lean 563 560 557 562 576 574 7.6
abc abc a ab c bc
Fat 271 280 292 285 262 267 7.8 *
a ab b a ab
Bone 166 161 151 153 163 159 3.1 **
Estimated carcass composition (g / kg)
Lean 608 606 606 608 616 614 4.6
abc abc a ab c bc
Fat 226 232 239 235 220 225 5.0 *
a ab c bc a abc
Bone 155 153 149 150 155 152 1.4 **
a,b,c,d
Means with the same superscript are not significantly different.
stricting the intake of the diet containing 360 g tion of fat trimmed off the joints in the commercial concentrates / kg DM did not significantly affect dissection (P,0.05). The animals given silage only carcass fat classification, subcutaneous fat depth, to 510 kg live weight and silage plus 360 g concen-marbling score, the area of the L. dorsi muscle, the trates / kg DM thereafter produced the leanest carcas-saleable meat content in the carcass or the separable ses, although only their carcass fat classification, lean or fat contents in the fore-rib joint or estimated marbling score and the proportion of fat trimmed off in the carcass, although there was a tendency for the the joints in the commercial dissection were sig-animals with the restricted intake to have higher lean nificantly lower (P,0.05) than those for the animals and lower fat contents. Furthermore, restricting given the diet containing 120 g concentrates / kg DM intake significantly reduced the total weight of non- which had the same growth rate.
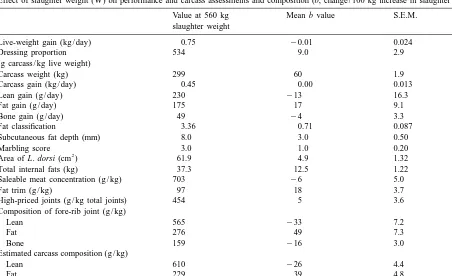
Table 4
Effect of slaughter weight (W) on performance and carcass assessments and composition (b, change / 100 kg increase in slaughter weight)
Value at 560 kg Mean b value S.E.M. Sig.
slaughter weight
Live-weight gain (kg / day) 0.75 20.01 0.024
Dressing proportion 534 9.0 2.9 *
(g carcass / kg live weight)
Carcass weight (kg) 299 60 1.9 ***
Carcass gain (kg / day) 0.45 0.00 0.013
Lean gain (g / day) 230 213 16.3
Fat gain (g / day) 175 17 9.1
Bone gain (g / day) 49 24 3.3
Fat classification 3.36 0.71 0.087 ***
Subcutaneous fat depth (mm) 8.0 3.0 0.50 ***
Marbling score 3.0 1.0 0.20 ***
2
Area of L. dorsi (cm ) 61.9 4.9 1.32 ***
Total internal fats (kg) 37.3 12.5 1.22 ***
Saleable meat concentration (g / kg) 703 26 5.0
Fat trim (g / kg) 97 18 3.7 ***
High-priced joints (g / kg total joints) 454 5 3.6
Composition of fore-rib joint (g / kg)
Lean 565 233 7.2 ***
Fat 276 49 7.3 ***
Bone 159 216 3.0 ***
Estimated carcass composition (g / kg)
Lean 610 226 4.4 ***
Fat 229 39 4.8 ***
Bone 152 211 1.3 ***
dressing proportion (P,0.05) and all assessments of and Edwards, 1976). Increasing the proportion of carcass fatness and non-carcass fat content (P, concentrates in the diet from zero to 38% did not 0.001) and reduced (P,0.001) the lean and bone affect DM or energy digestibilities or the ME contents in the fore-rib joint and estimated lean and concentration of the diet, despite the fact that the bone contents in the carcasses (Table 4). There were concentrates would have been expected to have a no significant interactions between the dietary treat- higher ME concentration than the silage. This is ments and slaughter weight for any of the assess- likely to have been due to the depression in fibre ments of carcass fatness. digestibility as the proportion of concentrates in the Although no formal assessment of the effects of diet was increased which is in line with previous the treatments on animal behaviour were made, findings (Steen, 1984; Steen and Robson, 1995). The routine daily observation of the animals during absence of any effect of restricting the DM intake of feeding and management indicated that those given a the diet containing 38% concentrates on the di-restricted intake of food displayed extensive gestibility of any of the components of the diet was stereotype behaviour such as rolling their tongues, consistent across the four digestibility studies, and is while no stereotype behaviours were observed in the in agreement with the results of recent studies with animals which were offered food ad libitum. cattle in which the intake of silage / concentrate diets was restricted (Unsworth et al., 1991; Steen, 1995). The reduction in silage DM intake when the
silages have been supplemented with concentrates Lean gain (g / day)50.378 (S.E. 0.023)C
(Steen, 1984, 1998). 1162 (S.E. 6.6)
2
(R 50.99; P,0.001) (4)
4.1. Effects of energy intake on growth rate and
carcass composition Fat gain (g / day)50.298 (S.E. 0.006)C
1131 (S.E. 1.8) Relationships between concentrate proportion in
2
the diet and daily carcass gain, estimated carcass fat (R 50.99; P,0.001) (5) concentration and estimated rates of lean and fat
where C is the proportion of concentrates in the diet gains have been developed for the four diets offered
(g / kg on DM basis). ad libitum and which contained a constant proportion
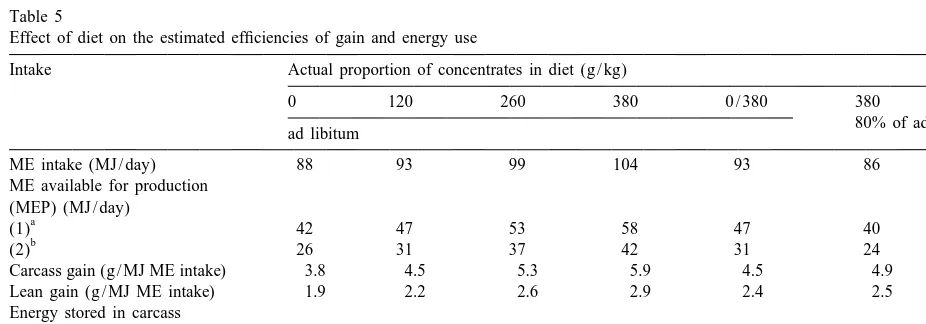
These relationships have been used to predict ME of concentrates throughout the experimental period.
intakes and carcass, lean and fat gains for these These are:
treatments (Table 5). These values together with the actual values obtained for the other two diets have ME intake (MJ / day)50.042 (S.E. 0.007)C
been used to calculate the efficiency with which ME
187.5 (S.E. 2.08) available for production has been stored in the
2 carcass for the six diets (Table 5). For the calculation
(R 50.94; P,0.001) (1)
of ME available for production, maintenance energy requirements given by AFRC (1990) and those Carcass gain (g / day)50.728 (S.E. 0.036)C calculated by Dawson and Steen (1998) have been
used, based on the mean live weight of the animals
1335 (S.E. 10.3)
over the experimental period. For calculation of
2
(R 50.99; P,0.001) (2)
energy stored in the carcass, energy concentrations of 23.6 and 39.3 MJ / kg have been assumed for protein and lipid, respectively. Protein and lipid Carcass fat concentration (g / kg)
concentrations of 220 and 46 g / kg for lean and 34
50.027 (S.E. 0.014)C1228 (S.E. 3.9)
and 850 g / kg for separable fat have been assumed as
2
(R 50.66; P,0.001) (3) these concentrations have been obtained for these
Table 5
Effect of diet on the estimated efficiencies of gain and energy use
Intake Actual proportion of concentrates in diet (g / kg)
0 120 260 380 0 / 380 380
(1) Based on ME requirements for maintenance given by AFRC (1990).
b
used in this study may also have contributed to the forage:concentrate ratio in the diet or reducing lack of an effect of ME intake and growth rate on slaughter weight. Restricting the intake of the diet carcass composition (Langholz, 1977; Geay and containing 380 g concentrates / kg DM reduced car-Robelin, 1979). The reduction in carcass fat content cass fat content by 13 g / kg. This response is of 13 g / kg when the dry matter intake of the diet equivalent to that achieved by reducing slaughter containing 380 g concentrates / kg was restricted by weight by 33 kg or carcass weight by 20 kg. 21%, is close to the reduction of 15 g / kg reported by Similarly offering no concentrates until the animals Steen and Kilpatrick (1995) when the DM intake of were 510 kg live weight and then introducing steers given a similar diet was reduced by a similar concentrates reduced carcass fat content at 560 kg amount. live weight by 18 g / kg, which is equivalent to the The tendency for the fat content in the carcasses of effect of reducing slaughter weight by 45 kg. How-the animals which were given silage only until 510 ever reducing the proportion of concentrates from kg live weight followed by the diet containing 380 g 380 to 120 g / kg (i.e. to the level which produced the concentrates / kg to be lower at 560 kg live weight same carcass gain as that sustained by the restricted than that for the animals given 120 g concentrates / intake of the diet containing 380 g concentrates / kg) kg throughout, and which had the same growth rate, had a minimal effect on carcass fat content, reducing may indicate that the former cattle had a lower it by only 7 g / kg, which was equivalent to the effect proportion of fat in the gain during the early stages of reducing slaughter weight by only 18 kg. Never-of compensatory growth, as this effect has been theless, all three of these approaches to reducing recorded previously in cattle exhibiting compensat- carcass fat content by manipulating the diet reduced ory growth (Wright and Russel, 1991). animal performance by over 30%, reduced the efficiency of carcass gain by 17 to 24% and in-4.2. Effect of slaughter weight creased the time to reach 560 kg live weight, and hence the period of financial investment in the The increase in estimated carcass fat content of 39 animals by about 75 days. Consequently, maintaining g / kg per 100 kg increase in slaughter weight with a relatively high level of performance (1.0 to 1.1 corresponding reductions in lean and bone contents kg / day) and controlling carcass fat content by are in agreement with previous results (e.g. Andersen reducing slaughter weight is likely to be more and Ingvartsen, 1984; Steen and Kilpatrick, 1995). economical than incurring the additional costs asso-The proportional change in non-carcass fat with ciated with the major reduction in performance increasing slaughter weight was greater than that in which is required to induce any appreciable reduc-carcass fat, which was in line with the relative tion in carcass fat content by reducing energy intake. effects of the dietary treatments on carcass and Furthermore, the indication that the animals with non-carcass fats. restricted DM intakes exhibited stereotype behav-The interactions between slaughter weight, plane iours, an effect which has been recorded previously of nutrition and carcass fat content are important in in cattle (Redbo et al., 1996), would strongly militate beef production in terms of meeting the specifica- against this approach to feeding cattle in practice on tions for carcass weight, fatness and conformation the basis of poorer animal welfare (Redbo et al., which are now imposed by wholesalers and retailers 1996).
in cattle due to genotype and level of feeding:
genotype-small to modest effects on carcass fat content
nutrition interaction. Livest. Prod. Sci. 6, 263–276.
compared to the effect of reducing slaughter weight,
Kempster, A.J., Chadwick, J.P., Charles, D.D., 1986. Estimation of
and hence the effects on carcass fat content of the carcass composition of different cattle breeds and crosses reducing energy intake were equivalent to the effects from fatness measurements and visual assessments. J. Agric.
Sci. Cambridge 106, 223–237.
of reducing slaughter weight by only 18 to 45 kg.
Kempster, A.J., Cook, G.L., Smith, R.J., 1980. The evaluation of a
Consequently for cattle reared on high-forage
sys-standardized commercial cutting technique for determining
tems, reducing slaughter weight is likely to be a breed differences in carcass composition. J. Agric. Sci. Cam-more effective approach to controlling carcass fat bridge 95, 431–440.
Kempster, A.J., Cuthbertson, A., Harrington, G., 1982. Beef
content than reducing energy intake during the
carcass grading and classification. In: Carcass Evaluation in
finishing period.
Livestock Breeding, Production and Marketing, Granada, Lon-don, pp. 163–201.
Kirkpatrick, D.E., Steen, R.W.J., Unsworth, E.F., 1997. The effect
Acknowledgements of differing forage:concentrate ratio and restricted feed intake on energy and nitrogen utilization by beef cattle. Livest. Prod. Sci. 51, 151–164.
The authors thank Mr. K. Mathers and the staff of
Langholz, H.J., 1977. Interaction between growth potential and
the Beef Unit for technical assistance and Mr. M. feeding level in beef production. In: Mason, I.L., Pabst, W. Porter and the Laboratory staff for chemical analy- (Eds.), Cross Breeding Experiments and Strategy of Beef
ses. Utilization To Increase Beef Production. Commission of the
European Communities Publication No. 5492e, Commission of the European Communities, pp. 445–466.
McDonald, P., Edwards, R.A., 1976. The influence of conservation
References methods on digestion and utilization of forages by ruminants.
Proc. Nutr. Soc. 35, 201–211.
AFRC Technical Committee on Responses to Nutrients, 1992. Ørskov, E.R., McLeod, N.A., 1990. Dietary induced ther-Report No. 9, Nutritive Requirements of Ruminant Animals: mogenesis and feed evaluation in ruminants. Proc. Nutr. Soc. Protein. Nutrition Abstracts and Reviews (Series B) 62, 787– 49, 227–237.
835. Redbo, I., Emanuelsen, M., Lundberg, K., Oredsson, N., 1996.
Agricultural and Food Research Council, 1990. Technical Com- Feeding level and oral stereotypies in dairy cows. Anim. Sci. mittee on Responses to Nutrients, Report No. 5, Nutritive 62, 199–206.
Requirements of Ruminant Animals: Energy. Nutrition Ab- Reynolds, C.K., Tyrrell, H.F., Reynolds, P.J., 1991. Effects of diet, stracts and Reviews (Series B) 60, 729–804. forage to concentrate ratio and intake on energy metabolism in Agricultural Research Council, 1965. Recommended procedures growing beef heifers, net nutrient metabolism by visceral
for Use in the Measurement of Beef Cattle and Carcasses. tissues. J. Nutr. 121, 1004–1015.
Agricultural Research Council, London. Steen, R.W.J., 1984. A comparison of two-cut and three-cut Agricultural Research Council, 1980. Nutrient Requirements of systems of silage making for beef cattle using two cultivars of
Ruminant Livestock. Commonwealth Agricultural Bureaux, perennial ryegrass. Anim. Prod. 38, 171–179.
Slough, UK. Steen, R.W.J., 1989. A comparison of soyabean, sunflower and fish Andersen, H.R., 1975. The influence of slaughter weight and level meals as protein supplements for yearling cattle offered grass
of feeding on growth rate, food conversion and carcass silage-based diets. Anim. Prod. 48, 81–89.
composition of bulls. Livest. Prod. Sci. 2, 341–355. Steen, R.W.J., 1995. The effect of plane of nutrition and slaughter Andersen, H.R., Ingvartsen, K.L., 1984. The influence of energy weight on growth and efficiency in bulls, steers and heifers of
level weight at slaughter and castration on growth and feed three breed crosses. Livest. Prod. Sci. 42, 1–11.
efficiency in cattle. Livest. Prod. Sci. 11, 559–569. Steen, R.W.J., 1998. A Comparison of forage and High-Baker, R.D., Young, N.E., Laws, J.A., 1992. The effect of diet in concentrate Diets for Beef Cattle. In: 71st Annual Report, winter on the body composition of young steers and subsequent Agricultural Research Institute of Northern Ireland, pp. 30–41. performance during the grazing season. Anim. Prod. 54, 211– Steen, R.W.J., Kilpatrick, D.J., 1995. Effects of plane of nutrition
219. and slaughter weight on the carcass composition of serially
Cuthbertson, A., Harrington, G., Smith, R.J., 1972. Tissue sepa- slaughtered bulls, steers and heifers of three breed crosses. ration — to assess beef and lamb variation. In: Proceedings of Livest. Prod. Sci. 43, 205–213.
the British Society of Animal Production, pp. 112–122. Steen, R.W.J., Robson, A.E., 1995. Effects of forage to concentrate Dawson, L.E.R., Steen, R.W.J., 1998. Estimation of maintenance ratio in the diet and protein intake on the performance and energy requirements of beef cattle and sheep. J. Agric. Sci. carcass composition of beef heifers. J. Agric. Sci. Cambridge
Cambridge 131, 477–485. 125, 125–135.
1998. Responses in the growth of body components of finish- Kilpatrick, D.J., 1991. Energy retention in steers as measured ing lambs to additional metabolisable energy supplied from by respiration calorimetry and carcass composition. In: Wenk, either grass silage or concentrates. Anim. Sci. 67, 503–512. C., Boessinger, M. (Eds.), Energy Metabolism of Farm Ani-Thomas, D., Gibbs, B.G., Beever, D.E., Thurnham, B.R., 1988. mals. Proceedings of the 12th Symposium (EAAP Publication
The effect of date of cut and barley substitution on gain and on No. 58), EAAP, Zurich, pp. 190–193.