Mercury and Radionuclides in Sediments of the Ka{tela Bay (Croatia)
– Evaluation of the Sediment Pollution History*
Nevenka Mikac,
a,** Delphine Foucher,
b@eljko Kwokal,
aand Delko Bari{i}
a aDivision for Marine and Environmental Research, Ru|er Bo{kovi} Institute, 10000 Zagreb, Croatia b
Department of Chemistry, University of Trent, 1600 West Bank Dr. Peterborough, Ontario, K9J 7B8, Canada
RECEIVED MAY 9, 2005; REVISED NOVEMBER 7, 2005; ACCEPTED NOVEMBER 11, 2005
Mercury and radionuclides (natural U and its decay series products and artificial137Cs) were measured in sediments of the Ka{tela Bay (eastern Adriatic coast) in the vicinity of a former chloralkali plant. The depth distributions of radionuclides and mercury revealed that sediments in front of the factory represent a mixture of natural sediment and coal ash originating from the coal used in the factory power plant. Based on this data, the hypothesis that the coal ash from the factory power plant was dumped into the sea was confirmed, and it was estimated (from 137Cs depth profile) that the dumping happened between 1986 and 1991. Data on the artificial radionuclide137Cs was shown to be very useful for evaluation of the sediment pollution history even in such very disturbed sediments. Future monitoring of mercury pollution and radionuclides in the Ka{tela Bay is suggested.
Keywords mercury radionuclides Ka{tela Bay pollution history
* Dedicated to the memory of the late Professor Marko Branica.
** Author to whom correspondence should be addressed. (E-mail: mikac@irb.hr)
ISSN-0011-1643
CCA-3068
Original Scientific Paper
INTRODUCTION
Mercury is one of the most hazardous environmental contaminants. Sources of mercury emission into the en-vironment can be divided into three categories:1natural,
anthropogenic and re-emitted sources (mercury remobi-lization from settled sources). For a long time mercury was considered to be only a local/regional contaminant, but its widespread use, as well as efficient cycling be-tween different environmental compartments2has led to
global contamination by this element, which was a key finding of the Global Mercury Assessment Report of UNEP in 2002.3Historically, chloralkali plants were
ma-jor local mercury pollution sources. After it was discov-ered in the 1970s that mercury can be methylated in se-diment4 and further biomagnificated in certain aquatic
food chains,2which may result in dangerously high
con-centrations of methyl mercury in fish, chemical plants in developed countries were mostly closed in the early 1980s. Closing mercury polluting industries in develop-ing countries was a much slower process.1 Mercury is
persistent in the environment, and mercury polluted aquatic systems, in which mercury is buried in sediments, constitute long-term mercury sources.5,6For less
pollut-ed systems, natural attenuation (decrease of contamina-tion by naturally occurring processes such as hydrody-namic flow, bioturbation, molecular diffusion, chemical transformations) may be sufficient to efficiently reduce mercury levels in contaminated aquatic systems. This process is usually very slow and a contaminated system should be regularly monitored to ensure environmental safety.
The most serious environmental problem of local pollution by mercury in Croatia occurred in the Ka{tela Bay (central part of the Eastern Adriatic coast) follow-ing 40 years activity (1950–1990) of a chloralkali plant located on the northeastern coast of the Bay. It was esti-mated that at least 22 and at most 56 tons of mercury (estimated from the literature data on the range of Hg loss per ton of produced chlorine) have been altogether intro-duced into the bay.7,8 Numerous investigations9–13 have
demonstrated elevated mercury concentrations in sedi-ments and substantial bioaccumulation of total and methyl mercury in marine organisms (fish, shellfish, plankton) of this area.9,12 Efficient transport of mercury from the
point source of pollution is evident from the elevated mercury levels in sediments of the entire bay (0.1–10 mg/kg),9,14compared to the mercury level in sediment of
the open Adriatic Sea (0.1 mg/kg).15A few years before
the factory was closed (1985/86), an attempt to model the fate of mercury in the Bay demonstrated that the resi-dence time of mercury in sediments was relatively short (less than 10 years), and that the majority of the mercury introduced into the Bay during 35 years of the factory operation was already dispersed to great distances from the point source.8 It was suggested that the principal
pathway of mercury transport was resuspension of highly contaminated sediment from the shallow part of the bay (in front of the factory) during storm events and transport of fine sediment particles (which contain most mercury) toward the entrance of the bay. However, more recent studies demonstrated very high concentrations of total mercury (up to 70 mg/kg) in sediments located in front of the factory10,16 Further, it has been shown that
the conditions in sediments are favorable for mercury methylation, and unusually high levels of methyl mer-cury (up to 50 mg/kg) were observed in these sedi-ments.16In addition to mercury pollution, it was recently
suspected that sediments of the bay are contaminated by uranium and its natural decay series radionuclide prod-ucts originating from coal burning in the thermoelectric unit of the factory. The coal used in this small power
plant was naturally enriched in uranium17and the
residu-al coresidu-al ash was deposited in the vicinity of the factory and protected with plastic foil and humus. However, re-cently found elevated concentrations of uranium in these coastal sediments17indicate that at one time this mixture
might also have been dumped into the sea.
In order to elucidate the fate of mercury deposited in sediment and to evaluate the pollution history of these sediments, several sediment cores were sampled in front of the chloralkali plant and analyzed for mercury and radionuclide contents.
EXPERIMENTAL
Sampling Area and Sediment Sampling
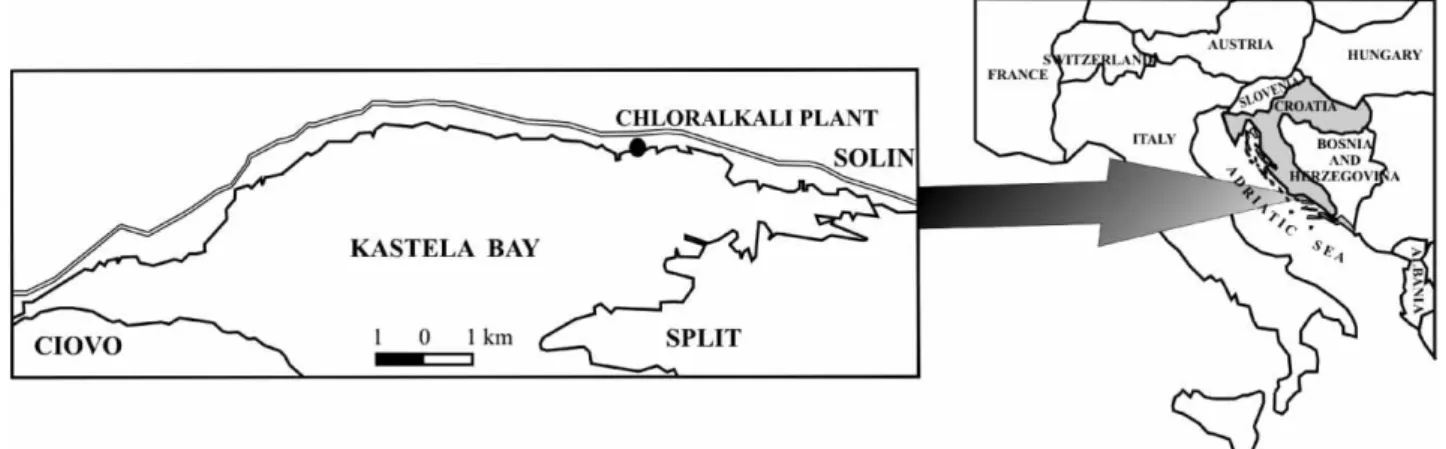
The Ka{tela Bay is situated in the central part of the eastern Adriatic coast (Figure 1) and represents a semi-enclosed bay with a total area of 60 km2, average depth of 23 m, and a
volume of approximately 1.4 km3. In addition to the
chloralkali plant (Figure 1), which was the source of mer-cury contamination, there are also a cement plant, an iron plant, a shipyard and an electroplating facility on the same northeaster bay coastline, making the Ka{tela Bay one of the most polluted bodies of water on the eastern Adriatic coast.
Sediment cores were sampled in June 2000, February and October 2001 in front of the chloralkali plant (at a dis-tance of about 50 m from the shore) by scuba divers. Cores were taken using short (20 cm long, 10 cm diameter) and long (45 cm long, 5 cm diameter) plastic tubes. Cores were immediately sliced under a nitrogen atmosphere into 2 cm (short cores) or 5 cm (long cores) slices; porewater from short cores was extracted by centrifugation and the residual sediment was conserved frozen until analyses. Several sam-ples of coal ash were sampled in February 2001 at 3 differ-ent locations from the old deposits in front of the ancidiffer-ent factory.
Sediment Preparation and Analyses
For mercury determination, a portion of sediment or coal ash was dried at room temperature and homogenized in an
agate mortar. About 0.2 g of sample was digested with HNO3in a hot plate at 150 °C for 4 hours and adequately
diluted for analysis. Mercury was detected by cold vapor atomic fluorescence spectroscopy (CV AFS) after SnCl2
re-duction. The configuration includes a vapor generator (PSA 10.003), a gold platinum trap (PSA 10.501 Galahad) and a fluorescence detector (PSA 10.023 Merlin), and is de-scribed in detail elsewhere16,18Organic and inorganic
car-bon (Corg and Cinorg) were measured by a LECO CHNS
932 Analyzer.16After the total carbon was determined, the
sediment was heated for 12 h at 400 °C to decompose or-ganic matter so that the second determination gave values of Cinorg. Organic carbon values were calculated from the
difference.
For radionuclide activity analysis, samples were dried at 105 °C to constant weight. Then, sediments were placed in a counting vessel of known geometry, sealed and stored for at least 4 weeks to allow ingrowth of gaseous222Rn.
Gamma-spectrometry measurements were performed using a HPGe semiconductor detector connected to a 8192 chan-nel analyzer »Canberra«. Spectra were recorded for 80000 s and processed on a PC using GENIE 2K software. The
137Cs activity was calculated from 661.6 keV-peak, 40K
from the 1460.7 keV-peak,226Ra from the 609.3 keV-peak
of its214Bi progeny,228Ra (232Th) from the 911.1 keV-peak
of its 228Ac progeny, and 235U (after subtraction of the
overlapping226Ra peak) from 186 keV-peak.19,20Activities
of238U were calculated from the235U activity assuming the 235U/238U activity ratio of 0.04603.21
RESULTS AND DISCUSSION
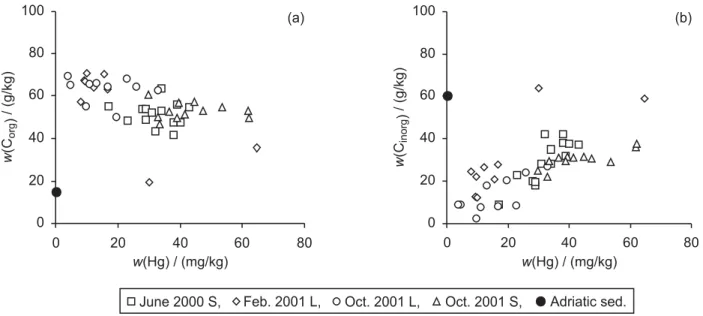
The relationship between mercury and organic and inor-ganic carbon is presented in Figures 2a,b. The observed negative trend (r= –0.558,n= 45) between mercury and
Corgand the positive trend between mercury and Cinorg(r
= 0.712) are very unusual for natural sediments. In all 4 cores, correlation between Hg and Corg is negative, but
with a variable correlation coefficient (from r= –0.090 to r = –0.705), whereas correlation between Hg and Cinorgis positive with highly significant correlation
coef-ficients in all cores (from r = 0.735 to r = 0.827). Typically, positive correlation between Hg and Corg is
found both in aquatic sediments22and in suspended
mat-ter,23as a consequence of high affinity of organic matter
for complexation of mercury ion.24 Lack of a
relation-ship between Hg and Corgin aquatic sediments has been
frequently observed as well,18but there are no examples
in the literature of the negative correlation between Hg and Corg. Inorganic carbon in these sediments is present
in the form of carbonates, which is the main component of the coarse fraction of this calcareous sediment.25 A
decrease in metal concentration with an increase of coarse sediment fraction (e.g.,carbonates) would be ex-pected, since it is well known that metals in sediments are preferentially bound to fine particles,22,23,25whereas
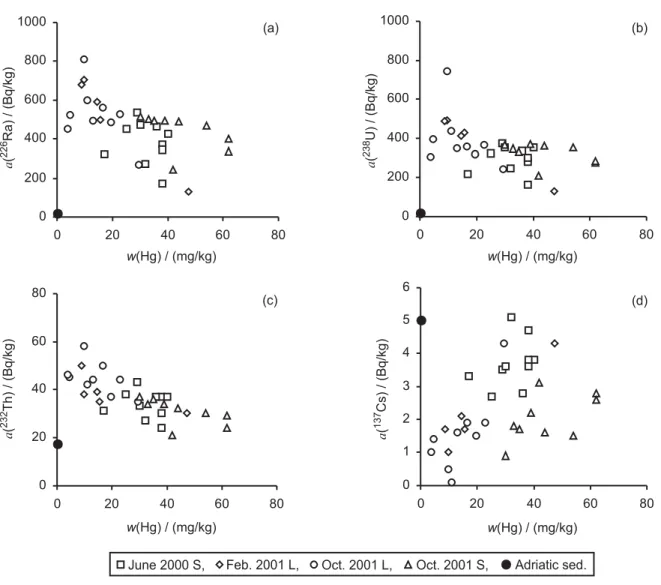
the coarse fraction serves as a »dilutor« of the metal concentration in unfractionated sediment. Mercury in sediments demonstrated a negative correlation with nat-ural radionuclide226Ra (Figure 3a)238U (Figure 3b) and 232Th (Figure 3c), but a positive correlation with the
arti-ficial radionuclide 137Cs (Figure 3d). If we examine Hg
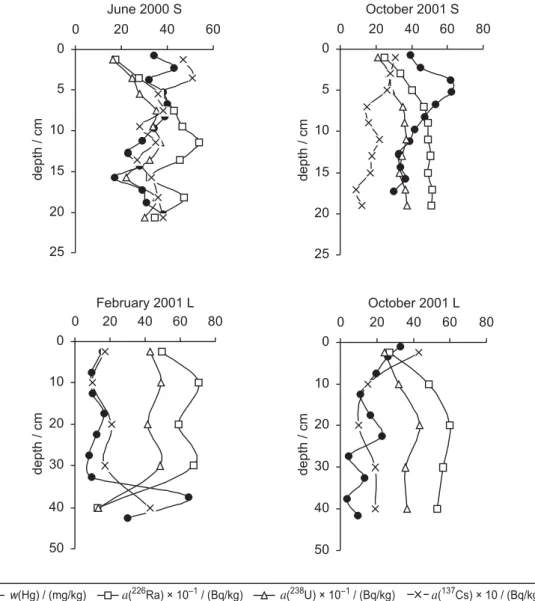
and radionuclide depth profiles in four analyzed cores (Figure 4), we can see that in both long cores Hg and
137Cs demonstrate very similar depth profiles, which
mirror the depth profiles of226Ra and 238U. These
pro-files match the obtained positive/negative correlations between Hg and radionuclides when all samples are taken into account. Obtained correlations are less
sup-0 20 40 60 80 100 0 20 40 60 80
June 2000 S, Feb. 2001 L, Oct. 2001 L, Oct. 2001 S, Adriatic sed.
0 20 40 60 80 100 0 20 40 60 80 w(Hg) / (mg/kg) w(Hg) / (mg/kg) w (C ) / (g/kg) org w (C ) / (g/kg) inorg (a) (b)
Figure 2.Relationship between mercury and a) organic carbon (Corg) and b) inorganic carbon (Cinorg) in sediments sampled in front of
the chloralkali plant. (Mass fractions,w, are given.) For comparison, typical values for sediment from the eastern Adriatic coast are also shown (data from Table I). L – long, S – short sediment cores sampled.
ported by depth profiles found in short cores, since no obvious trends in Hg and radionuclide profiles are visi-ble. Rather uniform depth profiles up to a sediment depth of about 20 cm could be a consequence of me-chanical mixing of the surficial sediment layer by waves or by bioturbation. Cores were sampled in the shallow part of the bay at a depth of about 10 m where mixing of surface sediment during storm events is highly
possi-ble.14It was found that the sediment near the coast
con-tains a larger fraction of coarse material (50–70 %), whereas the sediment in the center of the bay is predomi-nantly composed of fine particles.14,25This is explained
by the transport of resuspended fine sediment particles from the shallow part of the bay and their deposition un-der the depth of the wave base (from 10 to 20 m for the Ka{tela Bay). It has actually been suggested8 that 0 200 400 600 800 1000 0 20 40 60 80 0 200 400 600 800 1000 0 20 40 60 80 0 1 2 3 4 5 6 0 20 40 60 80 0 20 40 60 80 0 20 40 60 80 w(Hg) / (mg/kg) w(Hg) / (mg/kg) w(Hg) / (mg/kg) w(Hg) / (mg/kg) (a) (b) a ( T h) / (Bq/kg) 232 a ( R a) / (Bq/ k g) 226 a (C s ) / (B q /k g ) 137 a ( U ) / (Bq/kg) 238 (c) (d)
June 2000 S, Feb. 2001 L, Oct. 2001 L, Oct. 2001 S, Adriatic sed.
Figure 3.Relationship between mercury and natural radionuclides226Ra (a) and238U (b)232Th (c) and artificial radionuclide137Cs (d) in
sediments in front of the chloralkali plant. (Mass fraction,w(Hg) and specific radioactivity,a, of radionuclides are given.) For comparison, typical values for sediment from the eastern Adriatic coast are also shown (data from Table I).
TABLE I.Ranges and average values of some parameters in coal ash and sediments from the Ka{tela Bay and the eastern Adriatic coast
Sample type w(Hg) (mg/kg) w(Cinorg) (g/kg) w(Corg) (g/kg) a(226Ra) (Bq/kg) a(238U) (Bq/kg) a(238U) a(226Ra) a(232Th) (Bq/kg) a(40K) (Bq/kg) a(137Cs) (Bq/kg) Coal ash 1.8–22.0 8.8±12.0 12–23 17±6 37–70 49±18 820–1410 1170±315 570–860 745±155 0.64 34.0–62.0 52.5±16.0 200–250 220±30 0.8–1.0 0.9±0.1 Ka{tela Bay sediment 3.8–64.8 27.6±14.5 8–64 26±12 35–87 54±6 130–810 460±145 130–750 345±110 0.76 21.0–58.0 36.5±8.0 230–370 295±30 0.5–5.1 2.4±1.2 Sediment from
Adriatic coast(a)
0.1–0.4 45–90 10–20 18–22 18.5±4.0
16–23 17.6±4.3
0.95 16.8±6.5 220±120 5–10 (a)Data for the eastern Adriatic coast from Refs. 13 and 26;137Cs values apply to recent sediment collected after the Chernobyl accident.
resuspension of fine sediment particles rich in mercury, which were originally deposited in front of the chlor-alkali plant, and their transport by currents and waves represent the main pathway of dispersing mercury from the point source of contamination.
If we compare natural radionuclide levels measured in four analyzed cores with those in sediments from the Adriatic Sea (Figure 3 and Table I), we note that concen-trations of226Ra and238U are on average about 20 times
higher in the Ka{tela Bay sediments than in sediments from the eastern Adriatic coast. Concentrations of232Th
are somewhat higher or similar to those in the Adriatic sediments, whereas concentrations of 40K are equal in
the sediments of the bay and from the remaining part of the eastern Adriatic coast (for this reason40K data are
not presented).
(According to IUPAC the quantity used here and called "concentration" should systematically be called "mass fraction",w.)30
Our results are some of the first evidence for the contamination of recent marine sediments in the Ka{tela Bay by radionuclides. More recent data (samples taken in 2004)17 on the 226Ra and 238U levels in sediments
taken in the vicinity of the factory (2.5 km to the left and to the right of the chloralkali plant) confirm the presence of high levels of radionuclides of the uranium decay se-ries in sediments around the former chloralkali plant. To confirm the origin of226Ra and238U in these sediments,
a few samples of coal ash were collected on the shore at several locations near the factory and analyzed for radionuclides, Hg and organic/inorganic carbon (Table I). Very high levels of 226Ra and 238U are evident in
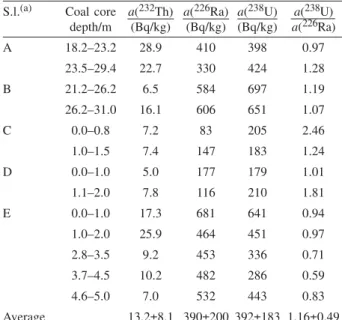
these coal ash samples. As mentioned above, the coal used in the factory power plant, originating from Istria, Dalmatia or Herzegovina mines, was naturally enriched in uranium. As an example, activities of226Ra and238U
found in several coal cores collected in 1993 in one of the coal mines, used to supply the power unit in the
fac-February 2001 L 0 10 20 30 40 50 0 20 40 60 80 October 2001 L 0 10 20 30 40 50 0 20 40 60 80 June 2000 S 0 5 10 15 20 25 0 20 40 60 October 2001 S 0 5 10 15 20 25 0 20 40 60 80 dept h / cm dept h / cm dept h / cm dept h / cm w(Hg) / (mg/kg) a(226Ra) × 10–1/ (Bq/kg) a(238U) × 10–1/ (Bq/kg) a(137Cs) × 10 / (Bq/kg)
Figure 4.Depth profiles of mercury and radionuclides226Ra,238U and137Cs in four sediment cores sampled in front of the chloralkali
tory, are given in Table II. It is evident that this coal con-tained high concentrations of226Ra and238U, which are,
however, lower than those in the coal ash by a factor of 2–3 (Table I). Higher concentrations of radionuclides in the coal ash than in the coal are a consequence of the concentration of these elements during the burning pro-cess; they are not volatile, so they are preserved in a much smaller volume of the coal residue after burning. Concentrations of226Ra and238U in coal ash were on
av-erage 3 times higher, and for137Cs on average 3 times
lower than in the Ka{tela Bay sediments. Coal ash also contains much lower concentrations of Hg (3 times
lower), and a significantly lower content of inorganic carbon, whereas levels of organic carbon are comparable in coal ash and sediment. There are therefore two types of particulate material from which sediment in front of factory is thought to be composed: coal ash, which is poor in Cinorg, Hg and 137Cs but rich in226Ra and238U,
and coastal sediment, which is rich in Cinorgand Hg but
poor in226Ra and238U. Positive correlation between Hg
and Cinorg (Figure 2b), negative correlation between Hg
and natural radionuclides (Figures 3a,b) and positive correlation between Hg and 137Cs (Figure 3c) all
indi-cate that the sediment in front of the factory indeed rep-resents a mixture of coal ash and natural sediments. If we examine Hg and radionuclide profiles (Figure 4), es-pecially the depth profiles obtained in long cores, we can see that these two materials are mixed in a very ir-regular manner. In some cores an Hg maximum and a minimum of radionuclides are found at the bottom of the core (February 2001), and in others at the surface (Octo-ber 2001). In an attempt to estimate the fraction of coal ash present in sediment, we calculated the percentage of coal ash from the difference in concentration of radionuclides present in coal ash and in sediment by the formula:
(coal ash (x)) / % =[226Ra
(x)–226Ra(o)]/[226Ra(coal ash)]
where: coal ash (x) = estimated fraction of coal ash in sediment layer x expressed in percents; 226Ra
(x) =
radionuclide activity of layer x;226Ra
(o)= average
back-ground activity of sediment from the Croatian coast (Ta-ble I), and 226Ra
(coal ash) = average radionuclide activity
of coal ash (Table I).
Profiles of the estimated fractions of coal ash in sedi-ment cores are presented in Figure 5. They confirm that TABLE II.Activities of232Th,226Ra and238U in coal cores of Tu{nica
region in Livanjsko polje (Bosnia and Herzegovina), sampled in 1993
S.l.(a) Coal core depth/m a(232Th) (Bq/kg) a(226Ra) (Bq/kg) a(238U) (Bq/kg) a(238U) a(226Ra) A 18.2–23.2 28.9 410 398 0.97 23.5–29.4 22.7 330 424 1.28 B 21.2–26.2 6.5 584 697 1.19 26.2–31.0 16.1 606 651 1.07 C 0.0–0.8 7.2 83 205 2.46 1.0–1.5 7.4 147 183 1.24 D 0.0–1.0 5.0 177 179 1.01 1.1–2.0 7.8 116 210 1.81 E 0.0–1.0 17.3 681 641 0.94 1.0–2.0 25.9 464 451 0.97 2.8–3.5 9.2 453 336 0.71 3.7–4.5 10.2 482 286 0.59 4.6–5.0 7.0 532 443 0.83 Average 13.2±8.1 390±200 392±183 1.16±0.49 (a)S.l., sampling locations.
0 5 10 15 20 25 0 20 40 60 80 June 2000 S 0 10 20 30 40 50 0 20 40 60 80 February 2001 L 0 10 20 30 40 50 0 40 80 120 October 2001 L 0 5 10 15 20 25 0 20 40 60 80 October 2001 S depth / c m
ash/% (226Ra) ash/% (238U)
Figure 5.Coal ash mass fractions, expressed in percents, in sediments in front of the chloralkali plant calculated from the specific radioactivity of natural radionuclides226Ra and238U.
sediment and coal ash are mixed in a very irregular man-ner, both regarding the amount of coal ash in sediment, which varies from 15 % to almost 100 %, as well as re-garding the depth distribution. In the core sampled in February 2001, coal ash is almost absent at a depth of about 50 cm, whereas in the core sampled in October 2001 at the approximately same location, the bottom of the core is composed almost entirely of coal ash. In the first 20 cm of the sediment, the fraction of coal ash is fairly constant (20–40 %) and is clearly decreasing to-ward the surface in the first 10 cm. Knowing that the factory was closed in 1990, and that samples were taken 10 years later (in 2000/2001), we can presume that these first 10 cm of sediment, where the radionuclide level is regularly decreasing (Figure 4), were deposited after 1990. From this assumption, we can roughly estimate the sedimentation rate at this location to be 1 cm/year. In the first 10 cm mercury decreases toward the surface in two of four cores (Figure 4), demonstrating no clear trend in diminishing mercury concentration in the sedi-ment layer deposited after the closing of the factory. This can be most probably explained by taking into ac-count the fact that sediment deposited even closer to the factory is much more contaminated by mercury (con-tains up to 200 mg/kg of Hg)16and thus still represents a
continuous source of Hg for sediment deposited further away from the factory. The natural sedimentation rate in the Ka{tela Bay was measured by Tudor8using sediment
traps. He estimated the sedimentation rate in front of the factory (approximately at the same distance from the coast as the location where our sediment cores were taken) to range from 7–25 mm/year, the value which agrees with our estimation of 1 cm/year.
In undisturbed sediments, the concentration of137Cs
can be effectively used for sediment dating and for evalu-ation of the sediment pollution history.27,28It is known
that Mediterranean sediment deposited after the Chernobyl accident (1986) contained elevated concen-trations of137Cs, which generally ranged between 5 and
10 Bq/kg,28whereas older sediments normally contain <
1 Bq/kg of 137Cs. As the Ka{tela Bay sediments are
ob-viously heavily disturbed by human activities, the mer-cury pollution history cannot be precisely evaluated from 137Cs profiles. Additionally, in the mid 1990s and
later, a large amount of flyash and other soil or waste material were intensively dumped into the sea in front of the western part of the chloralkali plant. However, from the rather high concentrations of137Cs in all cores, and
especially from the high concentration observed at the bottom of the core sampled in February 2001 (Figure 3), we can conclude with certainty that sediments up to a depth of 50 cm were deposited after 1986. If the sedi-mentation rate is about 1 cm/year, 50 cm of sediment should represent the sediment deposited over the last 50 years, but according to the137Cs concentrations, it
repre-sents sedimentation of less than the last 15 years. This difference agrees with the estimated fractions of coal ash in sediment (Figure 4), which suggests that at least half of the sediment at this location is composed of coal ash that was dumped into the sea between 1986 and 1991.
To get some insight into the fate of radionuclides dumped into the sediment and their impact on the eco-system, it is interesting to examine the ratio of238U and 226Ra (Figure 6). Depth profiles of this ratio showed that
it is significantly less than 1.0 in all cores, except in the surface and bottom layers. In the original material (coal) this ratio should be about 1 (and it is exactly 1.0 if we calculate it from the average values of 226Ra and238U,
Table II). However, in the coal ash this ratio is signifi-cantly lower than 1 (Table I) and is similar to the one found in sediment. The much lower ratio in sediment and coal ash than in the coal is a consequence of the much higher solubility of uranium than radium in water (especially in seawater), which results in greater mobil-ity of uranium compared to radium. Leaching experi-ments with seawater performed on the coal ash sampled in 2004 (1 g of coal ash was extracted with 10 ml of sea-water for 24 h) demonstrate that up to 37 % of uranium was transferred into solution.29Lower ratios in coal ash
suggest that uranium from the coal ash has been already partly leached due to regular washing of the coal ash de-posited on the coast by rainwater and seawater (during stormy weather) over time. The ratio of238U and226Ra
in natural sediment is also about 1 (Table I), so the sedi-ments in front of the factory (which are a mixture of nat-ural sediment and coal ash) show a higher238U/226Ra
ra-tio than in the coal ash itself. Values close to 1 in the surface layer of all cores support the conclusion that the
0 10 20 30 40 50 0,6 0,7 0,8 0,9 1,0 1,1 a(238U)/ (a226Ra) dept h / cm
June 2000 S, Feb. 2001 L, Oct. 2001 L, Oct. 2001 S Figure 6.Depth profiles of the ratio238U /226Ra in four sediment
surface layer is composed mainly of newly deposited natural material (natural sediment or flysch material) with a238U/226Ra ratio about 1. These data indicate that
uranium in sediment is highly mobile, and that it will not stay buried in the sediment but will be transferred from the particulate to dissolved phase and further by diffu-sion processes to the water column, and thus to a greater distance from the source.
CONCLUSIONS
From the data presented in this work, we conclude that sediments of the Ka{tela Bay are, in addition to mercury, also contaminated with uranium and its decay series radio-nuclides. Until now, contamination with radionuclides was observed in the vicinity of the former chloralkali plant, which was the source of both mercury and radionuclides. Data on the artificial radionuclide 137Cs
was shown to be very useful for the evaluation of the sediment pollution history, even in such very disturbed sediments. On the basis of Hg, U and its decay series radionuclides and137Cs data, the hypothesis that the coal
ash from the factory power plant was dumped into the sea was confirmed and it was estimated (from 137Cs
depth profiles) that the dumping happened between 1986 and 1991.
The question arises of the consequences of these findings for the Ka{tela Bay ecosystem, which is already considered to be one of the most endangered aquatic systems along the eastern Adriatic coast. Despite the fact that severe mercury contamination of this area was de-tected already decades ago, there is a lack of data about the fate of mercury in this area and especially on the transfer of toxic organic forms of mercury (methyl cury) in the marine food chain. Data on the high mer-cury level in sediments even 15 years after the closing of the chloralkali plant, coupled with newly discovered contamination by natural radionuclides in the vicinity of the factory, suggest that continuous monitoring of these parameters should be carried out, as well as investiga-tions into the distribution of mercury and radionuclides in both abiotic (water, sediment) and biotic (marine or-ganisms) compartments in the entire bay area.
Acknowledgement.– This work was supported by the Ministry of Science, Education and Sports of the Republic of Croatia. Additional funding was provided by the COGITO Project.
REFERENCES
1. Q. Wang, D. Kim, D. D. Dionysiou, G. A. Sorial, and D. Timberlake,Environ. Pollut.131(2004) 323–336. 2. E. D. Stein, Y. Cohen, and A. M. Winer,Crit. Rev. Environ.
Sci. Technol.26(1996) 1–43.
3. UNEP Mercury Program, Global Mercury Assessment homepage: http://www.chem.unep.ch/mercury/
4. S. M. Urlich, T. W. Tanton, and S. A. Abdrashitova,Crit. Rev. Environ. Sci. Technol.31(2001) 241–293.
5. C. Trombini, D. Fabbri, M. Lombardo, I. Vassura, E. Zavoli, and M. Horvat, Continental Shelf Sci. 23 (2003) 1821– 1931.
6. L. G. Belluci, M. Frignani, D. Paolucci, and M. Ravanelli,
Sci. Total Environ.295(2002) 35–49.
7. N. Mikac and M. Picer,Kem. Ind.33(1984) 653–660. 8. M. Tudor, PhD thesis, University of Zagreb, 1993 (in
Cro-atian).
9. N. Mikac, M. Picer, P. Stegnar, and M. Tu{ek-@nidari}, Wa-ter Res.19(1985) 1387–1392.
10. @. Kwokal, S. Fran~i{kovi}-Bilinski, H. Bilinski, and M. Branica,Mar. Pollut. Bull.44(2002) 1150–1155. 11. T. Zvonari}, RMZ – Materials and Geoenvironment 48
(2110) 235–240.
12. S. ^ulin and T. Zvonari},Food Technol. Biotechnol. Rev.
33(1995) 133–137.
13. D. Martin~i}, @. Kwokal, M. Stoeppler, and M. Branica,Sci. Total Environ.84(1989)135–147.
14. D. Bogner, MSc thesis, University of Zagreb, 1996 (in Cro-atian).
15. R. Ferrara and B. E. Maserti,Mar. Chem.38(1992) 237– 249.
16. D. Foucher, PhD thesis, University of Lille, 2002 (in French). 17. V. Ore{~anin, D. Bari{i}, I. Lovren~i}, L. Mikeli}, M.
Roz-mari}-Macefat, G. Pavlovi}, S. Luli}, and L. Ga{parovi},
Environ. Geol.49(2005) 53–64.
18. N. Mikac, S. Niessen, B. Ouddane, and M. Wartel,Applied Organomet. Chem.13(1999) 715–725.
19. D. Bari{i}, Proc. XV JDZZ Symp., 1989, pp. 91–94 (in Croatian).
20. A. Martinez-Lobo and J. Palomares,J. Rad. Nucl. Chem.-Art.147(1991) 225–234.
21. A. S. Murray and M. J. Aitken,Int. J. Appl. Radiat. Isot.38 (1988) 145–158.
22. C. Gagnon, E. Pelletier, and A. Mucci,Mar. Chem.59(1997) 159–176.
23. A. Turner, G. E. Millwared, and S. M. Le Roux,Mar. Chem. 88(2004) 179–192.
24. M. Ravichandran,Chemosphere55(2004) 319–331. 25. D. Bogner, M. Jura~i}, N. Od`ak, and A. Bari},Water. Sci.
Technol.38(1998) 169–175.
26. D. Bari{i}, A. Verta~nik, S. Luli}, G. Mihel~i}, I. Sondi, M. Jura~i}, E. Prohi}, and R. Crmari},Rapp. Comm. Int. Mer. Medit.35(1988) 228–229.
27. P. H. Santchi, M. A. Allison, S. Asbill, A. B. Perlet, S. Cap-pellino, C. Dobbs, and L. Mcshea,Environ. Sci. Technol.33 (1999) 378–391.
28. R. A. Ligero, M. Barrera, M. Casas-Ruiz, D. Sales, and F. Lopez-Aguayo,Environ. Pollut.118(2002) 97–108. 29. V. Ore{}anin, D. Bari{i}, L. Mikeli}, I. Lovren~i}, M.
Roz-mari}-Ma~efat, and S. Luli}, Proc. 6thCroatian Radiation Protection Association Symp., 2005, pp. 339–344. 30.Quantities, Units and Symbols in Physical Chemistry,
SA@ETAK
U sedimentu Ka{telanskog zaljeva u blizini biv{e tvornice klor-alkalija (pogon elektrolize tvornice "Jugo-vinil") mjereni su `iva i radionuklidi (prirodni uran i njegovi raspadni produkti, te umjetni radionuklid137Cs). Profili radionuklida i `ive u sedimentu pokazali su da sediment ispred tvornice predstavlja smjesu prirodnog sedimenta i pepela iz ugljena koji je kori{ten u tvorni~koj energani. Temeljem dobivenih podataka potvr|ena je hipoteza da je pepeo iz tvorni~ke energane odlagan u obalno more, te je procijenjeno (iz profila137Cs u se-dimentu) da se to dogodilo izme|u 1986. i 1991. godine. Pokazalo se da su podaci o137Cs u sedimentu vrlo korisni za evaluaciju historijata zaga|ivanja sedimenta ~ak i u slu~aju tako poreme}enih sedimenata. Sugerira se pra}enje stanja zaga|enja Ka{telanskog zaljeva `ivom i radionuklidima.