On: 03 Sept em ber 2013, At : 19: 03 Publisher : Rout ledge
I nfor m a Lt d Regist er ed in England and Wales Regist er ed Num ber : 1072954 Regist er ed office: Mor t im er House, 37- 41 Mor t im er St r eet , London W1T 3JH, UK
Accounting and Business Research
Publ icat ion det ail s, incl uding inst ruct ions f or aut hors and subscript ion inf ormat ion: ht t p: / / www. t andf onl ine. com/ l oi/ rabr20
Financial performance explanations and institutional
setting
Wal t er Aert s a & Ann Tarca b a
Prof essor in t he Depart ment of Account ing and Finance, Universit y of Ant werpen, Facul t y of Appl ied Economics, 13 Prinsst raat , Ant werpen, B‐2000, Bel gium Phone: +32 3265 4110 Fax: +32 3265 4110 E-mail :
b
Prof essor at UWA Business School , Universit y of West ern Aust ral ia Publ ished onl ine: 04 Jan 2011.
To cite this article: Wal t er Aert s & Ann Tarca (2010) Financial perf ormance expl anat ions and inst it ut ional set t ing, Account ing and Business Research, 40: 5, 421-450, DOI: 10. 1080/ 00014788. 2010. 9995322
To link to this article: ht t p: / / dx. doi. org/ 10. 1080/ 00014788. 2010. 9995322
PLEASE SCROLL DOWN FOR ARTI CLE
Taylor & Francis m akes ever y effor t t o ensur e t he accuracy of all t he infor m at ion ( t he “ Cont ent ” ) cont ained in t he publicat ions on our plat for m . How ever, Taylor & Francis, our agent s, and our licensor s m ake no r epr esent at ions or war rant ies w hat soever as t o t he accuracy, com plet eness, or suit abilit y for any pur pose of t he Cont ent . Any opinions and view s expr essed in t his publicat ion ar e t he opinions and view s of t he aut hor s, and ar e not t he view s of or endor sed by Taylor & Francis. The accuracy of t he Cont ent should not be r elied upon and should be independent ly ver ified w it h pr im ar y sour ces of infor m at ion. Taylor and Francis shall not be liable for any losses, act ions, claim s, pr oceedings, dem ands, cost s, expenses, dam ages, and ot her liabilit ies w hat soever or how soever caused ar ising dir ect ly or indir ect ly in connect ion w it h, in r elat ion t o or ar ising out of t he use of t he Cont ent .
This ar t icle m ay be used for r esear ch, t eaching, and pr ivat e st udy pur poses. Any subst ant ial or syst em at ic r epr oduct ion, r edist r ibut ion, r eselling, loan, sub- licensing, syst em at ic supply, or dist r ibut ion in any
Financial performance explanations and
institutional setting
Walter Aerts and Ann Tarca
*Abstract–The aim of this study is to investigate whether country differences in the institutional setting forfinancial
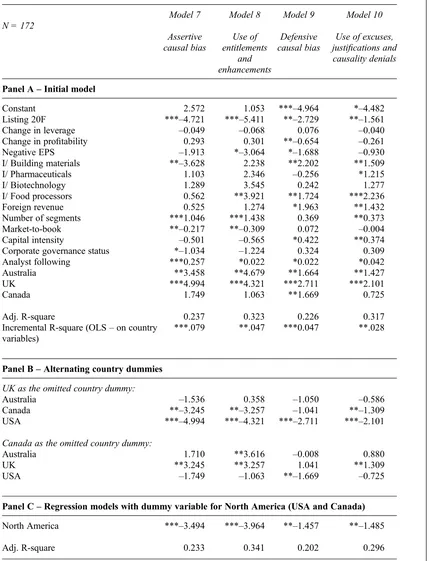
reporting affect the attributes of managers’explanations of performance in management commentary reports. We include 172 listed companies fromfive industries (building materials, food processors, pharmaceuticals, biotechnology and retail) in the UK, Australia, the USA and Canada in 2003. Wefind significant country differences in attributional properties of performance explanations in management commentary reports. The US and Canadian companies are generally less assertive and less defensive in causal explanations offered compared to their counterparts in the UK and Australia. The North American companies are also more extensive and formal in their explanations, relying more heavily on technical-accounting language. These tendencies are most pronounced in the USA, where the aggregate of private and public enforcement is greatest. Taken together, our evidence suggests that higher expected regulatory and litigation costs induce a more elaborative, but risk-averse explanatory stance that may well reduce the overall incremental value of the explanations offered.
Keywords: management discussion and analysis (MD&A); operating and financial review (OFR); regulation; enforcement; litigation; attributional statements
1. Introduction
The aim of this study is to investigate the attributes of performance explanations in narrative accounting reports in a cross-country setting. Narrative reports often accompany companies’ financial statements, to give a view of the company ‘through the eyes of management’ (ASB, 2003; SEC, 1989). Explanations of earnings and related performance outcomes make up a large part of the management commentary. A recent survey of the Fortune Global 500 companies’narrative reporting reveals that 56% of narrative reporting relates to explaining perform-ance outcomes (PwC, 2007). Explanations occur whenever content moves beyond the mere offering of information to matters of meaning, relationships, causes, factors, and reasons (Keil, 2006). By offering incremental information about the link between a performance outcome and its internal and external antecedents, narrative explanations are a useful extension of the financial reporting model (Baginski et al., 2000; Baginski et al., 2008).
In this study we consider the effect of a company’s national institutional environment
(with its embedded regulatory control mechanisms and litigation risk) on the explanatory statements in a company’s management commentary. We hypothesise that differences in expected regulatory and litigation costs may lead to significantly different explanatory attitudes between companies and qualitatively different information content in narrative reports. Prior research on regulation and litigation-related disclosure incentives has mainly focused on disclosure behaviour with regard to earnings forecasts, conference calls and earnings announcements (Skinner, 1994; Francis et al., 1994; Rogers and Van Buskirk, 2009). We extend this research by considering how these incentives affect the way companies cope with demands for decision-useful performance explanations in management commentary reports. The issue is important as concerns have been raised about the extent of generic and ‘boilerplate’ disclosures in narrative reports (SEC, 2003; FRC, 2007). In this vein, we examine properties of the attributional (or explana-tory) framing of financial performance outcomes and consider how they differ between countries. By properties of attributional framing we mean the characteristics of explanations such as their relative occurrence, complexity, consistency, type of argu-ment used and self-serving propensity. By observ-ing differences in attributional properties of disclosure between companies from qualitatively different institutional environments, we are able to make inferences about managers’beliefs about the relationship between attributional statements and expected regulatory and litigation costs.
*Walter Aerts is a professor in the Department of Accounting and Finance at the University of Antwerpen and Ann Tarca is a professor at UWA Business School, University of Western Australia. The authors thank two anonymous reviewers and the editor for helpful comments on the paper.
Correspondence should be addressed to: Professor Walter Aerts, Department of Accounting and Finance, University of Antwerpen, Faculty of Applied Economics, 13 Prinsstraat, B-2000 Antwerpen, Belgium. Tel: +32 3265 4110. Fax: +32 32654064. Email: [email protected].
This paper was accepted for publication in February 2010.
We select four common law countries (the USA, Canada, the UK and Australia) where public information dissemination is central to efficient capital markets but there are differences in expected regulatory and litigation costs. At the time of the study, companies from the USA and Canada provided management discussion and analysis (MD&A) reports in response to mandatory require-ments while companies in the UK and Australia followed best-practice guidelines. With regard to the institutional setting, of which the mandatory and voluntary regimes are part, the UK is generally perceived as having the lowest and the USA the highest expected regulatory and litigation costs, with Australia and Canada occupying something of a middle position (Khurana and Raman, 2004; Seetharaman et al., 2002; La Porta et al., 2006). The issue of regulatory and litigation costs is linked to whether the reporting regime is mandatory or voluntary, but it goes beyond the type of regime to represent the broader setting in which financial reporting occurs. We analyse the MD&A or oper-ating and financial review (OFR) reports of 172 listed companies from five industries (building materials, food processors, pharmaceuticals, bio-technology and retail) for the 2003financial year. Consistent with prior research on the effects of accountability pressures on individual and organ-isational behaviour (e.g. Tetlock, 1999), we expect that environments with more regulation and moni-toring and higher potential litigation risk will lead to more detailed and formal explanations of perform-ance which feature more consistent presentation traits and less self-serving bias.
Our results are generally consistent with these predictions. Companies from the USA and Canada are relatively less assertive and less defensive in their explanations than their counterparts in the UK and Australia.1 The North American companies include more and more extensive explanations and are more likely to use more formal language and to rely more on technical-accounting explanations relative to causal explanations. The effects identi-fied are strongest for companies from the USA, where MD&A reports are mandatory and public and private enforcement is highest. Our evidence sug-gests that higher expected regulatory and litigation costs bring companies to display significant effort to
explain performance outcomes but in a risk-averse way, thereby constraining the type of explanations which have been shown to be the most revealing (Baginski et al., 2000, 2004) and tending towards ‘boilerplate’ disclosures, by making extensive use of easily replicable, intermediary technical-accounting explanations.
Our study extends the literature in several ways. First, we add to prior international studies compar-ing features of management commentary reports (Collins et al., 1993; Beattie and McInnes, 2006; PwC, 2007) by focusing on the attributional framing in those reports. Second, we extend the literature on attributional properties in narrative reports (Aerts, 1994, 2005; Clatworthy and Jones, 2003, 2006) by using an international comparative setting. Prior research on attributional statements generally relies on a one-country setting and ignores the impact of country-level characteristics. A third area of contribution relates to providing empirical evidence about the impact of the institutional environment and related enforcement differences on the content of management commentary reports. We show detailed differences in attributional fram-ing in institutional settfram-ings which vary with regard to the extent of mandatory requirements and expected regulatory and litigation costs, suggesting that these differences drive explanatory patterns to a considerable extent. We also add to studies about the impact of litigation-related incentives on dis-closure behaviour (Francis et al., 1994; Skinner, 1994, 1997; Rogers et al., 2009), which will be of interest to market participants and regulators.
2. Background and hypotheses
We propose that between-country differences in institutional setting will affect the properties of performance explanations contained in manage-ment commanage-mentary reports. In this section we provide an overview of the differences in the institutional setting of the four countries selected for study. We also present relevant prior research about attributional statements and develop our hypoth-eses.
2.1. Institutional setting
At the time of the study (2003) narrative reports were provided in response to mandatory regulations in the USA and Canada and voluntary best-practice guidelines in the UK and Australia (see Table 1). There are many similarities in the frameworks of the UK and Australia, which have legal systems with common origins and a system of company regula-tion through common and statute law. There was considerable guidance and encouragement to pro-1In general, assertiveness in explanations refers to the
tendency to acclaim positive outcomes and explain them more from internal than external causal antecedents, whereas defen-siveness in explanations relates to the tendency to deny responsibility for negative outcomes and explain negative outcomes more from external than internal causal antecedents. Specific measurements capturing these tendencies are shown in Appendix 1.
vide management commentary information, but disclosure in UK and Australian companies’reports was largely of a voluntary nature. In contrast in the USA the Securities and Exchange Commission (SEC) has promulgated many requirements relating to the form and content of management reports. In Canada the Canadian Securities Administrators (CSA) require listed companies to provide an MD&A. The stated aim of the MD&A and its required topics are similar in the USA and Canada (Table 1). Although the reports are mandatory and there is extensive guidance about content, the actual items included and the way they are discussed is under the discretion of management and thus may reflect both company factors and the institutional setting in which they are made.
The general objective of the rules/guidance is to promote detailed discussion to assist users’ inter-pretations of the information provided in the financial statements. The explanations provided become part of the accountability mechanisms operating within listed companies’ institutional environments. Accountability mechanisms refer to the means by which companies are held responsible and answerable for past decisions and actions. They include narrative reports as well as other reporting and governance mechanisms.
Accountability mechanisms hold both threats and opportunities. Accountability pressures increase with the demands of external constituencies and with the perceived severity of potential sanctions. On the other hand, they create generally accepted channels through which relevant stakeholders can be persuaded to grant approval of the company’s position and performance and provide continued support. Within a public accountability context, it is hard to argue that explanations in narrative reports are simply the outcome of an internalised and communicated data analysis process. Companies are likely to develop coping strategies in their explanations, depending on the nature of what has to be explained and the context in which the causal claims are made, including the audience to whom the company is accountable (Edelman, 1977; Gardner and Martinko, 1988; Tetlock, 1985, 1999). Research in an accountability setting suggests that perceptions of the relevant audiences and of related rewards and sanctions are likely to signifi -cantly affect performance explanations of those held accountable (Gibbins and Newton, 1994; Johns, 1999; Tetlock, 1985; Tetlock and Lerner, 1999; Weick, 1995). Audience characteristics and embedded rewards and sanctions have been shown to be effective determinants of coping behaviour at an interpersonal level, but operate in functionally
equivalent ways at the (inter) organisational level (Elsbach, 2003; Harrison et al., 1988; Suchman, 1995; Weick, 1995). Moreover, within a formal institutional setting, regulatory and legal mechan-isms tend to enforce accountability processes. Such mechanisms usually strengthen accountability demands and lead to increased institutional scrutiny pressures, which may affect the relative costs and rewards of argumentation choices in management commentary reports.
The institutional settings of the four sample countries involve developed market economies with legal systems based on a common law regulatory framework (La Porta et al., 1997, 1998). However, there are important differences between the countries in relation to both public and private enforcement mechanisms which may impact on attributional statements.2 A primary public enforcement difference between the countries rele-vant to management commentary relates to the extent to which MD&A reporting is mandatory or mainly voluntary. The presence of explicit rules of compliance in a mandatory reporting regime facili-tates both public and private enforcement actions and, thus, heightens perceived regulatory and litigation costs.3
However, even within a mandatory regime the extent of active monitoring and enforcement of mandatory rules differs. Public enforcement actions have been taken in relation to MD&A reports in the USA but not in Canada. The SEC has required companies to amend and expand their MD&A filings and, in some cases, imposed largefines for inadequate and misleading disclosure (SEC, 2004b). While the cases may not relate specifically to performance explanations, they illustrate that companies in the USA operate in an environment where enforcement action has been taken in relation to MD&A reports. In contrast, the minimal nature of mandatory rules in the UK and Australia (at the time
2Public enforcement involves the use of a public agent such
as a regulatory body to detect and sanction violations of normative rules. Public regulatory bodies use their power a priori (by stipulating mandatory rules of compliance) and a posteriori (by imposing sanctions and penalties). Private enforcement operates through civil law suits brought by private parties under existing contract and tort law.
3The USA operates a more closely regulated system with
regard to MD&A disclosures. The SEC has a supervisory role in the creation and application of MD&A rules. In the USA and Canada the regulators monitor the information provided. Like their counterparts the SEC, the Canadian Securities Administrators (CSA) have contacted companies directly requesting re-submission of MD&A reports (Clarkson et al., 1994). In addition, the Canadian Institute of Chartered Accountants (CICA) has provided guidance, which is supported by the CSA (IASCF, 2005).
CCH
-ABR
Data
Standa
rds
Ltd,
Fr
ome,
Somerse
t
–
15/1
1/2010
03
ABR
Aerts.3d
Page
424
of
450
Table 1
Framework for narrative reports (2003)
Purpose Legal requirements/voluntary guidelines Topics
USA The basic requirement for the MD&A is to
‘provide such other information that the registrant believes to be necessary to provide an understanding of itsfinancial condition, changes infinancial condition and results of operations’ (SEC, 2002).
Mandatory report for all listed companies. Specific components of the MD&A are required by Regulation S-K, Item 303, SEC releases including 33-8056, 33-8182, 34-45321, 34-47264, FR-67 and the SEC Act 1934, section 13(j).a
(1) application of critical accounting policies (2) results of operations
(3) liquidity (4) capital resources
(5) off-balance sheet arrangements.
CANADA The MD&A is a narrative explanation, through
the eyes of management, of how a company performed during the period covered by the
financial statements, and of the company’s
financial condition and future prospects. MD&A complements and supplements thefinancial statements, but does not form part of the
financial statements (OSC, 2004a, 2004b).
Mandatory report for all listed companies. National Instrument Form 51-102F1, December 2003 (OSC, 2004a)
(1) operations (2)financial condition (3) liquidity
(4) forward-looking information (5) risk and uncertainty.
UK To allow shareholders and others to make a
proper assessment not only of the company’s past performance but also the directors’view on the company’s future prospects and its approach to managing social and environmental issues, which are crucial to the company’s future success and reputation (DTI, 2001).
Voluntary report. Operating and Financial Review Statement (ASB, 2003). Recommended for all large and listed companies.
(1) nature of the business, its objectives and the strategies adopted to achieve those objectives; (2) performance of the business in the period and the main influences on performance, including the expected effects of known trends and the potential effect of risks facing the business; and (3)financial position, including capital structure and treasury policy, and the factors affecting and likely to affect that position (ASB, 2003).
AUSTRALIA Purpose for review of operations not stated. Corporations Act Section 299 Directors’Report
to contain a Review of Operations. The Australian Stock Exchange requires all listed companies provide a Review of Operations and
recommends the G100Guide to Review of
Operations and Financial Conditionbe followed (ASX, 2004) AASB 1039 required a Discussion and Analysis report to accompany concisefinancial reports.
(1) company overview and strategy; (2) review of operations; (3) investments for future performance; (4) review offinancial condition; (5) risk management; (6) corporate governance (G100, 2003).
aSEC (1968, 1974, 1980, 1987, 1989, 2001, 2002, 2004a, 2004c, 2004d)
424
ACCOUNTING
AND
BUSINESS
of our study) inhibits regulatory action and thus minimises regulatory costs in these countries.
The voluntary versus mandatory nature of MD&A reporting is, however, endogenous to the wider institutional environment in which company reporting functions. In this regard, La Porta et al. (2006) provide useful measures of public and private enforcement to quantify inter-country dif-ferences in expected regulatory and litigation costs. They propose that the USA has the highest level of enforcement for both the litigation standard (1.00) and the public enforcement index (0.90) and the UK the lowest (0.66 and 0.68, respectively). Averaging both indices to provide an overall measure which captures both public and private enforcement and thereby proxies for the general regulatory and litigation environment in the four countries, we get the following country ranking: (1) USA average of 0.95, (2) Canada average of 0.90, (3) Australia average of 0.78, and (4) UK average of 0.67.4We will use this ranking to differentiate expected regulatory and litigation costs across the four countries. The ranking is consistent with previous research identifying significant differences in liti-gation risk among the sample countries (Ball et al., 2000; Khurana and Raman, 2004; Baginski et al., 2002; Seetharaman et al., 2002; Hughes and Sankar, 2006). Litigation risk is far greater in the USA than in Canada, the UK and Australia (Seetharaman et al., 2002; Khurana and Raman, 2004). Moreover, Ball et al. (2000) argue that expected litigation costs are lower in the UK than in Australia, Canada and the USA. With regard to public enforcement, Bhattacharya (2006) documents that the SEC enforces securities laws much more vigorously than their Canadian counterparts. The SEC has taken several enforcement actions against regis-trants in relation to MD&A, including the Edison Schools Inc., Sony Corporation, Caterpillar Inc., American Express Company and Bank of Boston Corporation and K-Mart cases (SEC 2005a, 2005b). Similar cases have not occurred in Canada, the UK and Australia.
2.2. Attributional properties of management commentary
Explanatory patterns within the context of account-ing narratives have been studied on several occa-sions, mainly from an attribution theory perspective (Aerts, 1994, 2001, 2005; Bettman and Weitz, 1983; Baginski et al., 2004, 2008; Clatworthy and
Jones, 2003, 2006; Merkl-Davies and Brennan, 2007; Salancik and Meindl, 1984; Staw et al., 1983). Attribution theory relates to how people explain the causes and antecedents of events. It focuses on perceived causality: people’s inferences about what causes things to happen and why things happen as they do. Attributional statements are narrative statements reflecting a cause-effect or antecedent-consequence relationship.
Numerous authors demonstrate a corporate ten-dency to attribute positive effects or outcomes in the annual reports to the company’s own actions or corporate origins (company strategy, decisions, know-how, human resources potential) and nega-tive outcomes to external events or chance factors (business climate, inflation, market prices, govern-ment policy, weather) (Baginski et al., 2000; Bettman and Weitz, 1983; Clapham and Schwenk, 1991; Clatworthy and Jones, 2003; Hooghiemstra, 2003, 2008; Salancik and Meindl, 1984; Tsang, 2002; Wagner and Gooding, 1997). This explan-ation style is considered as self-serving because situations and events are defined to the company’s own advantage. The self-serving explanation pat-tern can be decomposed into an assertive compon-ent (stressing the importance, relevance and scope of positive outcomes or actions) and more defensive characteristics (downplaying the significance of negatively evaluated events). In general, assertive tendencies refer to framing positive outcomes in such a way that their effect is heightened through entitlements, enhancements and selective positive-ness of the image presented. Defensive tendencies relate to excuses, justifications, and denials of negative effects (Gardner and Martinko, 1988; Elsbach, 1994, 2003) (See Appendix 1 for further detail of definitions). Prior research also points to a pattern of intentional attributional search for posi-tive news when overall performance declines (Aerts, 2005; Clatworthy and Jones, 2003; Elsbach and Kramer, 1996), accompanied by a tendency to substitute negative overall earnings measures by fractional earnings measures of a positive kind (e.g. on divisional, subgroup or segmental level).
Explanations in annual report narratives are frequently expressed through formal accounting language, with its specific terminology and inherent calculative relationships. Such technical-account-ing explanations use the internal logic of the financial accounting model, relating intermediary accounting effects and categories, in order to make sense of and rationalise corporate performance outcomes (Edelman, 1977). Such formal language explanations are inherently ambiguous as the con-4
Canada scores 0.9 on the litigation standard and 0.8 on the public enforcement index. The corresponding scores for Australia are 0.66 and 0.9.
cepts and relationships that they reflect tend to be analytical and not descriptive like causal explan-ations expressed in natural language. Research shows that the use of accounting explanations tends to be biased relative to the tenor of the accounting outcome that is explained (Aerts, 1994; Hooghiemstra, 2003), with positive performance outcomes explained more in explicit cause-effect terminology and less through technical-accounting explanations.
2.3. Hypotheses
We argue that regulatory and legal mechanisms that enforce accountability processes increase expected external scrutiny, thus affecting preparation of performance explanations. Although the outcome of formal legal and regulatory scrutiny is highly uncertain and related litigation is activated only in exceptional cases, higher expected regulatory and litigation costs are likely to heighten the ex ante salience of accountability predicaments resulting from companies’ explanatory activities and create the countervailing interests that compel companies to become more self-conscious about the conse-quences of disclosure about their performance. More specifically, we argue that higher scrutiny pressures coming from higher expected regulatory and litigation costs bring about a disclosure envir-onment in which explanatory effort is promoted, self-presentational tendencies are reduced and more formal disclosure positions prevail.
2.3.1. Explanatory effort
Stronger regulatory and legal accountability mech-anisms increase accountability demands upon com-panies and are expected to affect information processing and related framing of performance disclosures. Accountability research within the domain of social psychology and organisational behaviour points out that, in understanding the effect of accountability on behaviour, it is important to distinguish between situations in which the actor is aware of accountability demands before or after the act in question (pre- versus post-decisional accountability) (Tetlock and Lerner, 1999). Pre-decisional accountability induces more self-critical, integrated, complex ways of reasoning and a more consistent way of handling evaluative content (i.e. recognising both good and bad features of particular events and explaining good and bad news consistently) (Lerner and Tetlock, 1999). Kunda (1990) documents that such circumstances lead to more cognitive effort on issue-related reasoning, with deeper and more careful information handling and often with use of more complex rules.
Pre-decisional accountability tends to affect the length of the actor’s analysis and evaluation of evidence but also its complexity.
Higher expected regulatory and litigation costs heighten the ex ante salience of accountability predicaments arising from companies’explanatory activities and lead to a situation that is functionally equivalent to pre-decisional accountability. In a comparable vein, Johns (1999) argues that the extent to which public accountability is accompan-ied by actual or anticipated feedback prompts a situation of what he calls ‘proactive scrutiny’. Proactive scrutiny typically promotes the use of argument as an appropriate way to display ration-ality and encourages cognitive effort in the sense of a more intense attributional search when perform-ance outcomes are disclosed (Gibbins and Newton, 1994; Staw, 1980; Weick, 1983). Proactive scrutiny would not only affect the amount of explanatory activity but also its quality, which encompasses consideration of a greater number of alternatives and more evidence.
The above arguments suggest that higher expected regulatory and litigation costs are likely to increase the relative amount of reported account-ing outcomes that are explained (density of attribu-tion statements) and/or the number of explanaattribu-tions offered for each accounting outcome (depth of attribution statements). The explanatory or cogni-tive effort argument leads to the following hypoth-esis:
H1: In an institutional setting with higher expected regulatory and litigation costs companies offer more explanations for financial performance outcomes (density of explanations and depth of explanations).
2.3.2. Inconsistency in explanatory format for positive versus negative content
A more self-critical approach induced by higher accountability pressures usually involves more tolerance for evaluative inconsistency (Lerner and Tetlock, 1999), meaning that both positive and negative features of performance outcomes are recognised and explained. Pre-decisional account-ability motivates more vigilant information pro-cessing and brings people to consider arguments on both sides of an issue and to employ more consistent patterns of reasoning and cue utilisation (Hagafors and Brehmer, 1983; Tetlock, 1999). Thesefindings suggest that under higher scrutiny positive and negative outcomes would be treated more consist-ently in terms of extent or nature of explanation. Where prior research (Aerts, 1994, 2005;
Clatworthy and Jones, 2003, 2006) documents a tendency to prefer causal explanations for positive outcomes (informality bias on positive outcomes), scrutiny forces would reduce such a tendency and promote less bias in how positive versus negative accounting outcomes are explained. In this regard, less inconsistency in explanatory format for posi-tive versus negaposi-tive content would imply that both types of outcome are explained more similarly in terms of type of explanation offered (causal explanation versus formal technical-accounting explanation) with a less biased use of each type of explanation for positive and negative outcomes (a phenomenon we refer to as‘valence inconsistency in formality of explanations’) or in terms of the number of explanations offered for each positive versus negative outcome (referred to as ‘valence inconsistency in depth of explanations’).
This leads to our second hypothesis:
H2: In an institutional setting with higher expected regulatory and litigation costs companies exhibit less inconsistency in explanatory for-mat for positive versus negative financial performance outcomes (valence inconsistency in formality of explanations and valence inconsistency in depth of explanations).
2.3.3. Formality of explanations
Sutton and Galunic (1996) argue that intense external scrutiny causes managers to focus attention and effort on symbolic activities and on well-rehearsed acts and to follow injunctive rather than descriptive norms. Accordingly, scrutiny pressures may promote a tendency to opt for explanations of performance outcomes that are socially well-endorsed, non-controversial and easily justifiable (Scott and Lyman, 1968). Formal technical-accounting explanations, which feature a kind of tautological reiteration of accounting’s logical rela-tionships, provide such generally accepted, salient and consensual explanations (Gowler and Legge, 1983; Aerts, 1994, Hooghiemstra, 2003). By their socially constructed and intermediary nature, they are analytical but not descriptive of actual causality (Hines, 1988). They do, however, reflect injunctive norms as they arise from generally accepted ways of analysing and presenting performance measures. Moreover, technical-accounting explanations are, in essence, litigation-proof in that they avoid making explicit assignment of responsibility and difficult value tradeoffs in describing causal infl u-ences. In that sense, they may be preferred to causal disclosures in an environment characterised by higher litigation risk such as the USA.
Moreover, neo-institutional theory argues that the more institutionalised the environment in which managers operate, the more interactions and accountability relationships become ritualised and over-learned (Weick, 1995). Such conditions may promote the use of more formal and rigid explan-ations in the context of periodic management commentaries. Formal technical-accounting explanations may be particularly prone to a kind of programmed processing of disclosures, leading to ‘boilerplate’ disclosures. In this regard, Nelson and Pritchard (2007) show that US MD&A disclo-sures are increasingly ‘sticky’ with a general tendency to ‘cut and paste’ disclosure from the prior year. Such a tendency may result in more rigid argumentation patterns in explaining accounting outcomes, with a preference for replicable, easily defensible and socially endorsed explanatory cat-egories (Tetlock, 1985, 1999). Technical-account-ing explanations, with their self-evident and uncontroversial character, may be prone to auto-matic processing of narrative disclosure scripts and could easily lead to programmed, ritual-like explanatory disclosures. Thus the following hypothesis is proposed:
H3: In an institutional setting with higher expected regulatory and litigation costs companies use more formal explanations of financial per-formance outcomes (relative use of technical accounting explanations, informality bias on positive outcomes).
2.3.4. Self-serving explanations
Jones and Pittman (1982) argue that the more institutionalised the environment in which explan-ations for success and failure are offered, the less impression management is likely to be involved. Moreover, behavioural accountability research demonstrates that actors temper their self-enhance-ment tendencies when they expect to face a judgmental evaluator post hoc (Sedikides and Herbst, 2002; Sedikides et al., 2002; Johns, 1999). This suggests that proactive scrutiny, associated with higher expected regulatory and litigation costs, is likely to attenuate self-serving behaviour.
Partial empirical support for this argument comes from the few cross-country or replication studies (Hooghiemstra, 2008; Tsang, 2002) that demon-strate that the significantly stronger self-presenta-tional biases generally found in US samples relative to Asian samples (Mezulis et al., 2004) could not be replicated (and were even reversed for defensive tendencies) within the institutionalised context of annual report narratives, suggesting that the
ential institutional setting of the Asian versus the US capital market significantly constrains and even inverses generally expected cultural differences in self-presentational behaviour. When the explana-tory process itself is under high scrutiny, as is the case in the USA, self-presentation needs get less priority or become less important because the dominant audience’s response will be based on an assessment of the characteristics or quality of the framing process, and less on the performance outcome itself (Lerner and Tetlock, 1999). Rogers and Van Buskirk (2009) indicate that the litigation process in the USA leads to companies decreasing disclosures for which they may later be held accountable, despite the protection offered by the Private Securities Litigation Reform Act of 1995. This is consistent with the view that US MD&A disclosure is increasingly scrutinised, internally and externally, through a legal lens. Self-serving explan-ations may be especially targeted (and avoided) in this respect, leading to the following hypothesis:
H4: In an institutional setting with higher expected regulatory and litigation costs companies exhibit less self-serving tendencies infinancial performance explanations (assertive causal bias, defensive causal bias, use of entitlements and enhancements, use of excuses, justifi ca-tions and causality denials).
3. Data and method
3.1. Sample selectionThe four countries selected for this study (the USA, Canada, the UK and Australia) were chosen because capital markets are important sources of company finance in each country. Company dis-closure is likely to be important for a number of reasons, which reflect aspects of capital markets such as raising external capital, demonstrating managerial talent and securing compensation (Healy and Palepu, 2001). The selection of the four countries allows us to investigate attribution patterns in management commentary reports where all companies have incentives to provide informa-tion, but there are differences in their institutional setting. Listed companies were selected because our focus was on public accountability.
Prior research suggests that company size and industry membership are associated with disclosure (Lang and Lundholm, 1993, 1996; Beattie et al., 2002, 2004; Hooks and Moon, 1993; Cole and Jones, 2004). To control for industry effects, we selected our sample from only five industries (building materials, food processors, pharmaceut-icals, biotechnology and retail).
We selected the three largest companies in each industry group in each country (n = 60) (based on a Datastream list of the largest 500 companies by market capitalisation in each country) so that the companies likely to provide the most disclosure in each industry were included. However, the largest companies in each country differed markedly in size between countries, with Australian and Canadian companies being significantly smaller and US companies being significantly larger than average. Therefore, in the second stage of sample selection we selected companies based on their relative size. We calculated each company’s relative size based on its market capitalisation as a proportion of the total market capitalisation for its country. Within each industry group in each country, we grouped companies into deciles based on relative market capitalisation (excluding the largest three com-panies, which are included in stage one) from largest to smallest. Within each decile, we then selected fourfirms (one from each country) which were of a similar size (defined as having a relative market size that was within a 5% range) to give up to ten additional companies in each country from each industry.5
The number of companies selected in the second stage differs between countries because it reflects the number of companies in the industry group for each country and the number which could be size matched across the four countries. For example, the UK and Australia had relatively more listed com-panies in the building materials sector than the USA and Canada, so the UK and Australian samples are larger in this sector. In the pharmaceuticals sector, there were more listed companies in the USA and Canada from which to select the sample companies so the sample in this sector has more US and Canadian companies than Australian and UK companies. Thus the final sample comprises both the three largest companies in each industry in each country (from thefirst stage) and well as a number of additional companies (based on relative size) from the second stage.
The sample selection in the second stage was helpful because we have included many companies of similar relative size, however it did result in an unequal distribution of companies across countries
5
For example, in the food producer group in relative size decile 0.40–0.49, we selected (AUS) SPC Ardmona 0.0449,
(UK) Dairy Crest Group 0.0412, (USA) Dean Foods 0.0427 and (CAN) Canada Bread 0.0676. Relative size difference (max-imum less min(max-imum) expressed as a percentage = 6.7%–4.1%
= 2.6%. If the decile group did not include four companies, we included only the number available (e.g. for the decile 0.20–
0.29 we included three companies (AUS) Select Harvests 0.027, (UK) Geest 0.0258 and (USA) Bunge 0.0274.
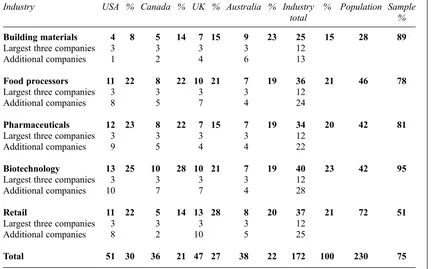
and industries. Nevertheless, there are sufficient companies in each industry and company group to allow valid inferences to be drawn at the country level. The final sample includes 172 companies, with 51 (30%) from the USA, 36 (21%) from Canada, 47 (27%) from the UK and 38 (22%) from Australia. Representation from industry groups was as follows: building materials 25 companies (15%); food processors 36 (21%); pharmaceuticals 34 (20%); biotechnology 40 (23%) and retail 37 (21%) (Table 2). The final sample is 75% of the population 230.6 The proportion of sample com-panies/population is generally high (building mater-ials 89%, food processors 78%, pharmaceuticals 81%; biotechnology 95% and retail 51%, Table 2) suggesting that the final sample is likely to be representative of the population.
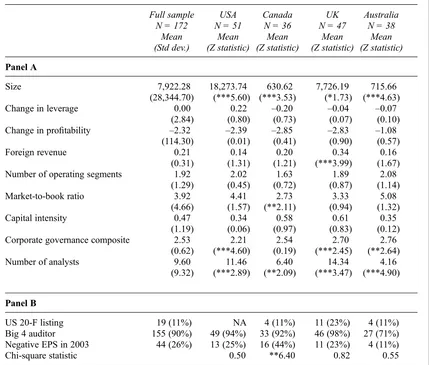
Table 3 provides descriptive statistics for the sample companies. Significant differences between companies from the four countries are observed for several attributes. The US and UK companies are larger and followed by more analysts than the Australian and Canadian companies. The UK companies are more international than average, with a higher proportion of foreign revenue and more US foreign listings. The sample includes 11 UK, four Canadian and four Australian companies with a 20-F listing. The UK and Australian companies rank more highly than average on the corporate governance composite score (a score out of three, where 1 is added if the board chair is a non-executive director, the majority of the board are independent directors and the company uses a committee structure, i.e. audit, nomination and remuneration committees). Most companies are audited by a Big 4 company (USA 94%, Canada 92% and the UK 98%). Australia has a lower proportion of Big 4 audited companies (71%). Table 2
Sample selection by country and industry
Industry USA % Canada % UK % Australia % Industry total
% Population Sample %
Building materials 4 8 5 14 7 15 9 23 25 15 28 89
Largest three companies 3 3 3 3 12
Additional companies 1 2 4 6 13
Food processors 11 22 8 22 10 21 7 19 36 21 46 78
Largest three companies 3 3 3 3 12
Additional companies 8 5 7 4 24
Pharmaceuticals 12 23 8 22 7 15 7 19 34 20 42 81
Largest three companies 3 3 3 3 12
Additional companies 9 5 4 4 22
Biotechnology 13 25 10 28 10 21 7 19 40 23 42 95
Largest three companies 3 3 3 3 12
Additional companies 10 7 7 4 28
Retail 11 22 5 14 13 28 8 20 37 21 72 51
Largest three companies 3 3 3 3 12
Additional companies 8 2 10 5 25
Total 51 30 36 21 47 27 38 22 172 100 230 75
This table shows the sample selection by industry and country. Industry groups are based on Datastream industry classifications. Each industry group includes the three largest companies (based on market
capitalisation at 31 December 2003) and up to ten additional companies, subject to the number of companies in the industry as per Datastream lists of the largest 500 companies in each country. The additional
companies are selected by matching companies based on similar relative market size (company market capitalisation/total country market capitalisation). The number of companies within the largest 500 in each country is shown by industry group in the column headed‘population’and the proportion of companies in the sample is shown in the column headed‘Sample’.
6
The population for each country is the companies in thefive industry groups located in the largest 500 companies by market capitalisation.
Companies do not differ significantly in whether they experienced a change in profitability in the year of study. Only the Canadian sample had more loss-making companies (44%) than average (26%) and, not surprisingly, the market-to-book ratio was lower than average for Canadian companies.
The year 2003 was selected to capture existing differences in the institutional environment for
management commentary reports. As noted above, regulators in the USA and Canada required mandatory reports. In 2003 reports in the UK and Australia reflected primarily voluntary recommen-dations. By 2004 the UK had announced the introduction of mandatory reports (an initiative later withdrawn) (FRC, 2005) and Australia intro-duced requirements for management discussion and Table 3
Descriptive statistics
Full sample N = 172
Mean (Std dev.)
USA N = 51
Mean (Z statistic)
Canada N = 36 Mean (Z statistic)
UK N = 47
Mean (Z statistic)
Australia N = 38
Mean (Z statistic)
Panel A
Size 7,922.28 18,273.74 630.62 7,726.19 715.66
(28,344.70) (***5.60) (***3.53) (*1.73) (***4.63) Change in leverage 0.00 0.22 –0.20 –0.04 –0.07
(2.84) (0.80) (0.73) (0.07) (0.10) Change in profitability –2.32 –2.39 –2.85 –2.83 –1.08
(114.30) (0.01) (0.41) (0.90) (0.57)
Foreign revenue 0.21 0.14 0.20 0.34 0.16
(0.31) (1.31) (1.21) (***3.99) (1.67) Number of operating segments 1.92 2.02 1.63 1.89 2.08
(1.29) (0.45) (0.72) (0.87) (1.14)
Market-to-book ratio 3.92 4.41 2.73 3.33 5.08
(4.66) (1.57) (**2.11) (0.94) (1.32)
Capital intensity 0.47 0.34 0.58 0.61 0.35
(1.19) (0.06) (0.97) (0.83) (0.12) Corporate governance composite 2.53 2.21 2.54 2.70 2.76
(0.62) (***4.60) (0.19) (***2.45) (**2.64)
Number of analysts 9.60 11.46 6.40 14.34 4.16
(9.32) (***2.89) (**2.09) (***3.47) (***4.90)
Panel B
US 20-F listing 19 (11%) NA 4 (11%) 11 (23%) 4 (11%) Big 4 auditor 155 (90%) 49 (94%) 33 (92%) 46 (98%) 27 (71%) Negative EPS in 2003 44 (26%) 13 (25%) 16 (44%) 11 (23%) 4 (11%)
Chi-square statistic 0.50 **6.40 0.82 0.55
Descriptive statistics for continuous and dichotomous variables for the full sample and four countries. Size = market value, 31 December 2003, US$ million. Change in leverage = (total debt/total equity 2003–2002)/ total debt/total equity 2002. Change in profitability = (ROE 2003–2002)/ABS ROE 2002. Foreign revenue = proportion of foreign revenue to total revenue. Market-to-book = market value of equity atfinancial year-end/book value of equity. Capital intensity = non-current assets/total assets. Corporate governance status = score out of three, where 1 is added if board chair is a non-executive director, the majority of the board are independent directors and the company uses a committee structure (audit, nomination and remuneration committee). Analyst following = number of analysts following a company. Panel A shows means and standard deviations are shown for the full sample and means and Mann Whitney Z statistics for each country (for tests comparing mean ranks for each country and the other three). Panel B reports chi-square statistics (which compare proportions in each country and the full sample) for negative EPS. Chi-square tests are not conducted for US-20F listing and Big 4 auditor due to occurrence of cell sizes are below 5. US 20-F listing, Big 4 auditor and Negative EPS are one if applicable to the company and zero 0 otherwise. *** significant atp<0.01. ** significant atp<0.05. * significant atp<0.10 (two-tailed tests).
analysis as part of reform of company law (CLERP 9) (ASIC, 2005). The year 2003 was selected so that reports predated the changes in the institutional environment in the UK and Australia.7 We select only one year for study due to the time consuming nature of data collection, the need to collect sufficient cases in each of the four countries and the difficulty of controlling for the impact of changes in the institutional framework over time in four countries. A time series design would introduce noise as the institutional settings changed, making hypothesis testing more difficult.8
3.2. Coding procedure
The coding procedure involves two steps: (1) independent identification of the attributional state-ments (defined as a phrase or a sentence in which a performance outcome is linked with a reason or a cause for the outcome); and (2) independent coding of the attributional statements according to the characteristics of explained effects and explanatory factors. The explained effects are coded according tofive characteristics: nature, valence, time orien-tation, qualification and analytical level of explained content. For each characteristic, different elements are discriminated. The explanatory factors (causes) are coded according to six characteristics: explicitness of the antecedent–consequence rela-tionship, direction of influence of the antecedent– consequence relationship, time orientation and qualification of the explanatory factor, nature of the antecedent–consequence relationship and locus of causality. As for explained effects, the
charac-teristics are classified according to different elem-ents (see Appendix 2). The explanatory passages selected must refer to the reporting entity or its components.
In step 1 the reports were read by two researchers independently (Coders 1 and 2). All explanatory passages were marked and divided into explained outcomes (or effects) and explana-tory antecedent factors. The coders then compared results and reached agreement on the coding. Intercoder agreement on the initial identification phase amounted to 91%.9If coders were unable to resolve a matter, one of the chief researchers was the arbiter. In step 2, two other researchers (Coders 3 and 4) were responsible for coding the effects and explanatory factors according to specific content characteristics noted above. Coders 3 and 4 worked independently, compared results and resolved any matters of disagreement by reference to one of the chief researchers. Initial intercoder agreement on the coded dimensions amounted to, on average, 88%.10
As the study focuses on the relationship between the annual financial statements and the narrative sections of the annual report, we confine data collection to attributional statements about accounting performance outcomes (profit and loss items such as income, expenses and earnings/ margins). There are several reasons to focus on performance outcomes. Earnings and its compon-ents are key metrics for the company and its investors and are likely to give rise to explanatory statements. In this regard, a recent survey of the narrative reports of Fortune Global 500 companies shows that the majority of the narratives relate to explaining performance outcomes and thisfinding was consistent over different jurisdictions (PwC, 2007).
Pilot testing of our content data confirmed that the majority of statements in the management commentary relate to performance explanations. 7Managers in the UK and Australia could have anticipated
changes in narrative reporting requirements and changed the content of their management commentary reports prior to legislative change. If so, we would predict that increased regulation and oversight would lead attribution statements to be more like those of North American managers. Thus any bias introduced by managers anticipating change favours notfinding country differences and therefore does not explain our results.
8
Although 2003 follows on from dramatic events in the USA in 2001–2002 (the collapse of Enron, WorldCom and Arthur
Anderson and the terrorist attacks) we conjecture that, despite these events, management commentary reports in 2003 are not essentially different to those in immediate prior years. In both the UK and Australia regulators concluded that the existing regulatory framework was sound, implying that the environ-ment in 2003 did not differ in particular ways from immediate prior years. A 2001–2002 UK government review reported‘no
seriousflaw’in the existing regulatory framework (DTI, 2004: 6). ASIC (2003: 47) stated there was‘no material risk’of Enron type abuses. Even in the USA, 2003 does not seem to be a year of radical change of MD&A content in relation to performance outcomes. Nelson and Pritchard (2007), studying cautionary language discussing risk factors and MD&A disclosure over the period 1996–2003 show that the extent of these disclosures
steadily increases over the period. In 2001–2003, it is especially
the cautionary language content which increases relative to the rest of the MD&A. They do not identify a breach of trend in MD&A content in 2003.
9Intercoder reliability was measured based on the coef
ficient of agreement, which is the ratio of the number of pairwise interjudge agreements to the total number of pairwise judgments (Beattie et al., 2002: 20).
10
Robustness of data collection (Behn et al., 2001) was assured in the following ways. First, step 1 data identification was separated from step 2 classification to promote independ-ence in analysis. Second, for 74 companies drawn from all countries and industries (42% of the total sample), all the work of the step 1 and step 2 coders was reviewed by the chief researchers who read the management commentary reports, checked that the identification of explained effects and explanatory factors was complete and that the classification of the content characteristics was correct. The process of double-checking of 42% of the sample, review of all coding by the chief researchers and the level of intercoder agreement provide assurances as to the accuracy and completeness of coding.
Moreover, the valence (favourable/unfavourable) of explained profit and loss items is usually more straightforward and less subjective than the tenor of, for example, explained items offinancial position such as newfinancing, leverage or extent of capital expenditure. Confining attributional disclosures to explanations of profit and loss items generally improves comparability and strengthens the reli-ability of the coding process.
The following example illustrates an explained effect (coded as Income/earnings/profit; Positive effect; Present year; Quantitative; Segment of the company; Implicit link) and its related explanatory factors (coded as Same direction; Present year; Qualitative; Causal explanation; Internal cause – reference to management/board):
Effect statement
‘The segment result has increased by $41.1 million, or 66.3% to $103.8 million. After adjusting for accounting policy changes the segment result would have been $116.4 million for 2003, representing an increase of $54.0 million or 86.5% for the year.’
Explanatory statement
‘. . .Kmart’s (the segment) strong result was a direct reflection of the strategy put in place last year to move the Brand to the leadership position in discount department store retailing.’
Coles Myer Annual Review 2003, p. 28 (Australia Retail)
3.3. Company-level aggregation and dependent variables
As the company and not the specific instance of attribution is treated as the unit of analysis, coding results are aggregated at company level, after meaningful selections on relevant attributional categories at the individual attributional statement level (as specified in Appendix 2). Appendix 1 explains key attributional concepts and describes the company-level attributional properties used as dependent variables and their measurement.11 The company-level attributional variables are primarily expressed as frequency and related difference measures, although some were additionally trans-formed into proportional measures, reflecting the relative frequencies of specific attributional charac-teristics. Additional coding examples are provided in Appendix 3.
3.4. Empirical models
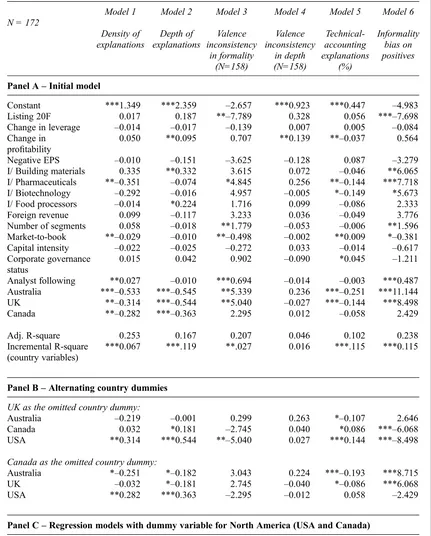
The following regression model is used to investi-gate the determinants of attributional reporting:
Company-level attributional content variableit= f (Company size, Diversification, Corporate governance status, Negative earnings per share, Growth, Analyst following, Capital inten-sity, Change in leverage, Change in profitability, Filing status,, Industry dummies, Country
dum-mies)it (1)
In order to isolate the country-level effect (the country dummies in the regression model), we control for company and industry variables that proxy for the demand and supply of disclosure and could therefore affect properties of attributional statements. Data was obtained from the Datastream database (which also provides access to I/B/E/S for data on analyst following) and directly from company annual reports (sourced from the Mergent database and company websites). Justification of control variables is outlined below. Larger company size is commonly associated with amount and quality of voluntary disclosure (Lang and Lundholm, 1993). More specifically, Baginski et al. (2004, 2008) show that the use of causal explanations increases with company size. Aerts (2005) evidences that larger companies use more enhancements and entitlements, but less defensive attributional statements. Company size is measured as the natural logarithm of the company’s market capitalisation (in USD).12 Company diversification will have an impact on the complexity of the operations underlying the accounting outcomes and on the supply of account-ing outcomes eligible for attributional activity. Li (2008) shows that the use of causal language in MD&A is related to the number of reporting segments. Aerts (2005) suggests that attributions of segmental accounting outcomes complement or substitute attributional arguments at corporate level, depending on the tenor of the latter. We use the number of business segments and the percentage of foreign sales as proxies for diversification.
Corporate governance status proxies for moni-toring mechanisms that are likely to affect discre-tionary narrative disclosures. For example, it is suggested that boards are more effective in moni-toring company insiders when there is a strong base of independent directors on the board (Fama and Jensen, 1983; Xie et al., 2003). Dechow et al.
11
In Appendix 1 the dependent variables used for hypothesis testing are marked with an asterisk. The dependent variables are grouped by hypothesis.
12
Multicollinearity between company size and analyst following brings us to drop company size in the main regression models. Dropping analyst following instead of company size does, however, not qualitatively affect our results.
(1996) show that companies with a large percentage of non-executive directors are less likely to be subject to enforcement actions by the SEC for accounting policy violation. We proxy for corporate governance status using a self-constructed compos-ite measure (score out of three, where 1 is added if board chair is a non-executive director, the majority of the board are independent directors and the company uses a committee structure, i.e. audit, nomination and remuneration committees) based on data disclosed in the annual reports. We select these three indicators because they have been identified as key aspects of a company’s governance structure that influence external reporting behaviour (Dechow et al., 1996; Dahya et al., 2002; Xie et al., 2003).
Financial analysts are primary users of MD&A and create a demand for incremental attributional content (Clarkson et al., 1994; Schleicher et al., 2007). Lang and Lundholm (1996) and Healy et al. (1999) find a positive relation between analyst following and the quality of a company’s disclo-sure. Market premium (market-to-book ratio) is used as a proxy for growth potential and investment opportunity set. Growth companies may also have more complex and uncertain business models, increasing both the supply and demand for attribu-tional disclosure. Li (2008) shows that the market-to-book ratio is positively related to causal language use in MD&A. Market-to-book is measured as market value of equity atfinancial year-end divided by book value of equity. In addition, we expect that the level of capital investment intensity, a well-known measure of entry barriers and proxy for product market competition (Dye, 1985; Darrough and Stoughton, 1990) to be associated with attributional activity. Capital intensity may be an important attribute for explaining changes in accounting outcomes. It measured as total non-current assets divided by total assets.
Company profitability and leverage can have both a motivational and an informational impact on the content of accounting narratives. From an informa-tional perspective, level of and change in these variables proxy for good versus bad news and directly affect the supply of information to be explained. As well, level and change in profitability may provide strong incentives for impression man-agement and trigger qualitatively different attribu-tional statements (Aerts, 2001, 2005; Clatworthy and Jones, 2006; Hooghiemstra, 2003). We include proxies to control for level and change in profi tabil-ity (relative change in return on equtabil-ity and a negative EPS dummy) and change in leverage (relative change total debt over total equity).
Prior research has shown that cross-listing increases the level and quality of disclosure, especially if a company is cross-listed on a foreign market that is more regulated than the domestic market. Therefore we expect that SEC foreign registrants will experience disclosure pressures (including attributional disclosure demands) similar to those of US companies. We use a dummy for a Form 20-Ffiling by a non-US company. Finally, we include dummy variables (for four of the five industry groups) because industry membership has been shown to influence voluntary disclosure (McKinnon and Dalimunthe, 1993; Malone et al., 1993; Meek et al., 1995) and industry-specific features may lead to distinctive disclosure patterns, including specific attributional disclosures (Aerts, 2005).
Including analyst following in our model creates a potential problem of endogeneity with regard to disclosure properties (Tong, 2007; Hope, 2003). Both may be affected by a common disclosure strategy. Financial analysts are more likely to follow companies with more informative disclosures, while, on the other hand, companies may disclose more in order to attract morefinancial analysts. In that vein, narrative disclosure properties and analyst following may be simultaneously determined. If companies manage their explanatory reporting with the benefits of more analyst following in mind, the assumption of no interdependence is violated, which leads to unreliable OLS-statistics. Endogeneity between explanatory reporting and analyst following leads us to use a 2SLS approach for the above regression with analyst following estimated according to the following model (while dropping company size in the attributional content regression due to multicollinearity):
Analyst followingit= f(20Ffiling, Company size, Market-to-book ratio, Return variability,
Industry, Country)it (2)
The rationale for the relationship of analyst following and explanatory variables is as follows. A Form 20-Ffiling by non-US companies may create greater demand for analysts’services (Lang et al., 2003). A US listing is likely to stimulate activity by analysts in the foreign country, adding to the domestic supply of analysts’ services. From the supply side, analysts may be more inclined to follow cross-listed companies since they are more likely to attract a larger investor base.
Bhushan (1989) argues that company size affects both the aggregate demand and the aggregate supply for analysts’services. Demand is positively affected by company size because the aggregate
potential payoff for shareholders from access to higher quality information is more important for larger companies. Supply is positively affected, because there are significantfixed costs in following a company and the payoff from following is related to its size. Analyst coverage has been shown to be related to Tobin’s Q (Lang et al., 2003). The demand for analyst services will generally be higher in high-intangible asset companies, where the informative-ness offinancial reports is relatively lower (Amir et al., 2003; Barth et al., 2001). Prior research documents a relation between earnings volatility and analyst coverage (e.g. Bhushan, 1989; Lang et al., 2003), suggesting that demand for analysts’ services is higher for companies with higher financial risk. We measure return variability as the standard deviation of the return on assets during the prior five fiscal years divided by the mean. Industries are not likely to equally attractfinancial analysts, so dummy variables are used to control for industry effects. Chang et al. (2000) provide evidence that country-level institutional variables affect the availability of analyst forecasts. Hence, we introduce country dummies to control for any country effect.
4. Results
4.1. Descriptive statistics
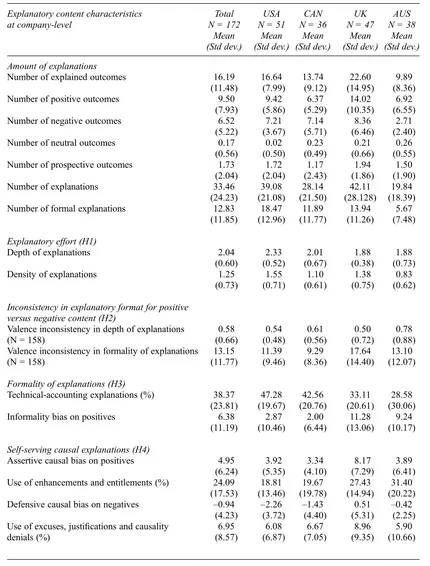
Table 4 presents descriptive statistics for the attributional content variables (in total and by country). The average number of attributional statements is 33.46, relative to an average of 16.19 explained outcomes, i.e. on average, each attributed outcome is accompanied by 2.04 explan-ations.13There are more positively evaluated out-comes than negatively evaluated ones (9.50 positives versus 6.52 negatives). Prospective out-comes represent, on average, 12.31% of the explained effects, an average of 1.73 prospective attributions per management commentary.14
Nearly 61% of the explained outcomes relate to company level information with the balance cover-ing outcomes on a segment level (business or geographical segments, divisions, legal entities, product lines–39.10%). More than one-third of the
explanatory statements can be qualified as inter-mediary explanations (technical-accounting explanations) (38.37%) and these are biased towards the framing of negative accounting out-comes, a tendency referred to as‘informality bias on positives’(see Appendix 1).
As to the self-serving characteristics of the attributional statements, a majority of the explan-ations relate to positively perceived accounting outcomes, but this self-promotional effect is not overwhelming (55.95% of the explained effects are evaluated as positive). The moderate character of the overall positiveness factor may reflect the fact that only explanations of performance were coded. By ignoring explanations of company actions and decisions not expressed in profit and loss termin-ology, managerial discretion in selecting and com-menting on facts with positive ramifications is only partially captured in our data set.
Self-serving tendencies become more apparent in the causal assertiveness bias (i.e. number of positive outcomes explained with reference to internal causes minus number of positive outcomes explained with reference to external causes). The average value of 4.95 indicates a strong acclaiming bias, but a comparable causal defensiveness bias (i.e. number of negative outcomes explained with reference to external causes minus number of negative outcomes explained with reference to internal causes) does not hold for the full sample.
The country differences in attributional behav-iour as shown in Table 4 are broadly consistent with our hypotheses. We support this assertion by comparing the USA and the UK on the key attributional metrics. Depth of explanations and density of explanations (H1 cognitive effort) are both higher in the USA relative to the UK. As to H2 (inconsistency in explanatory format of positive versus negative content), valence inconsistency in formality of explanations is considerably higher in the UK than in the USA, but this observation does not extend to valence inconsistency in depth of explanations.15 Consistent with H3 (formality of explanations), we observe that US companies use considerably more formal language explanations than UK companies and this seems to be driven mainly by not avoiding formal, intermediary 13We are unable to compare the average number of
attributional statements in our study to that in prior studies because the average number depends heavily on the coding procedures used. Coding dimensions affecting the number of attributional statements are: section of the annual report coded (chairman’s statement versus MD&A), types of outcome included (accounting outcomes only versus all types of corporate outcomes), types of argument included (only causal explanations or including technical-accounting explanations).
14
This is consistent with a subsequent MD&A survey which shows that about 10% of quantified narrative reporting relates to forward-looking information (PwC, 2007).
15
Note that for the two measures of inconsistency in explanatory format, the number of observations is reduced to 158 as the valence inconsistency concept refers to a bias in the way positive versus negative outcomes are processed. As it is based on a comparison of the explanatory treatment of outcomes relative to their valence (or evaluative content), the variables require the presence of at least one positive and one negative explained performance outcome in the management commen-tary (see also Appendix 1).
Table 4
Attributional content descriptive statistics
Explanatory content characteristics
Number of explained outcomes 16.19 (11.48) Number of positive outcomes 9.50
(7.93) Number of negative outcomes 6.52
(5.22) Number of neutral outcomes 0.17
(0.56) Number of prospective outcomes 1.73
(2.04)
Number of formal explanations
33.46
Depth of explanations 2.04
(0.60) Density of explanations 1.25
(0.73)
Inconsistency in explanatory format for positive versus negative content (H2)
Valence inconsistency in depth of explanations (N = 158) Valence inconsistency in formality of explanations
(N = 158)
Formality of explanations (H3)
Technical-accounting explanations (%) 38.37 (23.81) Informality bias on positives 6.38
(11.19)
Self-serving causal explanations (H4)
Assertive causal bias on positives 4.95 (6.24) Use of enhancements and entitlements (%) 24.09
(17.53) Defensive causal bias on negatives –0.94
(4.23) – Use of excuses, justifications and causality
denials (%)
This table reports mean scores (standard deviation) in total and by country for attribution content variables. Terminology legend of explanatory content characteristics is presented in Appendix 1.