Laela Hayu Nurani et al.
Review:
Chemometrics-Assisted UV-Vis Spectrophotometry for Quality Control of Pharmaceuticals: A Review
Laela Hayu Nurani
1, Citra Ariani Edityaningrum
1, Irnawati Irnawati
2, Anggita Rosiana Putri
3, Anjar Windarsih
4, Any Guntarti
1, and Abdul Rohman
5,6*1Faculty of Pharmacy, Universitas Ahmad Dahlan, Jl. Prof Soepomo, Janturan, Yogyakarta 55164, Indonesia
2Faculty of Pharmacy, Universitas Halu Oleo, Kendari 93232, Indonesia
3Department of Pharmacy, Faculty of Medicine, Universitas Brawijaya, Jl. Veteran, Malang 65145, Indonesia
4Research Center for Food Technology and Processing (PRTPP), National Research and Innovation Agency (BRIN), Gunungkidul, Yogyakarta 55861, Indonesia
5Center of Excellence Institute of Halal Industry and Systems, Universitas Gadjah Mada, Yogyakarta 55281, Indonesia
6Department of Pharmaceutical Chemistry, Faculty of Pharmacy, Universitas Gadjah Mada, Yogyakarta 55281, Indonesia
* Corresponding author:
email: [email protected] Received: April 25, 2022 Accepted: February 7, 2023 DOI: 10.22146/ijc.74329
Abstract: Spectroscopic method in the UV-Vis region is considered the most molecular spectrometric method for content determination of a single component. However, a lot of pharmaceutical dosage forms comprise two or more components which lead to peak overlapping. Moreover, in the chemical stability test, active pharmaceutical ingredient (API) was also found along with the degradation products, impurities, and adulterant compounds. UV-Vis spectroscopy is one of the methods of choice for the determination or quantification of a single component in pharmaceutical preparations. The pharmaceutical products typically contain two or more APIs having chromophoric agents capable of absorbing UV-Vis beams and the absorbance values are summative from the absorption of each UV-Vis active compound according to the additive nature of Lambert- Beer law. The main problem for the simultaneous determination of API along with impurities and the degradation products in pharmaceutical preparations is the presence of overlapping peaks of UV-Vis spectra. The chemometrics-assisted spectroscopy is one of the analytical efforts to solve these problems. This review highlighted the application of chemometrics in combination with UV-Vis spectroscopy for the assay of API, impurities, adulteration issues and degradation products present in pharmaceutical dosage forms.
Keywords: UV-Vis spectroscopy; chemometrics; API; degradation products;
pharmaceutical dosage forms
List of Abbreviations AC = Acephylline piperazine ACA = 4-Chloroacetanilide ACH = Acetophenone
AKN = Alkaline degradation products ALP = Allopurinol
AM = 1-Methyl-3-phenylpropylamine AME = Absolute mean error
AML = Amlodipin
ANN = Artificial neural networks
AP = 4-Aminophenol
API = Active pharmaceutical ingredients
ASP = Aspirin
ATN = Atenolol ATV = Atorvastatin calcium
B1 = Thiamine
B6 = Pyridoxin
BET = Betamethasone BX = Bromhexine hydrochloride BZ = Benazepril hydrochloride
Laela Hayu Nurani et al.
BZA = p-Hydroxybenzoic acid CAFF = Caffeine
CAR = Carbidopa CBM = Carbamazepine CBME = Carbamazepine epoxide CBS = Cobicistat CBT = Carbetocin
CEF = Cefixime
CEL = Celecoxib CFS = Cefoxitin sodium CLS = Classical least square
CP = 4-Chlorophenol
CPX = Ciprofloxacin
CRA = Concentration residual augmented CS = Cromolyn sodium
CTM = Chlorpheniramine maleate CZX = Chlorzoxazone DAP = 2,6-Diaminopyridine DIA = Diacerein
DOX = Doxycycline hyclate
DP = Diprophyline
DPF = Dapagliflozin
DPH = Diphenhydramine hydrochloride DRV = Darunavir ethanolate
EBV = Elbasvir EMP = Empagliflozin ENM = Enalapril maleate
ENT = Entacapone
ERD = Erdosteine
ET = Etodolac
ETB = Emtricitabine EZT = Ezetimibe FA = Fenofibric acid FEN = Fenofibrate
GAANN = Genetic algorithm artificial neural networks GA-PLS = Genetic algorithm partial least square GLM = Glimepiride
GLZ = Gliclazide GMI = Gemifloxacin GRV = Grazoprevir GUA = Guaifenesin HB = p-Hydroxybenzaldehyde HCT = Hydrochlorothiazide
HP = Haloperidol
HPLC = High-performance liquid chromatography
IBU = Ibuprofen
IMB = Imatinib
IMD = Imidapril hydrochloride ISX = Isoxsuprine LAM = Lamivudine LDV = Ledipasvir
LES = Lesinurad
LEV = Levodopa
LS-SVM = Least squares support vector machine LV = Latent variable
MCR = Mean centering ratio spectra MET = Metformin hydrochloride MF = Mometazone furoate
MNZ = 2-Methyl-5-nitro-1H-imidazole
MP = Methylparaben
MTZ = Metamizole
NAP = Naproxen
NAPH = Naphazoline hydrochloride
NEO = Neomycin
NF = Norfloxacin
NIF = Nifuroxazide
NLP = Nalbuphine
NMR = Nuclear magnetic spectroscopy
NP = 4-Nitrophenol
ONZ = Ornidazole
OXI = Oxidative degradation products PC = Principal component
PCR = Principal component regression PCT = Paracetamol
PH = Phenobarbitone
PHE = Phenylephrine
PHEN = Phenylephrine hydrochloride PHZ = Phenazopyridine hydrochloride
PIM = Pimozide
PIO = Pioglitazone
PLSR = Partial least square regression PP = Papaverine hydrochloride PROPI = Propyphenazone PrP = Propylparaben
PZ = Prazosin
RAM = Ramipril RIS = Risperidone ROS = Rosuvastatin Calcium
RMSEC = Root mean square error of calibration RMSECV = Root mean square error of cross-validation RMSEP = Root mean square error of prediction RSE = Relative standard error
SAX = Saxagliptin SFB = Sofosbuvir SL = Salbutamol sulfate
SMLR = Stepwise multiple linear regression SMT = Simvastatin
SOF = Sofosbuvir SPR = Spironolactone SRA = Spectral residual augmented STA = Stavudine
STG = Sitagliptin
SVR = Support vector regression TAF = Tenofovir alafenamide fumarate TC = Thiocolchicoside THEO = Theophylline
Laela Hayu Nurani et al.
TMP = Trimethoprim
TRM = Tramadol
TZ = Tinidazole
VAL = Valsartan
VDG = Vildagliptin VEP = Velpatasvir
VNC = Vancomycin
GLZ = Gliclazide
■ INTRODUCTION
Spectroscopy is a discipline concerned with the interaction between electromagnetic radiation in certain wavelengths and samples. Ultraviolet-Visible (UV-Vis) spectrophotometry is a common analytical method used in the routine analytical laboratory and pharmaceutical industry due to its simplicity and rapidity. The versatility of instruments, the simplicity of analytical procedures, and the method performance make UV-Vis spectroscopic method widely used for content determination of pharmaceutical dosage forms. This spectroscopic technique is also more economical compared to other spectroscopic techniques like infrared and NMR and other instrumental methods like chromatography and electrophoresis [1-2]. In UV-Vis spectroscopy, electrons in analytes absorbing UV radiation (200–400 nm) and visible radiation (400–800 nm) are excited from the ground state into excited states. UV-Vis spectroscopy is quantized, in which only electromagnetic radiation with a precise energy level can make electronic transitions [3].
UV-Vis spectroscopy is a method of choice for the determination of a single component in pharmaceutical preparations. Unfortunately, pharmaceutical products typically contain two or more active pharmaceutical products having chromophoric agents capable of absorbing UV-Vis beams [4], causing signal overlapping that challenges the analysis. Quantitative analysis of spectroscopic methods is based on Lambert-Beer’s law, which relates to the absorbance and concentration of analytes, as depicted in Eq. (1).
A abc (1)
in which A is the absorbance value, a is the specific absorptivity of analytes which depends on wavelength and solvents used, b is the cuvette thickness, and c expresses the concentration of analytes.
The main challenge of UV-Vis spectroscopy for simultaneous quantitative analysis of more than one active chromophoric compound in the same mixtures is
the presence of overlapping UV spectra. Consequently, the absorbance value in a certain wavelength is added from each chromophoric compound in the mixture.
Under computer-controlled spectrophotometers, some efforts have been made to resolve the overlapping UV- Vis spectra coming from the mixtures of compounds, including derivative spectrophotometry or its combination with chemometrics [5-6], Vierordt’s method and its modified method [7], H-point standard addition method [8], and chemometrics of multivariate calibration such as CLS, SMLR, PCR, PLSR, GA-PLS and ANNs [9].
■ METHOD
Reputable databases including Scopus (http://www.scopus.com/), Web of Science (http://webofknowledge.com/), DOAJ (doaj.org), ScienceDirect (http://www.sciencedirect.com/), PubMed (http://www.ncbi.nlm.nih.gov/pubmed), Springer Link (http://link.springer.com/), American Chemical Society (https://pubs.acs.org/), Wiley Online Library (http://onlinelibrary.wiley.com/), recognized books, abstracts and non-indexed journals were explored while searching the literature. The keywords used were “UV-Vis spectroscopy”, “Chemometrics”,
“UV-Vis spectroscopy for assay for Active Pharmaceutical Ingredients”, “UV-Vis spectroscopy for assay for Pharmaceutical Products”. This procedure was adopted by Hosssain et al. [10].
■ DISCUSSION Chemometrics
Chemometric methods are powerful tools used in analytical chemistry to extract chemical data into more understandable information. The application of chemometrics in the quality control of pharmaceutical products is continuously increasing due to the advanced development in statistical software and instrumentation that allow the exploration of new issues in analytical
Laela Hayu Nurani et al.
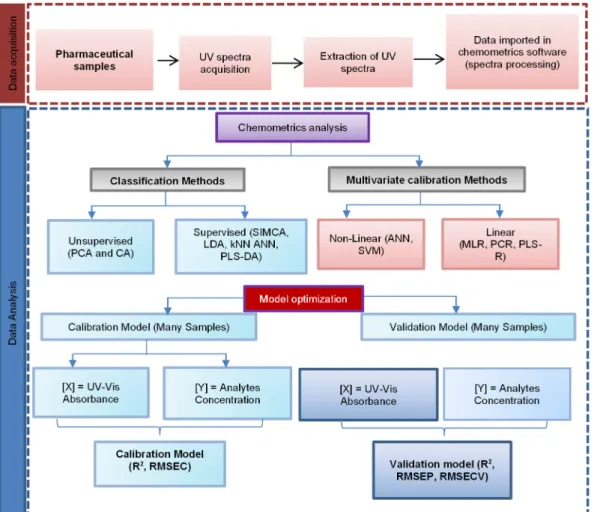
chemistry [10]. The term chemometrics originated from the word kemometri (kemo refers to chemistry and metri refers to measure) and was first introduced by Svante Wold in 1972. Chemometrics is considered an interdisciplinary study combining mathematical and statistical methods with chemistry to extract chemical information from chemical data. Chemometrics is a science related to the measurements of responses, including from UV-Vis spectra, to be extracted into more understandable information [11]. In spectroscopic applications, the chemometric techniques widely used in pharmaceutical analysis are UV-Vis spectral processing, pattern recognition or classification methods, and regression methods using multivariate data [12], as shown in Fig. 1.
Among chemometrics techniques, multivariate calibrations such as CLS, SMLR, PCR, PLSR, GA-PLS,
and ANNs [9] are typically used. PCR and PLSR methods are considered inverse calibration methods in which the concentrations in y-axes are modeled using absorbance values in x-axes [13]. The inverse calibration of PLS and PCR in which the concentration (y-axis) is modeled with UV-Vis spectra (x-axis) is the most widely multivariate calibration applied for the quantitative analysis of API, degradation products, and impurities with overlapping UV-Vis spectra. Multivariate calibrations offered reliable prediction models of analytes because they used some absorbances in large wavenumber ranges, thus enhancing the model's accuracy. In PCR and PLSR, the original variables were converted to LVs, and then LVs used as variables to be modeled with analyte concentrations. The phenomena of under-fitting and over-fitting must be considered by comparing the model performances in calibration and validation models [14].
Fig 1. The Schematic representation regarding the chemometrics technique application using UV-Vis spectral absorbances variables. See list of abbreviation
Laela Hayu Nurani et al.
Application of UV-Vis Spectroscopy and Chemometrics for Determination of Active Pharmaceutical Ingredients
The combination of chemometrics with UV-Vis spectroscopy as a non-destructive analytical method has been widely employed to: (1) determine the levels of API in pharmaceutical preparations, (2) quantify APIs and their metabolites in the biological fluids, (3) determine the degradation products of APIs occurring during process and storage, (4) perform the quantitative analysis of impurities in APIs, and (5) identify the counterfeits in pharmaceutical products [15-17].
UV-Vis spectra contain a lot of data that can be used for multivariate analysis. The absorbance values could be extracted for the analytical assay of the targeted compounds. To analyze multiple compounds, chemometrics is required to obtain more selective and sensitive results. The spectra pre-processing treatments could be applied prior to data extraction, such as spectra normalization, baseline correction, and spectra derivatization, to improve the analysis results. Hundreds of variables resulting from data extraction are used for chemometrics analysis. Several data pre-processing could also be applied before chemometrics analysis, such as data scaling and mean-centering to obtain good data variation.
For quantitative analysis, multivariate calibrations of PLS and PCR could predict the concentration of compounds with high accuracy and high precision using the optimized variables. PLSR searches the latent variables which have essential roles in concentration prediction.
Meanwhile, PCR builds a regression model using factors from principal components generated from variables. The optimization of variables was evaluated using the coefficient of determination (R2) both in the calibration and validation model to measure good fitness and error values demonstrated by RMSEC, RMSEP, and RMSECV.
High R2 values and low error values are required to be categorized as good models. Chemometrics offers advantages for the simultaneous analysis of analytes.
However, the calibration model used for certain pharmaceutical products could not be extended to other formulations with different compositions. Therefore, the
different formulas of pharmaceutical products need new model optimization of the multivariate calibrations [18].
Assay of Active Pharmaceutical Ingredients in Pharmaceutical Dosage Form
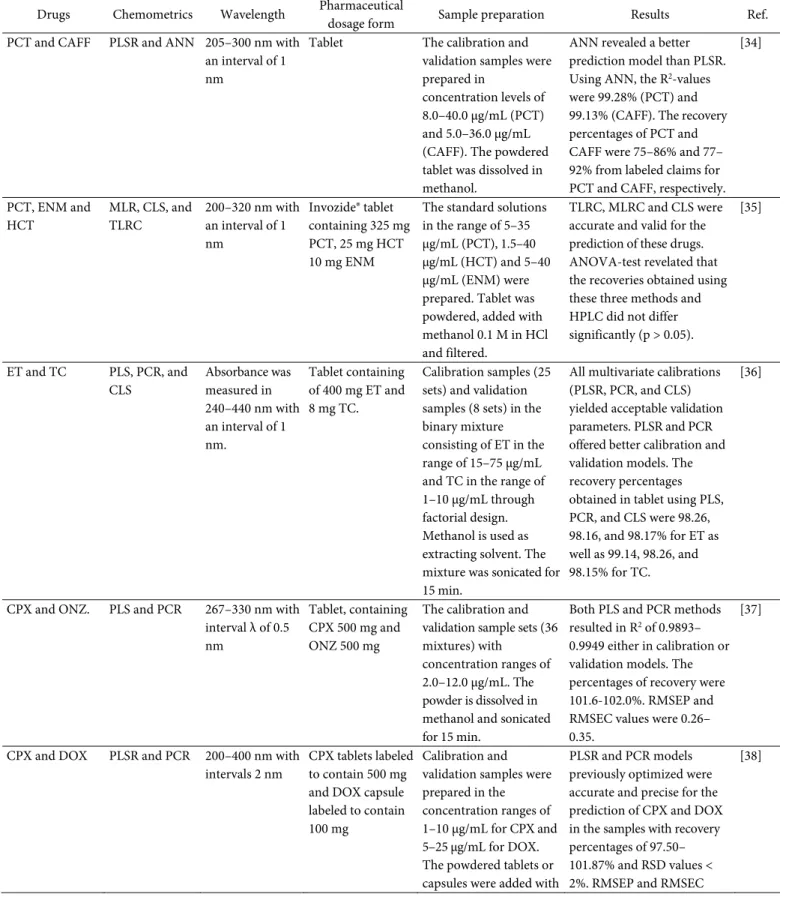
Table 1 compiled the reported publications regarding the use of UV-Vis spectroscopic methods in combination with multivariate calibrations for the determination of API in raw materials and in pharmaceutical preparations. Multivariate calibration- assisted UV spectroscopy was developed for the simultaneous analysis of four APIs, namely PCT, DPH, CAFF, and PHEN in the tablet. Seventeen samples mixture of these ingredients prepared in different ratios were used for PCR and PLSR analysis. UV measurement was performed at 240–320 nm with an interval of 1 nm.
The UV spectra were then extracted for PCR and PLSR analysis. Additionally, HPLC analysis was performed coupled with chemometrics for the assay of PCT, DPH, CAFF, and PHEN. HPLC was carried out in isocratic mode using the mobile phase of MeOH-KH2PO4 buffer (pH 3, 10 mM) (50:50 v/v) delivered isocratically at 0.81 mL/min. Compound separation was performed using a Phenomenex ODS column and the detection of analytes was carried out at 220 nm. The HPLC method was validated by determining the performance characteristics, including linearity, selectivity, accuracy, precision, and robustness. The results obtained from UV spectroscopy measurement were compared statistically with the results obtained using the HPLC method. The initial step in UV measurement was wavelength optimization providing the best calibration models providing the best predictive capability between actual and predicted values of analytes using PCR and PLSR, as indicated by the highest R2 and low RMSEC, RMSEP and RMSECV. Finally, the absorbance values at 240–320 nm applying an interval of 1 nm were selected. The calibration and validation samples were prepared in the concentration ranges of 2–16, 80–400, 4–14, and 20–
120 μg/mL for PCT, DPH, CAFF and PHEN, respectively. The results showed that PCR and PLSR showed good accuracy and precision at the selected variables (PCs and LVs) with low values of RMSEC and
Laela Hayu Nurani et al.
Table 1. The use of spectroscopy UV-Vis in combination with chemometrics for determination of active pharmaceutical ingredients in pharmaceutical dosage forms*
Drugs Chemometrics Wavelength Pharmaceutical
dosage form Sample preparation Results Ref.
PCT and CAFF PLSR and ANN 205–300 nm with an interval of 1 nm
Tablet The calibration and validation samples were prepared in
concentration levels of 8.0–40.0 μg/mL (PCT) and 5.0–36.0 μg/mL (CAFF). The powdered tablet was dissolved in methanol.
ANN revealed a better prediction model than PLSR.
Using ANN, the R2-values were 99.28% (PCT) and 99.13% (CAFF). The recovery percentages of PCT and CAFF were 75–86% and 77–
92% from labeled claims for PCT and CAFF, respectively.
[34]
PCT, ENM and HCT
MLR, CLS, and TLRC
200–320 nm with an interval of 1 nm
Invozide® tablet containing 325 mg PCT, 25 mg HCT 10 mg ENM
The standard solutions in the range of 5–35 μg/mL (PCT), 1.5–40 μg/mL (HCT) and 5–40 μg/mL (ENM) were prepared. Tablet was powdered, added with methanol 0.1 M in HCl and filtered.
TLRC, MLRC and CLS were accurate and valid for the prediction of these drugs.
ANOVA-test revelated that the recoveries obtained using these three methods and HPLC did not differ significantly (p > 0.05).
[35]
ET and TC PLS, PCR, and CLS
Absorbance was measured in 240–440 nm with an interval of 1 nm.
Tablet containing of 400 mg ET and 8 mg TC.
Calibration samples (25 sets) and validation samples (8 sets) in the binary mixture consisting of ET in the range of 15–75 μg/mL and TC in the range of 1–10 μg/mL through factorial design.
Methanol is used as extracting solvent. The mixture was sonicated for 15 min.
All multivariate calibrations (PLSR, PCR, and CLS) yielded acceptable validation parameters. PLSR and PCR offered better calibration and validation models. The recovery percentages obtained in tablet using PLS, PCR, and CLS were 98.26, 98.16, and 98.17% for ET as well as 99.14, 98.26, and 98.15% for TC.
[36]
CPX and ONZ. PLS and PCR 267–330 nm with interval λ of 0.5 nm
Tablet, containing CPX 500 mg and ONZ 500 mg
The calibration and validation sample sets (36 mixtures) with
concentration ranges of 2.0–12.0 μg/mL. The powder is dissolved in methanol and sonicated for 15 min.
Both PLS and PCR methods resulted in R2 of 0.9893–
0.9949 either in calibration or validation models. The percentages of recovery were 101.6-102.0%. RMSEP and RMSEC values were 0.26–
0.35.
[37]
CPX and DOX PLSR and PCR 200–400 nm with intervals 2 nm
CPX tablets labeled to contain 500 mg and DOX capsule labeled to contain 100 mg
Calibration and validation samples were prepared in the concentration ranges of 1–10 μg/mL for CPX and 5–25 μg/mL for DOX.
The powdered tablets or capsules were added with
PLSR and PCR models previously optimized were accurate and precise for the prediction of CPX and DOX in the samples with recovery percentages of 97.50–
101.87% and RSD values <
2%. RMSEP and RMSEC
[38]
Laela Hayu Nurani et al.
aquadest, ultrasonicated for 15 min, filtrated, and subjected to UV spectra measurement.
values were 0.142–0.208 and 0.278–0.824. High recoveries and low values of RSD, RMSEC and RMSECV indicated that the developed method was acceptable for predicting unknown samples containing CPX and DOX.
ATV and EZT PLSR and PCR 230–260 nm with an interval of 0.5 nm
Tablet, containing ATV 10 mg and EZT 10 mg
Twenty-eight (28) calibration sample sets and eight (8) validation sample set at the level of 5.0–30.0 μg/mL were prepared. The powder was dissolved in methanol.
Both PLSR and PCR resulted in recovery percentages of about 100% (for accuracy studies) with RSD values
< 2% (for precision studies).
The LoD and LoQ values using PLS or PCR were 0.53 and 1.61 μg/mL (ATV) and 0.18 and 0.57 μg/mL (EZT).
[39]
MET and GLZ PLSR and CLS 220–278 nm with an interval of 3 nm
Tablet Fixed Dose Combination (FDC) containing 500 mg MET and GLZ 30–80 mg
The concentration ranges were 8–20 μg/mL (MET) and 1–5 μg/mL (GLZ). FDC Tablet was powdered, added with MeOH and sonicated for 10 min, filtered, and scanned.
PLSR offered a better accuracy model than CLS.
The values of LOD using PLSR were 0.0965 μg/mL (MET) and 0.0441 μg/mL (GLZ).
[40]
PCT, PROPI, and CAFF
PLSR 220–313 nm with an interval of 3 nm
Tablet containing 250 mg PCT, 150 mg PROPI, and 50 mg CAFF
Tablet was powdered, dissolved with methanol, sonicated for 10 min, filtered, and scanned.
The R2 values for the relationship between actual and calculated values were 0.9994, 0.9878, and 0.9919 for PCT, PROPI, and CAFF, respectively. RMSEC values were 0.027–0.082%. The recovery percentages obtained were 90.70, 90.49, 103.38% for PCT, PROPI, and CAFF from the labeled claim.
[41]
BET and NEO) PLSR 200–400 nm Cream containing BET 1 mg and NEO 5 mg
Creams were added with 96% EtOH and
homogenized. The mixture was subjected to sonication for 15 min.
The standard addition method was used by spiking samples with standard solutions.
The recovery percentages of BET and NEO were 91.35%
and 97.56% from labeled claimed. RSD values for BET and NEO were 0.93% and 1.73%. RMSEC values were 0.0230 and 0.3553, with RMSEP values of 0.1558 and 0.0820. The predictive ability of the developed method meets the requirement for cream dosage form according to USP XXX.
[42]
VEP and SOF CLS, PCR, PLSR and GAPLS
230–400 nm with an interval 1 nm
Tablet consisted of VEP 100 mg and SOF 400 mg.
VEP and SOF were prepared in the levels of 5–9 μg/mL and 24–
The recovery percentages and RSD values of VEP and SOF using CLS, PCR, PLS, and
[43]
Laela Hayu Nurani et al.
32 μg/mL. The powdered tablet was dissolved in methanol.
GAPLS are acceptable. One- way ANOVA indicated that there is no significant difference (p > 0.05) for four recoveries.
EBV and GRV ANN and GAANN models
230–400 nm with 1 nm interval
Tablets containing of EBV 50 mg and GRV100 mg.
13 calibration samples and 12 validation samples at levels of 1–9 μg/mL EBV and 6–14 μg/mL GRV. The powdered tablet was dissolved in methanol.
The recovery percentages were in the range of 99.76–
100.27%. RMSEC and RMSEP values were 0.1247–
0.2968 and 0.2065–0.3018.
The results obtained using UV spectroscopy combined with ANN and GAANN do not differ statistically from HPLC method based on ANOVA test.
[44]
LES and ALP PLSR, PCR, and GAPLS
240–280 nm with an interval of 1 nm
172, Tablets containing 200 mg LES and 300 mg ALP
Thirteen sample mixtures were applied in the calibration set, and twelve samples were used in the validation set at levels of 4–12 μg/mL LES and 6–18 μg/mL ALP.
The powdered tablet was dissolved in methanol.
All multivariate calibrations were acceptable, as indicated by R2 and low values. The mean recoveries for LES and ALP were 99.56 and 99.85 (PCR), 100.63 and 100.73 (PLSR), 100.37 and 100.01 (GAPLS). There is no significant difference (p > 0.05) between UV spectroscopy combined with PLSR, PCR, and GAPLS with HPLC method.
[45]
PHEN and CTM CLS and PCR 200–400 nm with an interval of 3 nm
Sine Up syrup labeled to contain 100 mg% PHEN and 50% CTM
10 calibration solutions and 10 validation solutions with
concentrations range 10–
60 μg/mL (PHEN) and 4–30 μg/mL (CTM).
Determination of PHEN and CTM in authentic,
laboratory-made samples and syrup dosage form using CLS and PCR resulted in acceptable values of
recoveries (98.1–100.7%). UV spectroscopy is comparable with HPLC (P > 0.05).
[46]
DRV and CBS CLS and PLSR UV spectra at 235–285 nm with an interval of 1 nm
Binary mixture and tablets. Tablet consisted of DRV 800 mg and CBS 150 mg.
Twenty-five and eight samples for calibration and validation datasets were designed using the experimental design of a multilevel multifactor with concentration ranges of 5–30 μg/mL either in DRV or CBS.
Both PLSR and CLS methods provide high R2 (0.996–0.999) for DRV and CBS. PLSR provided better sensitivity and accuracy than CLS. The recoveries of DRV and CBS in tablets using PLS were 99.71 ± 0.13 and 99.27 ± 0.54.
ANOVA test informed that there is no significant difference (p > 0.05) between UV spectroscopy-
multivariate calibrations and HPLC method.
[47]
Laela Hayu Nurani et al.
GLM and PIO Residual augmented CLS (ARCLS), PCR, and PLSR
215–235 nm in the intervals of Δλ of 0.4 nm
Amaglust® tablets containing 4 mg GLM and 30 mg PIO
Set calibration and validation mixtures were prepared with
concentration ranges of 24–60 μg/mL for PIO and 3.2–8 μg/mL for GLM. The powder equivalent to PIO 30 mg and GLM 4 mg was dissolved with ACN, sonicated for 15 min and filtered using filter paper 0.45 μm.
PLSR and PCR were selected because the statistical performances were acceptable, as indicated by high R2 and low values of RMSEC, RMSEP, and RMSECV. There is no significant difference for mean recovery between the HPLC and UV spectroscopy- PLSR, UV-PCR and UV- ARCLS.
[48]
AML and VAL related
ANN and LS- SVM
200−500 nm with an interval of 1 nm
Tablet dosage forms containing 10 mg AML and 160 mg VAL
The standard solutions used as calibration and validation samples were prepared with levels of 5−25 μg/mL AML and 9−5 μg/mL VAL. Ethanol was used as the solvent.
LS-SVM is the preferred method offering recovery percentages of 100.22% (RSD of 2.719%) for AML and 100.37% (RSD of 0.7342%) for VAL. No significant differences were observed (p
> 0.05) between HPLC and the proposed method.
[49]
ATN, RAM, HCT, SMT and ASP
PLSR and Genetic algorithms-PLS
210–330 nm with interval of 1 nm
Polycap™ capsules containing ATN50 mg, HCT 12.5 mg, RAM 5 mg, SMT 20 mg and ASP100 mg.
The calibration and validation solutions were prepared in methanol with levels of 6–22, 4–16, 10–30, 10–30 and 2–8 μg/mL for ASP, SMT, ATN, RAM, and HCT, respectively.
The recovery percentages obtained using PLSR, GA- PLS and HPLC methods are not significantly different (p
> 0.05) using ANOVA test.
The recovery percentages of all drugs were in the range of 98.06–100.07%.
[50]
Sulphonamides and TMP
CLS, PCR and PLSR
200–350 nm with an interval of 1 nm
Tablets of Sulphonamides (sulfadiazine, sulfamethoxazole, sulfadimidine and sulphanilamide)
The synthetic mixtures containing these compounds were used in calibration (16 mixtures) and validation (16 samples) models spanning the
concentration ranges of 2–6 μg/mL.
PLSR and PCR provide better prediction models than CLS.
The percentages of relative errors were 2–10%. The recovery percentages were close to 100% indicating that UV spectra combined with PLS and PCR were accurate and precise for
sulphonamides drugs analysis.
[51]
VEP and SOF ANN and GAANN
UV spectra at 200–380 nm with an interval of 1 nm
Tablets (VEP 100 mg and SOF 400 mg)
Tablet was powdered, added with methanol, filtered, and subjected to UV spectral
measurement. The calibration and validation sets were prepared with levels of 5–9 μg/mL VEP and 24- 30 μg/mL SOF.
Both methods offered acceptable accuracy and precision with recovery percentages of 99.48–
100.75% (VEF and SOF).
RSD values were < 2%. No significant difference between the student t-test and the F- test.
[52]
LEV and CAR PLSR UV spectra at 200–300 nm and
Five laboratory samples were made
LEV was prepared at 15.4–57.1 μg/mL and
LEV and CAR can be simultaneously analyzed
[53]
Laela Hayu Nurani et al.
at 300–600 nm after reaction with KIO4
by mixing LEV and CAR and tablet formulation
CAR at 3.4–17.1 μg/mL.
The powder was added with 0.1 M HCl, sonicated for 30 min, centrifugation at 3500 rpm for 15 min and filtered.
using PLSR without sample pre-treatment. No significant difference between the proposed and HPLC methods (p > 0.05).
Quaternary mixture of IMB, GMI, NLP and NAP
PLSR using normal and derivative spectra
200–400 nm with 0.2 nm intervals
Tablets containing 100 mg IMB per tablet, 320 mg GMI per tablet, 500 mg NAP per tablet and ampule containing 20 mg NLP per mL
Concentration of IMB, GMI, NLP and NAP in the calibration and validation sets were 4–8, 3–11, 10–18, and 1–3 μg/mL, respectively. For tablet: the powder was added with MeOH, sonicated for 30 min, filtered, and scanned.
PLSR using original (normal) and first derivative spectra provide a close correlation between predicted values and labeled claims with recovery percentages of 98.5–102.4%.
[54]
EMP and MET PLS-2 200–300 nm with 0.1 nm intervals
Tablets containing 12.5 mg EMP and 500 mg MET per tablet
Both EMP and MET in calibration and validation sets were prepared in the concentration ranges of 2–10 μg/mL. The powdered tablet was dissolved with methanol.
The levels of EMP and MET in the tablet yielded the mean of the recovery percentages and SD was 95.57% ± 0.49 and 102.16% ± 0.35, respectively using PLS-2 method. T-test of recovery percentages showed no significant difference between UV-PLS-2 and UPLC.
[55]
DP, PH, and PP PLSR and PCR 200–380 nm with 1 nm intervals
Tablet containing DP150 mg, PH 20 mg, and PP 30 mg.
Calibration and validation sets were prepared using 23 sample mixtures at ranges of 10–25 μg/mL for DP and 1.5–5 μg/mL for PH and PP.
Powdered tablet was dissolved with methanol.
Both multivariate calibration methods were reliable for simultaneous quantification of DP, PH and PP as indicated by high R2 and low values of RMSEC and RMSECV. Student’s t-test and the F-ratio showed no significant differences observed (p > 0.05) between HPLC and the proposed methods.
[56]
THEO PLSR 210–350 nm with
an interval of 1 nm
Syrup containing 8.0 mg/mL THEO
Syrups containing THEO were subjected to dilution with NaOH 0.1 M.
PLS could accurately predict the levels of THEO in syrup.
There is no significant difference for THEO levels using UV spectroscopy-PLS and HPLC methods.
[57]
GUA, SL, with the presence of preservatives of MP and PrP
PLSR and PCR 232–300 nm with intervals of 0.8 nm
Syrup (5 mL) containing GUA 50 mg, SL 2 mg, MP 3 mg and PrP 1.5 mg
A training set of 25 mixtures in calibration and validation sets in 0.1 M NaOH with a concentration range of 20–60, 1–3, 1–5, and 0.6–
1.8 μg/mL for GUA, SL, MP, and PrP,
Both methods could provide accurate and precise results with recovery percentages (±
SD) of 100.0–100.1% (± 0.15–
0.48). One-way ANOVA indicated that both methods were not significantly
[58]
Laela Hayu Nurani et al.
respectively. Syrup was diluted with NaOH 0.1 M.
different to HPLC method with a P-value of > 0.05.
AC and BX with the presence of preservatives of MP and PP.
PLSR and PCR 235–275 nm with an interval of 0.4 nm
Each 5 mL Syrup contains AC 100 mg, BX 4 mg, MP 4.5 mg, and PP 0.5 mg.
A training set of 25 mixtures in calibration and validation sets 0.1M HCl in the concentration range of 20–80, 1–5, 1–5, and 0.2–1.8 μg/mL for AC, BX, MP and PP, respectively. Syrup was diluted with HCl 0.1 M.
Both methods could provide reliable results with recovery percentages (± SD) of 99.8–
100.1% (± 0.13-2.10). One- way ANOVA indicated that both methods were not significantly different to HPLC method with a P-value of > 0.05.
[58]
LAM and STA CLS and PCR 200–310 nm with an interval of 1 nm
Tablet containing 150 mg LAM and 30 mg STA
Standard solutions were prepared for calibration and validation sets at levels of 2–12 and 3–15 μg/mL for LAM and STA. The powdered tablet was diluted with 0.1 M HCl, sonicated, and filtered.
The methods were accurate, with acceptable recoveries in most cases. The deviation ranges of LAM and STA between actual and predicted were 0.28% and 1.57% (CLS), 0.03% and 1.77% (PCR), respectively.
[59]
PCT and TRM PLSR and GA- PLS
200–320 nm with interval 1 nm
Tablets containing PCT 325 mg and Tramadol 37.5 mg.
The working solution was in the range of 15–37 μg/mL for PCT and 1.7–
4.3 μg/mL for TMD. A- 25 standard mixtures were used in the calibration and validation dataset.
The reliable model was achieved using PLSR method for PCT with a mean recovery of 99.5% and RSE of 0.89%. GA-PLS was the preferred method for TRM with a mean recovery of 99.4% and RSE 1.69%.
[60]
MTZ, B1, and B6 Multivariate calibration of PLSR
200–400 nm with a 2 nm interval
The tablet dosage form containing 500 mg of MET, 50 mg of B1, 100 mg of B6, and 100 μg of B12
The stock solutions were prepared freshly in HCl 0.1 M and used for preparing 20 calibration samples and 10 validation samples at levels of 9–48, 0.01–0.19, and 2–19 μg/mL for MET, B12,B1 and B6.
The methods have good accuracy with R2 (RMSEP) values were 0.999 (0.3993%);
0.999 (0.1926%); 0.999 (0.1434%) for MET, B1 and B6, respectively.
[61]
SFB and LDV PLS, CWT, and DS
200 to 400 nm with a 1 nm interval
Commercial tablets containing SFB 400 mg and LDV 90 mg.
The calibration and validation datasets were made at ranges of 24–64 and 6–16 μg/mL in ACN for SFB and LDV, respectively.
Each method has a good correlation coefficient with a value of R2 > 0.99. The method was compared with HPLC. ANOVA reveals there are no significant differences among methods (p > 0.05).
[62]
RIS and HP LS-SVM, FIS, ANFIS
200–300 nm Tablets containing RIS and HP
The standard solutions in calibration and validation datasets were prepared in MeOH at 6–
75 μg/mL for RIS and HP.
RMSE values using FIS and ANFIS models were 0.878, 2.124, and 0.285, 0.206 for RIS and HP. ANOVA test exhibited no significant differences between the
[63]
Laela Hayu Nurani et al.
proposed and HPLC methods.
VDG, SAX and STG
PLSR, GA-PLS, ANN, and GA- ANN
190–400 nm with 0.5 nm intervals
Januvia® tablets (100 mg STG), Onglyza® tablets (5 mg SAX), Galvus®tablets (50 mg VDG)
Training sets in calibration and validation datasets were prepared at ranges of 10–
22, 24–40, and 82–130 μg/mL for VDG, SAX, and STG, respectively.
PLSR, GA-PLS, ANN, and GA-ANN were successfully developed for the prediction of analytes. No different results (p > 0.05) between the proposed method and HPLC.
RMSEC values were low, indicating a precise method.
[64]
PIM CLS, PCR, and
PLSR
240–370 nm Orape forte®
containing 4 mg of PIM per tablet
The samples was prepared in a
concentration range of 30–60 μg/mL PIM in methanol, 20–60 μg/mL in alkaline, and 20–60 μg/mL in Acidic solution.
The proposed method was successful for PIM quantification in tablets without interference. No significant difference (p >
0.05) between the proposed and HPLC methods. RMSEP values were 0.0030, 0.0028, and 0.0072 for CLS, PCR, and PLSR.
[65]
PCT, IBU and CAFF
PLSR, GA-PLS, and PC-ANN
200–400 nm with interval of 1 nm
Tablet containing PCT 325 mg, IBU 200 mg and CAFF 40 mg.
Standard solutions were prepared in MeOH -0.1 M HCl (3:1). Two sets of calibration and
validation samples were prepared in 25 and 20 mixtures.
UV spectra combined with these multivariate
calibrations are accurate and precise methods as indicated by acceptable recoveries and RSD-values.
[66]
AML, VAL and HCT
PLS-1, GA-PLS, ANN, GA- ANN and PCA-ANN
200–400 nm EXFORGE HCT®
tablets containing AML5 mg, Val160 mg, and HCT 12.5 mg.
Training sets used in calibration and validation data sets were prepared in methanol.
The combination of UV spectra and five multivariate calibrations provide an accurate and precise quantitative analysis.
[67]
CEL and DIA CLS, ILS, PCR, and PLSR
200–400 nm Capsule OSTEGARD®, Containing 100 mg and 200 mg.
Twenty-five training sets in calibration and validation datasets were prepared in the range of 5–25 μg/mL (CEL) and 3–15 μg/mL (DIA).
The proposed methods provide comparable results, and there are no significant differences among methods (p > 0.05).
[68]
HCT and BZ PLSR and SVR 220–350 nm Cibadrex® tablets containing 20 mg of BZ and 25 mg of HCT
The stock solutions were made to obtain 100 μg/mL of HCT and BZ and 30 μg/mL of HCT and DSA working solutions. The samples were dissolved in methanol, filtered, and diluted to obtain 100 μg/mL working solution.
UV spectra-multivariate calibrations provide accurate analysis of HCT and BZ in the presence of HCT impurities as indicated by acceptable mean percentage recoveries of 100.01–
101.01%, which are comparable to HPLC method.
[69]
SMT and EZT polynomial least squares based on
200-400 nm Tablets (40 mg of SMT and 10 mg of EZT), Tablets (20 mg SMT and 10
Stock solutions were made at a concentration of 1 mg/mL of SMT and EZT, respectively.
The proposed method is reliable for the simultaneous determination of drugs in mixtures with acceptable
[70]
Laela Hayu Nurani et al.
Savitzky-Golay (SG) filters.
mg of EZT), Zocozet tablets (10 mg SMT and EZT)
Working solutions of SMT were made at a concentration of 100 μg/mL of SMT and EZT.
accuracy and precision. The method is successful in the analysis of raw materials and pharmaceutical preparations.
PAR, GUA, and PHE
CRACLS, MCR-ALS, PCA-ANN
200-400 nm with 2 nm intervals
Panadol® COLD + FLU All in One Tablet (containing 250 mg of PAR, 100 mg GUA, and 5 mg PHE)
The standard solutions were made at 100 mg/mL in MeOH. The
calibration and validation samples were made at ranges of 40–50, 16–20, and 1–9 μg/mL for PAR, GUA, and PHE.
The proposed method was valid for the simultaneous determination of PAR, GUA, and PHE in tablets without any separation step.
[71]
ENT, LEV and CAR
Multivariate calibration of PLSR
UV-Vis spectra at 200–600 nm with an interval at 2 nm
Stalevo® tablets (market sample) nominally containing 200 mg ENT, 150 mg LEV and 37.5 mg of CAR per tablet
The standard solutions of ENT, LEV and CAR at 100, 300, and 300 μg/mL were dissolved in methanol-water (7:3).
The developed method was reliable for simultaneous quantitative analysis of drugs in tablets without any separation step.
[72]
DPF and SAX FZM, FDM, and FRM
200-400 nm Onglyza® tablets contain 5 mg SAX and Forxiga®
tablets contain 10 mg DPF per tablet.
The stock solutions were made at a concentration of 1 mg/ML of each DPF and SAX, and each working solution were made at a concentration 0.1 mg/mL.
The methods provide good accuracy and precision for the simultaneous
determination of drugs over the concentration ranges of 2.5–50.0 (DPX) and 2.5–60.0 μg/mL (SAX).
[73]
CEF and ERD CLS and PLSR 200-400 nm Suprax® 200 capsules labeled to contain 223.8 mg CEF/capsule and Mucotec® contain 300 mg
ERD/capsule
The standard solutions of CEF and ERD were prepared in 1 mg/mL concentration. The working solutions were made at concentration ranges of 20–30 (CEF) and 15–45 μg/mL (ERD).
The developed method was reliable for the simultaneous determination of drugs in dosage form with acceptable recoveries. The accuracy and precision of the proposed method were comparable with the HPLC reference method.
[74]
AML, CEL, and RAM
ACM 210–400 nm Cardace®AM
tablets containing AML 10 mg and RAM 10 mg.
The standard stock solutions were made in 100 μg/mL concentration for AML and CEL. The sample solutions were prepared at 5–60, 5–30 and 5–110 μg/mL for AML, CEL and RAM.
The LoD is 0.5781–0.7132, 0.6497–1.0450, and 0.0001–
0.0003 μg/mL for AML, CEL, and RAM. No significant difference between the proposed method and the reference method (p > 0.05).
[75]
VNC and CPX PLSR and ANN 190-400 nm Vancomycin with 99.80% purity and Ciprofloxacin with 99.30%
The stock solutions were made in 100 μg/mL concentration. The working solutions were prepared in the concentration range 3–
30 and 1–10 μg/mL for VNC and CPX.
The methods have high %recovery, 98.79 and 98.23% for VNC and CPX.
There are no significant differences between the proposed and reference methods. The RMSEP values for PLS-1 were 0.07 and 0.06% for VNC and CPX and
[76]
Laela Hayu Nurani et al.
the RMSEP values of ANN were 0.12 and 0.11% for VNC and CPX.
AML and MET Isosbestic point and dual- wavelength methods
200–400 nm Amlodipine besylate (99.40%) and metoprolol succinate (99.20%)
The standard solutions were made in 100 μg/mL concentration. The sample solutions were made at 2–25 and 2–30 μg/mL for AML and MET.
The developed method (UV spectra-chemometrics) was reliable for the simultaneous determination of AML and MET.
[77]
*See list of abbreviation
RMSECV. The R2 values obtained were 0.9991–0.9999 either in calibration or validation models using PLSR and PCR. An assay of pharmaceutical drugs revealed that the recoveries of drugs were 101.076–103.603% (PCR) and 100.943–103.814% (PLSR), respectively. On the other hand, validation analysis using HPLC also revealed good linearity (> 0.999), good precision showed by the RSD value of less than 2%, as well as good accuracy demonstrated by the recovery values (100.85 ± 0.59 for PCT; 101.72 ± 0.31 for DPH; 101.93 ± 0.43 for CAFF;
102.91 ± 0.65 for PHEN). Statistical analysis using One- way ANOVA (p = 0.05) revealed that recoveries obtained using UV spectroscopy-PLSR, UV spectroscopy-PCR, and HPLC methods were not significantly different (p > 0.05). It can be concluded that the combination of UV spectroscopy and chemometrics (PLSR and PCR) can be used as an alternative method to HPLC with the main advantages of simple, rapid, inexpensive and not requiring a sophisticated instrument [14].
Analysis of APIs in Biological Fluids
The combination of UV-Vis spectroscopy with chemometrics of PLSR has been used for quantitative analysis not only in pharmaceuticals but also in biological fluids. Analysis of CBM in the presence of the main metabolite of CBME in human serum was successfully performed using absorbance values of second derivative spectra at the wavelength range of 280–350 nm with interval 1 nm. The use of the second derivative could eliminate the shift baseline effect present in the original UV spectra. The extraction of CBM and CBM-EP was done using benzene. Recovery percentages obtained in spiked plasma samples with 4 different levels of CBM
using the proposed method were in the range of 98.0–
101.7% with low relative percentage difference, indicating acceptable accuracy and precision. Statistical evaluations using Student’s t-test and F-test revealed that both methods did not reveal a significant difference at a confidence interval of 95% (p > 0.05). From this result, UV spectroscopy combined with PLS could be an alternative method for the determination of API in biological fluids with the presence of API’s metabolite [63]. PLS using the variable of absorbance values at 190–
350 nm with an interval 1 nm was also successful for the determination of CBM along with its metabolite (CBME). The mean recovery percentages for the determination of CBM and CBME were also performed using reference HPLC methods as a comparison to the proposed method (PLSR-UV spectra). The results showed that the recovery percentages of CBM and CBME in synthetic mixtures were 102.57 and 103.00%
(for PLS) and 99.40% and 102.20% (HPLC), respectively.
Based on the statistical test, there are no significant differences between CBM and CBME using PLSR-UV and HPLC methods (p > 0.05) [19]. UV-spectroscopy and PLSR were also successful in the analysis of amoxicillin and its metabolites in human urines with acceptable validation performance [20].
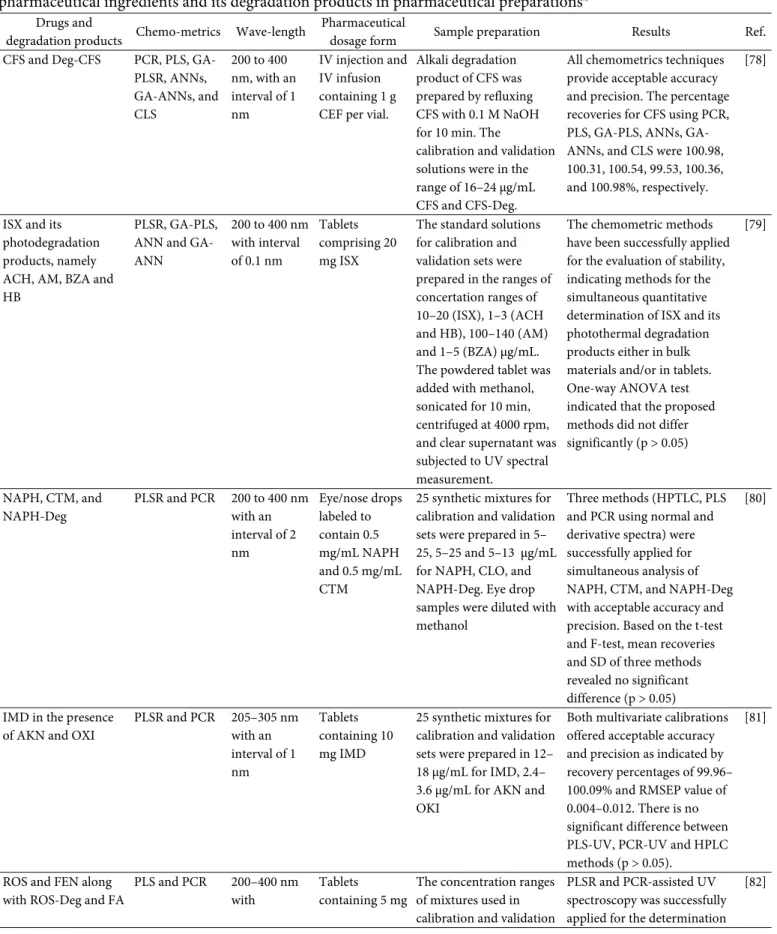
Analysis of API and Its Degradation Products UV spectroscopy using MCR and multivariate calibrations of PLSR and PCR was successfully applied for simultaneous analysis of CS and its alkaline degradation products identified as Deg-1 and Deg-2 as shown in Fig. 2. UV spectra revealed the extensive overlapping, therefore the chemometrics was applied to
Laela Hayu Nurani et al.
Fig 2. UV spectra and chemical structures of Cromolyn Sodium (a) and its degradation products identified as Deg-1 (b) and Deg-2 (c) scanned at 200–400 nm. Taken with CC-BY license
facilitate the quantification of analytes. The absorbance values after MCR at 367.8, 373.8, and 310.6 nm were used within linear concentration ranges of 2–40, 5–40, and 10–
100 μg/mL for CS, Deg-1, and Deg-2, respectively. Using MCR method, the recovery percentages ± SD obtained were 99.91 ± 1.33, 100.28 ± 1.44, and 100.61% ± 1.55 for CS, Deg-1, and Deg-2, respectively indicating that MCR is an accurate and precise method for stability-indicating assay of CS, Deg-1 and Deg-2. PCR and PLS-2 models using variables of absorbance values at wavelength 230–
400 nm with 0.2 nm intervals (851 data points) at concentration ranges of 5–13 (CS), 8–16 (Deg-1), and 10–
30 μg/mL (Deg-2). The developed method has been successfully used for quantitative analysis of CS and its degradation products in eye drops dosage form. The levels of CS in eye drops dosage form (labeled to contain 40 mg of CS/mL) were 102.40 ± 0.83 and 101.75% ± 0.69 from the claimed label [21].
The UV-Vis spectroscopy and chemometrics method were performed for the determination of MF in the presence of its degradation product. The study was
conducted in a forced degradation study of MF performed in basic conditions. Samples were scanned at the range of 220–350 nm. The UV spectra of mixtures of MF with its degradants were used for the quantification of MF. Chemometrics of PLS regression was carried out for the determination of MF concentration. The calibration model demonstrated a good mean recovery of 100.2% with low error indicated by the low value of RMSEC (0.002%). Meanwhile, the mean recovery of the validation model was 97.24%, with RMSEP of 0.04%.
The recoveries obtained from sample measurement ranged from 98.47–102.66% indicating no interference from the MF degradation products [22].
UV-Vis spectrophotometry and chemometrics have also been used for the analysis of paracetamol in the presence of its degradants resulting from the basic condition. PCA was performed to differentiate compounds obtained from UV-Vis measurement. The results of PCA suggested the presence of four compounds, namely a reactant (PCT), a degradant, and two intermediate compounds. Chemometrics of MCR-