*
Identification of fresh and expired ground roasted robusta coffee
using UV-visible spectroscopy and chemometrics
Meinilwita Yulia1,*, and Diding Suhandy2
1Lampung State Polytechnic, Department of Agricultural Technology, Jl. Soekarno Hatta No. 10, Rajabasa Bandar Lampung, 35141, Indonesia
2The University of Lampung, Faculty of Agriculture, Department of Agricultural Engineering, Spectroscopy Research Group (SRG), Laboratory of Bioprocess and Postharvest Engineering, Jl. Prof. Dr. Soemantri Brojonegoro No.1, Bandar Lampung, 35145, Indonesia
Abstract. The freshness of ground roasted coffee escapes extremely fast. For this reason, the evaluation of conservation state of ground roasted coffee must be taken into account for acceptability of coffee. Unfortunately, it is difficult to discriminate the fresh and expired ground roasted coffee physically by our naked eyes. Thus, it is desired to develop an analytical method to evaluate the fresh and expired ground roasted coffee using reliable methods. The objective of this research was to evaluate the potential of UV-visible spectroscopy and chemometrics method for classification of fresh and expired ground roasted robusta coffee. A number of 200 samples of robusta fresh coffee and 200 samples of robusta expired coffee was used. The spectral data were pre-treated using standard normal variate (SNV), moving average smoothing (window: 9) and Savitzky-Golay 2nd derivative (order: 2; window: 11). The analysis data was done statistically using multivariate chemometric techniques, including principal component analysis (PCA) and soft independent modeling of class analogy (SIMCA) in the spectral range of 230-400 nm. PCA with PC1 = 94% and PC2 = 4% showed clear clustering of samples (p ⩽ 0.05). UV-visible spectroscopy with SIMCA analysis allowed to classify between fresh and expired ground roasted robusta coffee with a correct classification rate of 100%.
1 Introduction
Coffee is the second most widely consumed beverages after water. It is approximately about 1.4 billion cups of coffee are consumed worldwide every day [1]. Indonesia shared 7.5% of 9.6 million tons total world coffee production in 2017 [2]. Lampung province is the second largest production for Robusta coffee in Indonesia. In 2016, total coffee production in Lampung (mostly Robusta coffee) is about 108 thousand tons [3]. It is about 17% of total national coffee production in Indonesia [3]. To keep the sustainability of coffee production in Indonesia, several attempts have been made to improve both production and postharvest aspects of coffee [4-5].
One important aspect of postharvest for ground roasted coffee is storage. The freshness of ground roasted coffee escapes extremely fast. During storage, comparing to green bean and roasted bean coffee, ground roasted coffee greater experiences chemical and physical changes such as volatile and CO2 release and oxidation reaction. Those reactions greatly affect the quality and acceptability of ground roasted coffee. For this reason, the evaluation of conservation state of ground roasted coffee must be taken into account for acceptability of coffee [6-7].
Several parameters such as peroxide value and methyl mercaptan have been used as indicator of freshness of coffee. The shelf life of the ground roasted coffee packed in air either in metal cans or flexible laminated materials is very short (around 1 month) [6]. It can be increased up to 4-6 month by vacuum packing. In general, ground roasted coffee storage up to 1 year cannot be accepted anymore (expired) [6].
Visually, it is very difficult to distinguish between fresh ground roasted coffee (acceptable to be consumed) and expired ground roasted coffee (not acceptable to be consumed). Physically they are almost no different although the flavour of expired coffee has been greatly changed compared to fresh one. However, when both types of those coffees (fresh and expired) are mixed, it will be very difficult to distinguish between pure fresh ground roasted coffee with adulterated one (mixed with expired coffee).
laboratories in Indonesia. Therefore, in this research, the use of UV-visible spectroscopy and chemometrics based on SIMCA method was tested to develop a classification model that are able to identify and classify the conservation state of ground roasted coffee (fresh and expired).
2 Materials and methods
2.1 Coffee samples
All coffee samples were Robusta coffee and was purchased from local market in Lampung with two different roasting. The first roasting was done in May 2016. After making coffee powder, the samples then was kept in a plastic container for more than 1.5 year. This samples were recognized as expired ground roasted coffees samples. The second roasting was done in February 2018. After grinding and sieving, the samples were immediately used for experiment. This samples were called as fresh ground roasted coffee samples. Figure 1 shows the fresh and expired ground roasted coffee sample. In this research a number of 200 samples was used for each fresh and expired, respectively. The spectral acquisition was done on aqueous coffee samples. For this, a procedure for coffee sieving and extraction was performed based on previous researches [13-17].
Fig. 1. Fresh and expired ground roasted coffee samples.
2.2 Spectral measurement
The spectral data of fresh and expired aqueous coffee samples were acquired using a UV-visible spectrometer (Genesys 10s UV-Vis Spectrometer, Thermo Fisher Scientific, USA) in the range of 190-1100 nm and 1 nm of accuracy. 3 mL of aqueous extracted and diluted coffee samples were put in quartz cuvette with 10 mm thickness. For reference, 3 mL of distilled water was put in cuvette.
2.3 PCA and SIMCA
In order to improve the quality of spectral data, the original spectral data first were pre-processed using standard normal variate (SNV), moving average
smoothing (window: 9) and Savitzky-Golay 2nd
derivative (order: 2; window: 11). To discriminate fresh and expired coffee samples, two approaches were tested:
independent modelling of class analogy (SIMCA). PCA is commonly used as an unsupervised pattern recognition technique to detect groups in the measured data set [18]. In this research, a PCA was applied to identify groupings of coffee spectra between the different conservation classes (fresh versus expired). Two results of PCA was plotted and discussed (a score vector for each sample on a given principal component and loadings of each wavelengths).
SIMCA is one of popular supervised classification methods, and it is the most commonly used class modeling techniques for the classification of spectral data [19-21]. SIMCA works based on PCA modeling performed for each class in the calibration samples set. Unknown samples in the prediction samples set are compared to the developed PCA class models and assigned to the class according to their analogy with the calibration samples set. In this research, 400 samples were divided into three sets: calibration sample set (202 samples), validation sample set (132 samples) and prediction sample set (66 samples). Evaluation of classification result was performed using parameter of the percentage of correct classification (%CC). The calculation of %CC was done based on previous works [19, 22].
2.4 Software
The calculation of PCA, SIMCA and spectral pre-processing were performed by The Unscrambler software X version 10.4 from CAMO (Computer Aided Modeling, Trondheim, Norway, 30 days-free trial version).
3 Results and discussion
3.1 Spectral data of fresh and expired coffee
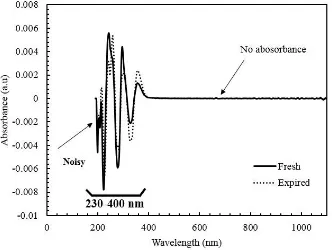
The average pre-processed spectra of fresh and expired coffee samples was showed in Fig. 2. In the initiation of spectral data, a relatively noisy data was observed and spectral region more than 400 nm is almost no absorbance. We can see the spectral difference between fresh and expired coffee samples in the range of 230-400 nm. For this reason, this spectral region was used for further analysis (PCA and SIMCA calculation).
3.2 Result of principal component analysis
PCA is an unsupervised data analysis. In this research, PCA was done to look for similarities and differences beyond the two conservation states of ground roasted coffee, i.e. fresh coffee and expired one. In practice, PCA was performed on a data matrix comprising 400 measured of coffee samples (200 samples for each fresh and expired, respectively) and 171 variables (columns) related with wavelengths (230-400 nm).
The result of PCA is showed in Fig. 3 and Fig. 4. PC1 had a high explained variability value of 94%, PC2 (4%) and PC3 (1%). For this reason, we decided to use the first three PCs (99% of the variability included in the original data set) for interpretation of the data. Using the first three PCs we can see a clear separation between fresh and expired coffee samples. All fresh coffee samples are located in the right positive PC1 while all expired coffee samples are on the left negative PC1.
Fig. 3. Principal component analysis plot of PC1 and PC2 of fresh and expired coffee samples in the range of 230-400 nm.
Fig. 4. Principal component analysis plot of PC1 and PC3 of fresh and expired coffee samples in the range of 230-400 nm.
The loading plot of the first three PCs (PC1, PC2 and PC3) was depicted in Fig. 5. The result indicated that at least four wavelengths (263 nm, 297 nm, 330 nm and 350 nm) have the highest positive and negative loadings. Those wavelengths are related to absorbance of several important chemical components in coffee such as caffeine (263 nm), trigonelline (330 nm), and chlorogenic acid (350 mm) [13-15].
Fig. 5. The x-loadings versus wavelength of first three principal components (PC1, PC2 and PC3) in the range of 230-400 nm.
3.3 Development of SIMCA classification model
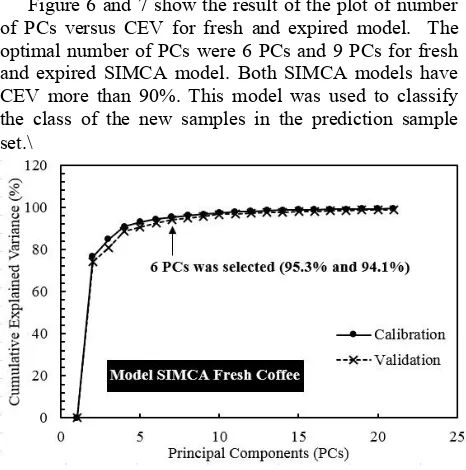
SIMCA is a supervised classification method. It uses samples with known origin (calibration and validation samples set) to develop a classifier which allows to classify new samples (prediction or testing samples set). SIMCA considers different classes which are modeled individually by a separate principal component (PC) model. In SIMCA, it is important to select the optimal number of PC for each class (fresh and expired class). The optimal number of PCs can be chosen based on explained variance or determined by (double) cross-validation [23]. In recent work, Basri et al. utilized two parameters namely predicted residual error sum of squares (PRESS) and explained variance to select optimal number of PCs [24]. In this research, we used cumulative explained variance (CEV, %) to determine optimal number of PCs.
Figure 6 and 7 show the result of the plot of number of PCs versus CEV for fresh and expired model. The optimal number of PCs were 6 PCs and 9 PCs for fresh and expired SIMCA model. Both SIMCA models have CEV more than 90%. This model was used to classify the class of the new samples in the prediction sample set.\
Fig. 7. Number of principal components versus cumulative explained variance for expired SIMCA model.
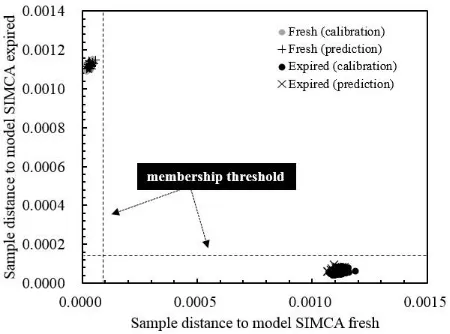
The developed SIMCA model of fresh and expired was used to classify the new samples in prediction samples set (66 samples). The result of classification was visualized using Coomans plot (at 95% confidence level) as depicted in Fig. 8. Here, the distances of samples to each of the two models (fresh and expired) are plotted against each other. We can see that all samples were classified to one of the two predefined class (fresh and expired). No samples were belonging to both classes and none of the two classes. In this regard, we can obtain 100% of correct classification rate both for fresh and expired coffee samples.
Fig. 8. SIMCA Coomans plot of fresh and expired models for classification.
3.4 The result of discrimination power
The discrimination power was used as a parameter for identifying the most important wavelengths for coffee classification (fresh versus expired). The discrimination power obtained from SIMCA classification can be used to visualize which variables discriminate best between PCA models. Generally, wavelengths with discrimination power higher than 3 can be considered to be important for class differentiation [22].
The result of discrimination power was showed in Fig. 9. In general, all wavelengths in the range of 230-400 nm have high discrimination power (more than 3).
have very high discrimination power. Those wavelengths contribute much to the separation between fresh and expired coffee samples.
Fig. 9. Plot of discrimination power versus wavelengths for classification of fresh and expired coffee samples.
4 Conclusions
This research proposes a classification method based on UV-visible spectroscopy and PCA and SIMCA, for identifying the conservation state of Robusta ground roasted coffee (fresh and expired). The results from PCA unsupervised classification techniques shows the formation of clear separation between fresh and expired samples which indicates that fresh samples group differed notably from expired samples group. The classification of new samples using SIMCA method shows that the SIMCA models allowed classification of coffee samples based on the conservation state (fresh and expired) with 100% of correct classification rate. This result suggests that the proposed methods hold promise for the assessment of ground roasted coffee samples using UV-visible spectroscopy and chemometrics.
We express our deepest appreciation to Lampung State Polytechnic, Indonesia and the Indonesian Ministry of Research, Technology and Higher Education (KEMENRISTEKDIKTI) for supporting this research via Penelitian Dosen Pemula (PDP) 2018 (Grant Number: 758.1/PL15.8/PP/2018).
References
1. M.S. Butt, M.T. Sultan, Crit. Rev. Food Sci. Nutr.
51, 363 (2011)
2. ICO (International Coffee Organization) (2018) http://www.ico.org/Accessed 25.04. 2018
3. A.A. Susanti, B. Waryanto (Ed.). Agricultural Statistics 2017 (2017) Retrieved from
http://epublikasi.setjen.pertanian.go.id/download/file /367-statistik-pertanian-2017
5. Pedoman Teknis Pengembangan Kopi (2014)
http://www.ditjenbun.pertanian.go.id/Accessed 25.05.2018
6. M.C. Nicoli, S. Calligaris, L. Manzocco, Food Eng. Rev. 1, 159 (2009)
7. T. Hofmann, P. Schieberle, J. Agric. Food Chem.
50, 319 (2002)
8. T. Wermelinger, L. D`Ambrosio, B. Klopprogge, C. Yeretzian, J. Agric. Food Chem. 59, 9074 (2011)
9. E. Bertone, A. Venturello, A. Giraudo, G. Pellegrino, F. Geobaldo, Food Control 59, 683
(2016)
10. A.P. Craig, B.G. Botelho, L.S. Oliveira, A.S. Franca, Food Chem. 245, 1052 (2018)
11. C. Assis, L.S. Oliveira, M.M. Sena, Food Anal. Methods 11, 578 (2018)
12. E. Schievano, C. Finotello, E. De Angelis, S. Mammi, L. Navarini, J. Agric. Food Chem. 62,
12309 (2014)
13. D. Suhandy, M. Yulia, Int. J. Food Prop. 20, S331
(2017)
14. M. Yulia, D. Suhandy, J. Phys.: Conf. Ser. 835
012010 (2017)
15. D. Suhandy, M. Yulia, Int. J. Food Sci. (2017) 16. D. Suhandy, M. Yulia, IOP Conf. Ser.: Mater. Sci.
Eng. 334 012059 (2018)
17. M. Yulia, D. Suhandy, IOP Conf. Ser.: Mater. Sci. Eng. 334 012062 (2018)
18. P. Ciosek, Z. Brzozka, W. Wroblewski, E. Martinelli, C. Di Natale, A. D`Amico, Talanta, 67,
590 (2005)
19. O. Galtier, O. Abbas, Y. Le Dreau, C. Rebufa, J. Kister, J. Artaud, N. Dupuy, Vib. Spectrosc. 55, 132
(2011)
20. M. Bylesjo, M. Rantalainen, O. Cloarec, J.K. Nicholson, E. Holmes, J. Trygg, J. Chemom. 20,
341 (2006)
21. B. Muik, B. Lendl, A. Molina-Diaz, D. Ortega-Calderon, M.J.J. Ayora-Canada, J. Agric. Food Chem. 52, 6055 (2004)
22. B. Stumpe, T. Engel, B. Steinweg, B. Marschner, Environ. Sci. Technol. 46, 3964 (2012)
23. A. Racz, A. Gere, D. Bajusz, K. Heberger, RSC Adv. 8, 10 (2018)