Since the two investments have different expected returns, it is better to use the coefficient of variation to assess risk than to simply compare standard deviations, because the coefficient of variation. Asset C has the lowest coefficient of variation and is the least risky compared to the other choices. Investors would prefer higher returns but less volatility, and the coefficient of variation provides a measure that takes into account both aspects of investor preferences.
The coefficient of variation is probably the best measure in this case as it provides a standardized method of measuring the risk-return trade-off for investments with different returns. Since Projects 257 and 432 have different expected values, the coefficient of variation should be the criterion by which the risk of the asset is assessed. Based on the standard deviation, asset G appears to have the greatest risk, but it must be measured against its expected return with the statistical measurement coefficient of variation, since the three assets have different expected values.
The two returns differ because of the difference in the exchange rate between the peso and the dollar. Returns on shares of Cyclical Industry Incorporated are more closely related to market performance. Even if the market is growing, Biotech Cures has lost almost half of its value in a few years.
Asset C would be the appropriate choice because it is a defensive asset that moves in opposition to the market. Portfolio A is slightly less risky than the market (average risk), while Portfolio B is riskier than the market. Project E is only half as responsive as the market, but moves in the opposite direction to the market.
The Cost of Capital
Estimated pre-tax costs of d. e) The cost of debt is closer to the actual cost than using the method. However, the shorter approximation is quite accurate. As the tax rate decreases, the WACC increases due to the reduced tax shield against the tax-deductible interest on debt. To determine whether the project is acceptable, the cost of capital can be compared to the return on a project.
The market value approach provides the best value as the costs of the components of the capital structure are calculated based on current market prices. Since the common stock sells for a higher value than its book value, the cost of capital is much higher when using the market value weights. Note that the book value weights give the company a much greater leverage position than when the market value weights are used.
This overweighting of common stock results in a smaller portion of the financing coming from the significantly less costly L-T debt and the lower-cost preferred stock. Between $0 and the cost of common equity is 15% because all common equity comes from retained earnings. It is higher because of the listing costs associated with a new issue of common stock.
Combined by PDF Combine (Unregistered Version) If you want to remove the watermark, please register. e) The firm should accept investments E, C, G, A, and H, since for each of them, the internal rate of return (IRR) on the marginal investment exceeds the weighted marginal cost of capital (WMCC). The other project (ie, I) cannot be accepted as its return of 16% is below the weighted marginal cost of available funds of 16.2%. Weighted average cost of capital/return (%). d) In this problem, projects H, G, and K would be accepted since the IRR for these projects exceeds the WMCC.
Analysts familiar with WorldCom have complained that most of its $105 billion in assets are made up of intangible assets and goodwill built up in the process of nearly 70 acquisitions.
Leverage and Capital Structure
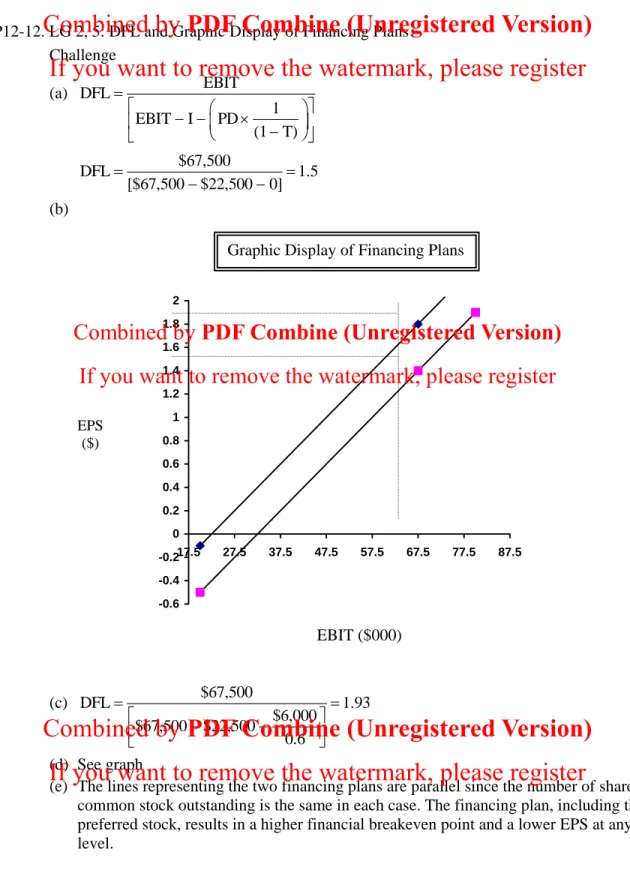
The rate of return, as measured by E(EPS), as shown in part (d), increases steadily as the debt ratio increases, although at some point the rate of increase of EPS begins to decrease (the law of diminishing returns). The risk measured by the CV also increases as the debt ratio increases, but at a faster pace. To calculate the intersection points on the graphical representation of the EBIT-EPS approach to capital structure, the EBIT level corresponding to the EPS of each capital structure must be found using the formula in footnote 22. 1 T) (EBIT I) PD EPS Number of outstanding ordinary shares.
The main problem with this approach is that it does not take into account the maximization of shareholder wealth (ie the share price). A 30% debt capital structure is recommended because it maximizes the value of the stock and meets the objective of maximizing shareholder wealth. Information asymmetry refers to situations in which one party has more and better information than the other stakeholder(s).
This seems to be exactly the situation where managers take on too much debt or lead a buyout of the company. Existing bondholders and possibly shareholders are harmed by the financial risk of over-indebtedness, and existing shareholders are harmed if they accept a buyout price that is less than the price justified by accurate and incomplete information. The board of directors has a fiduciary duty to shareholders, and hopefully also has ethical concerns to bondholders.
The board can and should insist that management disclose all information in its possession about the future plans and risks facing the company (even if it is justified in keeping this out of the hands of competitors). Boards should be careful to select and retain CEOs of high integrity and continue to emphasize an ethical "tone at the top." (Students will no doubt think of other creative mechanisms to deal with this situation).
Dividend Policy
If the company chooses larger capital investments, the dividend payment will thus be less or non-existent. Part (c) employs a policy of low regular and additional dividends, providing investors with a stable income necessary to build confidence in the company. Her share of ownership in the company will remain the same, and as long as the company's earnings remain unchanged, so will her overall share of earnings.
The market price of the stock will fall to maintain the same proportion, as more shares are being used. As long as the firm's profits remain unchanged, his total share of profits will be the same. f) The investor should not have a preference because the only value is of a psychological nature. However, after a stock split or dividend, the stock price tends to rise faster than before.
LG 5, 6: Stock split versus stock dividend firm. a) There would be a decrease in the par value of the share from $3 to $2 per share. stock. However, stock dividends cause an increase in the number of outstanding shares without a decrease in par value. The earnings per per share would decrease as net income remains the same but the number of shares outstanding increases by 20,000.
The earnings per share will decrease as net income remains the same, but the number of shares outstanding increases by 25,000. A stock split causes no change in retained earnings, but reduces the price of the stock in the same proportion as the split ratio. d) The firm may be limited in the amount of retained earnings available for dividend. 342 Part 4 Long-Term Financial Decisions. e) The pre-buyback market price differs from the post-buyback market price by the amount of the cash dividend paid.
If the company repurchases shares, taxes are also due at the time of the repurchase on the appreciation resulting from the purchase.
Hybrid and Derivative Securities
Note: Due to the PVIFA tables in the text only presenting factors to the third decimal place and rounding of interest and repayments to the second decimal place, the totaled principal payments over the term of the loan will be slightly different from the loan amount. As the share price increases, the bond will begin to trade at a premium to the pure bond value due to the increased likelihood of a profitable conversion. For stock prices above point X, the conversion value line is the market price of the bond.
Implied price of all warrants = Price of bond with warrants − Value of plain bond Implied price of all warrants. The table shows that €50 is one-third of the amount between the common share value of €48 and €54; adding one-third of the difference in warrant values corresponding to those stock values (i.e., the warrant value of $9 would result in an expected warrant value of $12 for the common stock value of $50). d) The warrant premium is the result of a combination of investor expectations and the investor's ability to achieve much greater potential returns by trading warrants instead of stocks. The warrant premium is represented in the graph by the area between the theoretical value and the market value of the warrant.
This happens due to the fact that the opportunities for speculative profits also decrease with time. Michaels would increase profitability due to the warrant's high leverage, but the profit potential comes with a higher level of risk. The option would be exercised as the loss is less than the cost of the option.
Compared to buying the option, Carol only risks the purchase price of the option, $600. The option would not be exercised above the strike price; therefore, the loss would be the price of the option, $380. The option would be exercised as the loss amount is less than the option price.
If the price of the stock rises above the strike price, the risk is limited to the price of the put option.
SEKOLAH TINGGI ILMU EKONOMI Y.A.I

